Design, control and optimization of complex fenestration systems of office buildings
198
0
0
Texto completo
(2) PONTIFICIA UNIVERSIDAD CATÓLICA DE CHILE ESCUELA DE INGENIERÍA. DESIGN, CONTROL AND OPTIMIZATION OF COMPLEX FENESTRATION SYSTEMS OF OFFICE BUILDINGS. DANIEL URIBE. Members of the Committee: SERGIO VERA ARAYA PAZ ARROYO RIQUELME WALDO BUSTAMANTE GÓMEZ CHRISTIAN OBERLI GRAF Thesis submitted to the Office of Research and Graduate Studies in partial fulfillment of the requirements for the degree of Master of Science in Engineering. Santiago de Chile, May 2016 c 2016, DANIEL U RIBE.
(3) ”There is a teaching; there are no divisions” (Confucius Analects 15.39).
(4) ACKNOWLEDGEMENTS. This work was funded by the research grant FONDECYT N ◦ 1141240 of the National Commission for Scientific and Technological Research of Chile (CONICYT). The author also gratefully acknowledge the research support provided by the Center for Sustainable Urban Development (CEDEUS) under the research grant CONICYT/FONDAP 15110020. I would like to thank the School of Engineering for patrocining assistance to 49th ASA Conference to present the second chapter of this thesis. Apart from the supporiting entities, I wuold like to thank my advisors Dr. Sergio Vera and Dr. Waldo Bustamante, who helped and guided me all time, and gave me very important opportunities such as researcher and to attend various conferences. I would like to thank Germán Molina, without their help, this work would have been much harder, Ana Fernández who during his exchange he helped the development of the second chapter of this thesis and Andrew McNeil who gets constant assistance during his visit to Chile and through email.. iv.
(5) TABLE OF CONTENTS. ACKNOWLEDGEMENTS. iv. LIST OF FIGURES. ix. LIST OF TABLES. xiii. ABSTRACT. xv. RESUMEN. xvi. 1.. INTRODUCTION Background information . . . . . . . . . . . . . . . . . . . . . . . . . .. 1. 1.1.1.. Complex fenestration systems . . . . . . . . . . . . . . . . . . . . .. 3. 1.1.2.. Visual comfort metrics . . . . . . . . . . . . . . . . . . . . . . . . .. 9. 1.1.3.. Energy and lighting simulation software . . . . . . . . . . . . . . . .. 12. 1.1.4.. Optimization methods in building simulation . . . . . . . . . . . . .. 15. 1.2.. Research opportunities . . . . . . . . . . . . . . . . . . . . . . . . . . .. 18. 1.3.. Objectives. . . . . . . . . . . . . . . . . . . . . . . . . . . . . . . . . .. 19. 1.4.. Hypothesis . . . . . . . . . . . . . . . . . . . . . . . . . . . . . . . . .. 20. 1.5.. Methodology . . . . . . . . . . . . . . . . . . . . . . . . . . . . . . . .. 20. 1.6.. Thesis structure . . . . . . . . . . . . . . . . . . . . . . . . . . . . . . .. 20. 1.7.. Results . . . . . . . . . . . . . . . . . . . . . . . . . . . . . . . . . . .. 21. 1.8.. Conclusions . . . . . . . . . . . . . . . . . . . . . . . . . . . . . . . . .. 23. 1.9.. Future work . . . . . . . . . . . . . . . . . . . . . . . . . . . . . . . . .. 24. 1.1.. 2.. 1. INFLUENCE OF OUTDOOR COMPLEX FENESTRATION SYSTEMS MADE OF ALUMINUM-ZINC ON SOLAR HEAT GAINS, ENERGY CONSUMPTION AND VISUAL COMFORT OF AN OFFICE BUILDING SPACE 2.1.. 25. Abstract . . . . . . . . . . . . . . . . . . . . . . . . . . . . . . . . . . . v. 25.
(6) 2.2.. Introduction . . . . . . . . . . . . . . . . . . . . . . . . . . . . . . . . .. 25. 2.3.. Research methodology . . . . . . . . . . . . . . . . . . . . . . . . . . .. 30. 2.3.1.. Description of the CFS evaluated and office space . . . . . . . . . . .. 30. 2.3.2.. Simulation process . . . . . . . . . . . . . . . . . . . . . . . . . . .. 33. 2.3.3.. Metrics for the assessment of CFS . . . . . . . . . . . . . . . . . . .. 35. Results and analysis . . . . . . . . . . . . . . . . . . . . . . . . . . . .. 36. 2.4.1.. Solar heat gains . . . . . . . . . . . . . . . . . . . . . . . . . . . .. 36. 2.4.2.. Visual comfort . . . . . . . . . . . . . . . . . . . . . . . . . . . . .. 39. 2.4.3.. Energy consumption . . . . . . . . . . . . . . . . . . . . . . . . . .. 43. Conclusions . . . . . . . . . . . . . . . . . . . . . . . . . . . . . . . . .. 44. 2.4.. 2.5.. 3.. INTEGRATED THERMAL AND LIGHTING PERFORMANCE SIMULATIONS FOR MINIMIZING ENERGY CONSUMPTION OF OFFICE BUILDINGS WITH COMPLEX FENESTRATION SYSTEMS. 46. 3.1.. Abstract . . . . . . . . . . . . . . . . . . . . . . . . . . . . . . . . . . .. 46. 3.2.. Introduction . . . . . . . . . . . . . . . . . . . . . . . . . . . . . . . . .. 47. 3.3.. Methodology . . . . . . . . . . . . . . . . . . . . . . . . . . . . . . . .. 49. 3.3.1.. Office space building . . . . . . . . . . . . . . . . . . . . . . . . . .. 51. 3.3.2.. Complex fenestration systems . . . . . . . . . . . . . . . . . . . . .. 53. 3.3.3.. Control strategy . . . . . . . . . . . . . . . . . . . . . . . . . . . .. 57. 3.3.4.. Visual comfort evaluation . . . . . . . . . . . . . . . . . . . . . . .. 58. 3.3.5.. Simulation tool . . . . . . . . . . . . . . . . . . . . . . . . . . . . .. 59. Results and analysis . . . . . . . . . . . . . . . . . . . . . . . . . . . .. 61. 3.4.1.. Lighting results . . . . . . . . . . . . . . . . . . . . . . . . . . . . .. 61. 3.4.2.. Energy results . . . . . . . . . . . . . . . . . . . . . . . . . . . . .. 61. 3.4.3.. Optimum results . . . . . . . . . . . . . . . . . . . . . . . . . . . .. 65. 3.4.4.. Time efficiency . . . . . . . . . . . . . . . . . . . . . . . . . . . . .. 66. Conclusions . . . . . . . . . . . . . . . . . . . . . . . . . . . . . . . . .. 68. 3.4.. 3.5.. vi.
(7) 4.. IMPACT OF DIFFERENT CONTROL STRATEGIES OF DYNAMIC COMPLEX FENESTRATION SYSTEMS AND LUMINAIRES SYSTEMS IN VISUAL COMFORT AND ENERGY CONSUMPTION OF OFFICE BUILDINGS. 5.. 70. 4.1.. Abstract . . . . . . . . . . . . . . . . . . . . . . . . . . . . . . . . . . .. 70. 4.2.. Introduction . . . . . . . . . . . . . . . . . . . . . . . . . . . . . . . . .. 71. 4.3.. Methodology . . . . . . . . . . . . . . . . . . . . . . . . . . . . . . . .. 76. 4.3.1.. Office space building . . . . . . . . . . . . . . . . . . . . . . . . . .. 77. 4.3.2.. Complex fenestration systems . . . . . . . . . . . . . . . . . . . . .. 79. 4.3.3.. Simulation tool . . . . . . . . . . . . . . . . . . . . . . . . . . . . .. 82. 4.3.4.. Control strategies . . . . . . . . . . . . . . . . . . . . . . . . . . . .. 84. 4.3.5.. Visual comfort evaluation . . . . . . . . . . . . . . . . . . . . . . .. 89. 4.4.. Results and analysis . . . . . . . . . . . . . . . . . . . . . . . . . . . .. 92. 4.5.. Conclusions . . . . . . . . . . . . . . . . . . . . . . . . . . . . . . . . . 101. OPTIMIZATION OF A FIXED OUTDOOR COMPLEX FENESTRATION SYSTEM FOR ACHIEVING VISUAL COMFORT AND ENERGY PERFORMANCE CRITERIA. 103. 5.1.. Abstract . . . . . . . . . . . . . . . . . . . . . . . . . . . . . . . . . . . 103. 5.2.. Introduction . . . . . . . . . . . . . . . . . . . . . . . . . . . . . . . . . 104. 5.3.. Methodology . . . . . . . . . . . . . . . . . . . . . . . . . . . . . . . . 108. 5.3.1.. Office space building . . . . . . . . . . . . . . . . . . . . . . . . . . 108. 5.3.2.. Complex fenestration system . . . . . . . . . . . . . . . . . . . . . . 111. 5.3.3.. Performance indicators . . . . . . . . . . . . . . . . . . . . . . . . . 112. 5.3.4.. Optimization problem . . . . . . . . . . . . . . . . . . . . . . . . . 113. 5.3.5.. Optimization algorithm . . . . . . . . . . . . . . . . . . . . . . . . . 115. 5.3.6.. Optimization process . . . . . . . . . . . . . . . . . . . . . . . . . . 118. 5.4.. Results and analysis . . . . . . . . . . . . . . . . . . . . . . . . . . . . 120. 5.4.1.. Optimization results . . . . . . . . . . . . . . . . . . . . . . . . . . 120. 5.4.2.. Energy and lighting results . . . . . . . . . . . . . . . . . . . . . . . 121 vii.
(8) 5.4.3. 5.5.. Results validation . . . . . . . . . . . . . . . . . . . . . . . . . . . 122. Conclusions . . . . . . . . . . . . . . . . . . . . . . . . . . . . . . . . . 124. REFERENCES. 126. APPENDIX. 137. A.. Methodology for thermal and lighting analysis . . . . . . . . . . . . . . . . 138. B.. Perl Scripts used for making the lighting and the EnergyPlus simulation in Chapter 5 . . . . . . . . . . . . . . . . . . . . . . . . . . . . . . . . . . 139. C.. Control strategies used in lighting simulation in Chapter 4 . . . . . . . . . . 168. D.. Scripts used in optimization of Chapter 5 . . . . . . . . . . . . . . . . . . 179. viii.
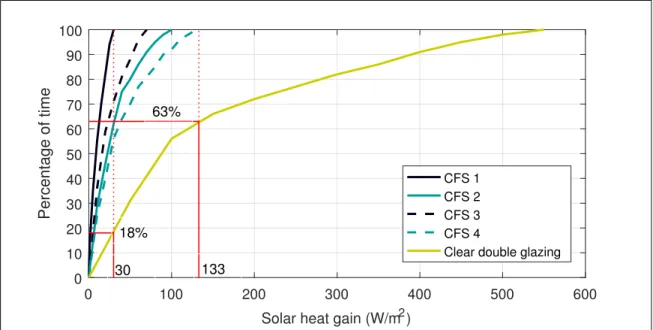
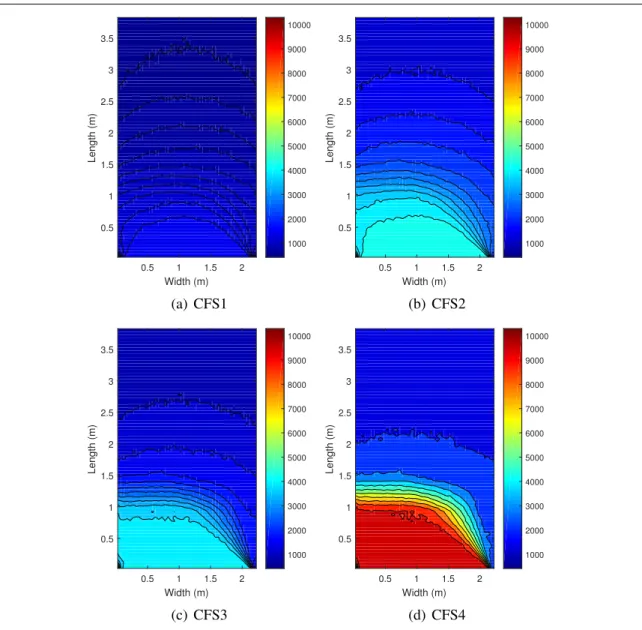
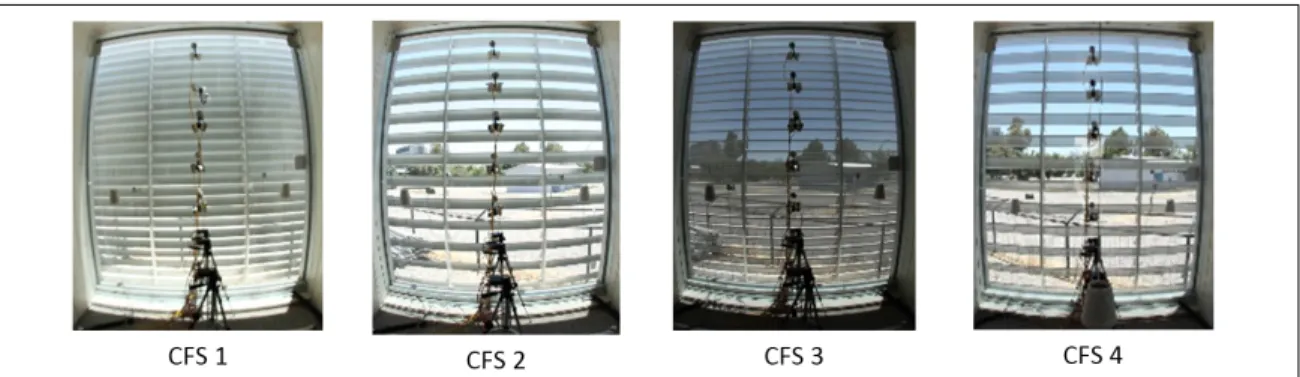
(9) LIST OF FIGURES. 1.1. Building with curtain wall configuration. (a) Le Meridien Cairo, International Airport Hotel, Cairo (Egypt). (b) Hydro Palace, Manitoba (Canada). (c) Seattle Central Library, Seattle (USA). (d) CorpBanca Building, Santiago (Chile). . .. 1.2. Comparison of solar ray transmission of: (a) specular material (e.g. glass). (b) a non-secular material (e.g. CFS). Adapted from (McNeil, 2015a). . . . . . .. 1.3. 2. 4. Illustraion of Bidirectional Scattering Distribution Function (BSDF) (McNeil, 2015a). . . . . . . . . . . . . . . . . . . . . . . . . . . . . . . . . . . . .. 5. 2.1. Titanium Tower, a 60-story building located in Santiago of Chile. . . . . . .. 27. 2.2. Comparison of solar ray transmission of: (a) specular material (e.g. glass). (b) a non-secular material (e.g. CFS). Adapted from (McNeil, 2015a). . . . . . .. 28. 2.3. Pictures of two evaluated CFS. . . . . . . . . . . . . . . . . . . . . . . . .. 30. 2.4. Schematic arrangement of the evaluated cases with CFS. Adapted from (HunterDouglas, 2013). . . . . . . . . . . . . . . . . . . . . . . . . . . . .. 31. 2.5. Model of the office space with CFS in SketchUp. . . . . . . . . . . . . . . .. 32. 2.6. Flow chart of simulation process. . . . . . . . . . . . . . . . . . . . . . . .. 34. 2.7. Accumulative curves of SHG of different CFS and clear double glazing. . . .. 38. 2.8. Illuminance level (lux) at workplane for different CFS, January 21th at 2 PM.. 42. 2.9. Outdoor visibility of the different CFS at 2 PM of fenestration façade oriented northwest. . . . . . . . . . . . . . . . . . . . . . . . . . . . . . . . . . . .. 43. 2.10 Measured energy consumption for lighting, heating and cooling (kWh/year) for different CFS. . . . . . . . . . . . . . . . . . . . . . . . . . . . . . . . . . ix. 43.
(10) 3.1. Flow chart of the methodology to determine the optimum control algorithm for each case. . . . . . . . . . . . . . . . . . . . . . . . . . . . . . . . . . . .. 3.2. 50. Model of the office space with louvers and interior dimensions (m), plain view and side view. . . . . . . . . . . . . . . . . . . . . . . . . . . . . . . . . .. 54. 3.3. Dimensions of venetian blinds. . . . . . . . . . . . . . . . . . . . . . . . .. 54. 3.4. Perforated undulated louvers. (a) 3D view of louver. (b) Louver dimensions (mm). (c) Perforation dimensions (mm). (d) Installed louver dimensions (mm). Adapted from (HunterDouglas, 2013). . . . . . . . . . . . . . . . . . . . .. 3.5. 55. Perforated undulated louvers. (a) Perforation pattern. (b) Outdoor visibility of CFS. . . . . . . . . . . . . . . . . . . . . . . . . . . . . . . . . . . . . . .. 55. 3.6. Irradiance control of CFS. . . . . . . . . . . . . . . . . . . . . . . . . . . .. 58. 3.7. sDA300/50% and ASE2000/400h for each CFS. . . . . . . . . . . . . . . . . . .. 62. 3.8. Consumption of lighting, heating and cooling foreach CFS (kWh/year) respect. 3.9. maximum irradiance level. . . . . . . . . . . . . . . . . . . . . . . . . . .. 63. Total consumption for each CFS (kWh/year). . . . . . . . . . . . . . . . . .. 64. 3.10 Determination of the optimum irradiance level for office space with venetian blinds at Montreal. . . . . . . . . . . . . . . . . . . . . . . . . . . . . . .. 65. 3.11 Optimum energy consumption (kWh/year) for each city and CFS. . . . . . .. 67. 4.1. Model of the office space with louvers and interior dimensions (m), plain view and side view. . . . . . . . . . . . . . . . . . . . . . . . . . . . . . . . . .. 4.2. 79. Perforated undulated louvers. (a) 3D view of louver. (b) Louver dimensions (mm). (c) Perforation dimensions (mm). (d) Installed louver dimensions (mm). Adapted from (HunterDouglas, 2013). . . . . . . . . . . . . . . . . . . . . x. 80.
(11) 4.3. Perforated undulated louvers. (a) Perforation pattern. (b) Outdoor visibility of CFS. . . . . . . . . . . . . . . . . . . . . . . . . . . . . . . . . . . . . . .. 80. 4.4. Incident irradiance control. . . . . . . . . . . . . . . . . . . . . . . . . . .. 85. 4.5. Cut-off angle β1 defined by Chan and Tzempelikos (2013) and β2 defined by Bueno, Wienold, Katsifaraki, and Kuhn (2015) in respect of the profile angle Ω. 87. 4.6. (a) Avoiding a second reflection but transmitted light direction will cause glare high profile angel/cut-off slat angle (Chan & Tzempelikos, 2013). (b) Angle definition use in equations (Chan & Tzempelikos, 2013). . . . . . . . . . . .. 87. 4.7. Cut-off angle (β1 and β2 ) and βdesign in function of profile angle (Ω). . . . . .. 88. 4.8. Flow chart of blocking control for light redirection. Adapted from (Chan & Tzempelikos, 2013). . . . . . . . . . . . . . . . . . . . . . . . . . . . . . .. 4.9. 89. Position of the CFS during July, 20th and 21th at Montreal and south façade orientation for each scenario. . . . . . . . . . . . . . . . . . . . . . . . . .. 93. 4.10 Position of the CFS during January, 1st and 2nd at Montreal and south façade orientation for each scenario. . . . . . . . . . . . . . . . . . . . . . . . . .. 94. 4.11 Boxplot with position of the CFS for each scenario, south/north façade orientation. . . . . . . . . . . . . . . . . . . . . . . . . . . . . . . . . . .. 96. 4.12 Boxplot with position of the CFS for each scenario, west façade orientation. .. 97. 4.13 Measured energy consumption for lighting, heating and cooling (kWh/year) for each scenario. . . . . . . . . . . . . . . . . . . . . . . . . . . . . . . . . . 5.1. 98. Model of the office space with louvers and interior dimensions (m), plain view and side view. . . . . . . . . . . . . . . . . . . . . . . . . . . . . . . . . . 109 xi.
(12) 5.2. Perforated undulated louvers. (a) 3D view of louver. (b) Louver dimensions (mm). (c) Perforation pattern. (d) Installed louver. Adapted from (HunterDouglas, 2013). . . . . . . . . . . . . . . . . . . . . . . . . . . . . 111. 5.3. Penalty functions. (a) sDAM , and (b) ASEM . . . . . . . . . . . . . . . . . 114. 5.4. Workflow using mkSchedule and GenOpt solver. . . . . . . . . . . . . . . . 119. 5.5. Optimized solution for each city. . . . . . . . . . . . . . . . . . . . . . . . 120. 5.6. Measured energy consumption for lighting, heating and cooling (kWh/year) for each scenario. . . . . . . . . . . . . . . . . . . . . . . . . . . . . . . . . . 121. A.1. Flow chart of the proposed methodology for integrating lighting and thermal/energy simulations (Vera, Bustamante, Molina, & Uribe, 2016). . . . 138. xii.
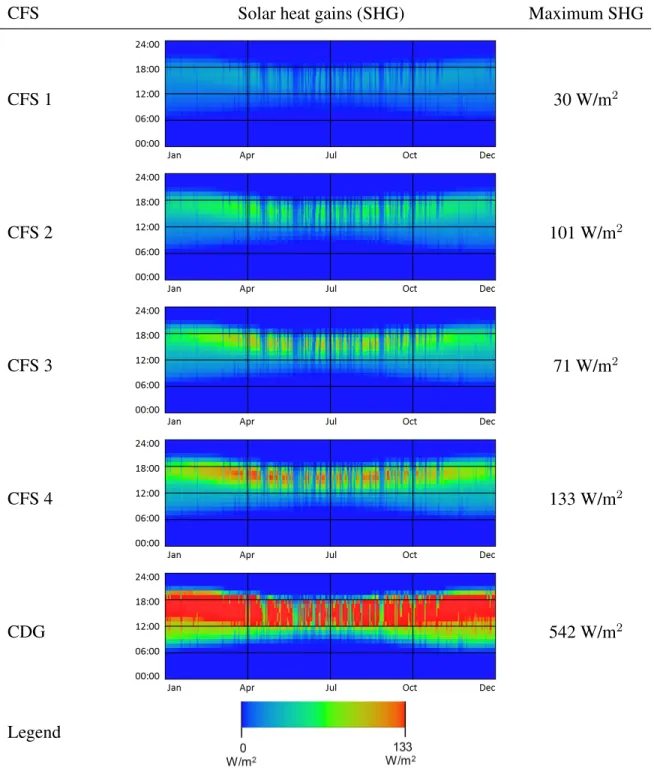
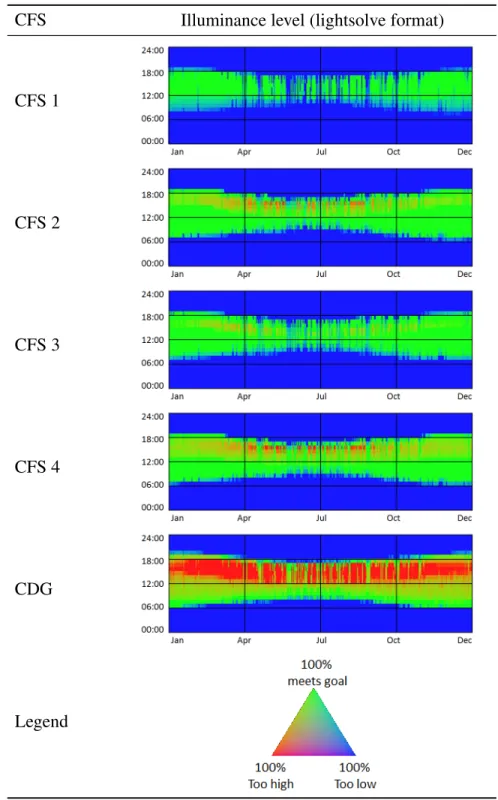
(13) LIST OF TABLES. 2.1. CFS evaluated. . . . . . . . . . . . . . . . . . . . . . . . . . . . . . . . .. 2.2. Temporal maps of annual solar heat gains of different CFS and clear double. 32. glazing. . . . . . . . . . . . . . . . . . . . . . . . . . . . . . . . . . . . .. 37. 2.4. sDA300/50% and ASE4000/400h values for each CFS and DCG. . . . . . . . . .. 39. 2.3. Temporal maps of annual illuminance in Lightsolve format, values within 300 lux-4000 lux. . . . . . . . . . . . . . . . . . . . . . . . . . . . . . . . . .. 2.5. 40. Comparison between exact solution (ES) and optimized solution (OS) performance of visual comfort and energy consumption. . . . . . . . . . . .. 44. 3.1. Simulation layout. . . . . . . . . . . . . . . . . . . . . . . . . . . . . . . .. 52. 3.2. Solar heat gain coefficient (SHGC), visible transmission coefficient (Tvis ) and U-value for shadings. . . . . . . . . . . . . . . . . . . . . . . . . . . . . .. 57. 3.3. Optimum maximum irradiance level (W/m2 ) for each city and CFS. . . . . .. 66. 3.4. Simulation time. . . . . . . . . . . . . . . . . . . . . . . . . . . . . . . . .. 67. 4.1. Review of the criteria for control of shading devices in office buildings. . . .. 73. 4.2. Simulation layout. . . . . . . . . . . . . . . . . . . . . . . . . . . . . . . .. 77. 4.3. Solar heat gain coefficient (SHGC), visible transmission coefficient (Tvis ) and U-value (Wm−1 K−1 ) for louvers. . . . . . . . . . . . . . . . . . . . . . . .. 82. 4.4. Control strategies. Definition and steps. . . . . . . . . . . . . . . . . . . . .. 84. 4.5. Glare rating of Daylight Glare Probability (DGP) (Wienold, 2009). . . . . . .. 92. 4.6. Daylight performance indicators for each scenario, south/north orientation. .. 99. xiii.
(14) 4.7. Daylight performance indicators for each scenario, west orientation. . . . . . 100. 5.1. Simulation layout. . . . . . . . . . . . . . . . . . . . . . . . . . . . . . . . 110. 5.2. Optimization parameters. Range and steps. . . . . . . . . . . . . . . . . . . 112. 5.3. Parameters of the Particle Swarm Optimization algortihm. . . . . . . . . . . 117. 5.4. Parameters of the GPS Hooke-Jeeves algortihm. . . . . . . . . . . . . . . . 118. 5.5. Energy consumption for each scenario: double clear glazing (DCG) and optimized solution (OS). . . . . . . . . . . . . . . . . . . . . . . . . . . . 121. 5.6. Temporal maps of annual illuminance in lightsolve format for Montreal, values within 300 lux - 2000 lux. . . . . . . . . . . . . . . . . . . . . . . . . . . . 123. 5.7. Variables for exact solution (ES) and optimized solution (OS). . . . . . . . . 124. 5.8. Comparison between exact solution (ES) and optimized solution (OS) performance of visual comfort and energy consumption. . . . . . . . . . . . 124. xiv.
(15) ABSTRACT. The building sector accounts for 40% of the total energy consumption and one-third of the green gas house emissions. Highly glazed façades are a common element use for the architects in the modern office buildings that can produce occupants’ visual discomfort and high energy consumption. Complex fenestration systems (CFS) have a fundamental role in the energy performance of office buildings, controlling solar gains and transmission of visible light. The term CFS refers to non-specular solar protection systems that redirect solar radiation in complex form. CFS can provide visual and thermal comfort to occupants if properly designed, reducing the energy consumption of buildings, overheating and glare, while improving the transmission of visible light. This thesis presents research about the design and optimization of CFS, which is divided into: (1) the influence of louvers made of aluzinc on solar heat gains, energy consumption and occupants’ visual comfort; (2) a case study of the use of mkSchedule, an integrated lighting and thermal simulations tool to design and/or evaluate control strategies for two movable CFS in the early design stages of buildings; (3) evaluation of control strategies of CFS; and (4) a optimization of a fixed CFS under visual comfort and energy consumption criteria.. Keywords: integrated thermal and lighting simulations, daylight metrics, complex fenestration sytems, control strategies, façade optimization. xv.
(16) RESUMEN. El sector de edificación consume el 40% de la energı́a y genera un tercio de las emisiones de gases invernadero a nivel mundial. Las fachadas altamente vidriadas son un elemento común en la arquitectura moderna de los edificios de oficinas que puede producir disconfort visual en los ocupantes y alto consumo energético. Los sistemas complejos de fenestración (CFS por sus siglas en inglés) tienen un rol fundamental en el desempeño energético de edificios de oficinas, controlando las ganancias solares y la transmisión de luz visible. El término CFS se refiere a sistemas de protección solar no especulares que redirigen la radiación solar en forma compleja. Los CFS pueden proveer confort visual y térmico a los ocupantes si son diseñados correctamente, reduciendo el consumo de energı́a de edificios, el sobrecalentamiento y el encandilamiento, mientras mejoran la transmisión de luz visible. Este trabajo presenta la investigación sobre el diseño y optimización de CFS, el cual se divide en: (1) la influencia de lamas hechas de aluzinc sobre las ganancias solares, consumo energético y el confort visual de los ocupantes; (2) caso de estudio del uso de mkSchedule, una herramienta integrada de simulaciones lumı́nicas y térmicas, para diseñar y/o evaluar las estrategias de control de dos CFS móviles en las etapas tempranas de diseño de edificios; (3) evaluación de algoritmos de control de CFS; y (4) optimización de un CFS fijo bajo criterios de confort visual y consumo de energı́a.. Palabras Claves: Simulación térmica y lumı́nica integrada, métricas de confort visual, sistemas complejos de fenestración, estrategias de control, optimización de fachada. xvi.
(17) 1. INTRODUCTION 1.1. Background information The building sector accounts for 40% of the total energy consumption and one-third of the green gas house emissions (UNEP, 2009). Different architectural design strategies could be implemented to achieve high thermal and energy performance of office buildings in climates like Santiago of Chile (i.e. reduce window-to-wall ratio, windows with very low solar heat gain coefficient or SHGC, high efficient lighting with very low heat gains, etc.). Last decades, higly glazed façades are commonly implemented for the architects in the modern office buildings (Serra, Zanghirella, & Perino, 2010; Basurto, Kämpf, & Scartezzini, 2015). Curtain walls are commonly used in commercial buildings, because of the typical large glazing area of curtain walls and the relatively low thermal performance of metal and glass, the energy consumption of buildings with curtain walls is more sensitive to the weather conditions and the variation of façade design compared to buildings with opaque insulated façade (Lam, Ge, & Fazio, 2015). Most of the buildings are designed with fully glazed façades as the ones shown in Figure 1.1, following a global architectural tendency in different climates. These types of buildings are affected by excessive solar heat gains (SHG), which turns in high cooling energy consumption and visual discomfort. Daylighting is an important factor that affect in visual comfort (Yun, Yoon, & Kim, 2014) and SHG through windows highly impact on the building energy performance and occupant’s comfort. Several authors have reported the large contribution of SHG through fenestration to cooling loads in warm and cold climates (Reilly & Hawthorne, 1998; Li & Lam, 2000; Winkelmann, 2001; Kuhn, 2006; Lam et al., 2015). Thermal and visual comfort as well as the energy consumption for lighting, heating and cooling are strongly determined by optical and thermal properties of glazed façades. The impact on demands and energy consumption of air conditioning and transmitted daylight inwards have been extensively studied by scientist community (Goia, Haase, & Perino, 2013; Correia da. 1.
(18) (a). (b). (c). (d). Figure 1.1. Building with curtain wall configuration. (a) Le Meridien Cairo, International Airport Hotel, Cairo (Egypt). (b) Hydro Palace, Manitoba (Canada). (c) Seattle Central Library, Seattle (USA). (d) CorpBanca Building, Santiago (Chile).. 2.
(19) Silva, Leal, & Andersen, 2013; Ochoa, Aries, van Loenen, & Hensen, 2012; Wagner, Gossauer, Moosmann, Gropp, & Leonhart, 2007; Konis, 2013; Breesch & Janssens, 2010). Exterior shading devices are effective architectural building skins to reduce SHG through glazed façades because they intercept solar radiation before it reaches the glass. Fully shaded glazing façades can reduce SHG up to 80% according to ASHRAE (2013), while Bustamante, Vera, and Prieto (2014) have reported reduction of short wave solar transmissions above 90% due to outdoor shading devices such as rollers and undulated and perforated metallic screens. Shading devices perform well to reduce SHG and to provide visual comfort for the occupants. This thesis is focused on the effects on energy consumption and visual comfort in office spaces with outdoor fixed and movable shading devices, and also, on the design of these devices by parametric analysis and optimization processes. In the following sections a description of fixed and movable shading devices or complex fenestration systems (CFS), their effect on energy consumption and visual comfort, comfort visual metrics, energy and lighting simulation software and optimization processes in office buildings are explained.. 1.1.1. Complex fenestration systems It is a common architectural practice to incorporate exterior shading devices to control SHG. There is a large variety of exterior shading devices such as louvers (fixed and movable), venetian blinds, and perforated screens. However, most of these devices correspond to a non-specularly transmitting layer, thus they are defined as complex fenestration systems (CFS). In the following sections a description and definitions of CFS, characterization of CFS and kinds of CFS with their effects on visual comfort and energy consumption are explained.. 3.
(20) 1.1.1.1. CFS definition Define the CFS is not easy, previously it mentioned that CFS correspond to a nonspecularly transmitting layer, as shows in Figure 1.2. The problem arises because the thermal and optical properties of CFS are commonly unknown and most of building energy simulation tools consider them in simplified ways. As consequence, this situation makes difficult to evaluate the impact of CFS on the thermal performance of buildings, especially during the early design stages.. (a). (b). Figure 1.2. Comparison of solar ray transmission of: (a) specular material (e.g. glass). (b) a non-secular material (e.g. CFS). Adapted from (McNeil, 2015a). From the point of view of the calculation, the definition of complex fenestration systems is not clear or formal. It defined as a complex system that the software WINDOW can not represent (McCluney, 2002), as windows that incorporate non specular layer (Laouadi & Parekh, 2007), or generally as unmanageable systems analytically because they have irregular geometries and/or highly reflective materials, or layers found somewhere between perfect specular (such as any glass) and the perfect diffusivity (as often seen fabrics). In summary, the complex façades can be seen as all those for which do not apply analytical equations Examples of CFS are those that include external protection devices such 4.
(21) as external blinds, horizontal or vertical undulated louvers, perforated or microperforated elements.. 1.1.1.2. CFS characterization According to McNeil (2015b), a bidirectional scattering distribution function (BSDF) describes the way that light interacts with a material including the amount and direction of reflected and transmitted light. BSDF is a combination of bidirectional transmission distribution function (BTDF) and bidirectional reflection distribution function (BRDF). A BSDF file can describe an entire fenestration system, including several layers of specular and scattering components or a BSDF file can be describe a single component of a fenestration system. In Figure 1.3 shows a illustration of BSDF and how varies the transmission distribution in respect of the incident angle of sunlight.. Figure 1.3. Illustraion of Bidirectional Scattering Distribution Function (BSDF) (McNeil, 2015a).. 1.1.1.3. Types of fixed and movable CFS According to Appelfeld, McNeil, and Svendsen (2012), the design criteria for windows and CFS in modern building are: • Energy use (heating, cooling and electrical lighting) 5.
(22) • Thermal comfort (overheating) • Visual comfort (daylight, glare, view to outside) To meet these objectives, there are many kinds of outdoor CFS as it mentioned previously. Following it presents several studies that explain the effect of the different kind of CFS. It should be noted that the focus of this thesis are the outdoor CFS. Exterior CFS has been studied by scientist community, the most commonly studies are focused on venetian blinds (Kirimtat, Koyunbaba, Chatzikonstantinou, & Sariyildiz, 2016; Yun et al., 2014; E. Shen, Hu, & Patel, 2014; Correia da Silva et al., 2013; Chan & Tzempelikos, 2013; Bueno et al., 2015) and combined systems like venetian blinds with roller shades or fabrics (H. Shen & Tzempelikos, 2012; Tzempelikos & Shen, 2013; Chan & Tzempelikos, 2015; Bueno et al., 2015). The aims of these devices are to reduce energy consumption of the buildings in terms of lighting, cooling and heating, and, improve the visual comfort of occupants related to glare control, daylighting maximization and exterior vision. Is needed collect comparable data on existing buildings with different shading devices and from various climatic areas in the world (Bellia, Marino, Minichiello, & Pedace, 2014). Perforated screens is a tendency in modern building design (Blanco, Arriaga, Rojı́, & Cuadrado, 2014; Mainini, Poli, Zinzi, & Speroni, 2014). Appelfeld et al. (2012) studied the behaviour of a micro structural perforated shading screen and compare with roller blind and venetian blind through simulations (calculate the optical properties using genBSDF and WINDOW 6) and experiments. They concludes that there was a strong correlation between the measurements and simulations of perforated shadings, and the screen provides similar shading effect as the venetian blinds. Mainini et al. (2014) studied different metal screens like perforated metal sheets, stamped metal sheets and metal mesh grids with 40% openness factor. They obtained angular light and solar transmittance measurement of this device through a experiment, and then, the data collected were integrated to obtain visible and solar transmittance using WINDOW 6.2. Finally, they use these information for evaluate the thermal behaviour of an office with curtain wall, but experimental 6.
(23) measurements are needed to apply this methodology. Stazi, Marinelli, Perna, and Munafo (2014) monitored the behaviour of real aluminium sliding perforated panels and the experimental data may be useful for other authors for the calibration of numerical models for shading devices. Blanco et al. (2014) developed a theorical model for predicting the thermal behaviour of double skin façade with glass and sheet-panels, which was, validate through experiments. This panels is able to filter the direct radiation thus significantly lowering the temperatures of the internal glass surface. This a good investigation, but they does not considerer the visual comfort and daylight performance. Blanco, Buruaga, Rojı́, Cuadrado, and Pelaz (2016) studied the optimization methodology to design double skin enclosure built with metal perforated sheet panels. This CFS controlled the light and SHG changing opening areas or perforations depending on location and orientation of façade, but like the previous study, they does not considerer daylight performance. Dynamic CFS have the potential to improve buildings’ energy performance as indicated by several studies (Tzempelikos & Athienitis, 2007; H. Shen & Tzempelikos, 2012; Tzempelikos & Shen, 2013; Konstantoglou & Tsangrassoulis, 2016). According to Correia da Silva et al. (2013), office buildings occupants will activate or deactivate the shadings based on three different types of criteria: • Quantity of daylight (illuminance) that falls on the workplane. • Visual discomfort related to glare, accounted indirectly by window luminances, transmitted solar radiation or directly by daylight glare indexes. • Direct solar radiation, which can create both thermal and visual discomfort. According to literature, criteria for control of movable shading devices in office buildings are presented below. Chan and Tzempelikos (2013) evaluated venetian blinds with slat’s surface with two specularity values (0 and 0.8) and combination of these, in Philadelphia (USA) for south and west orientations. They used three strategies, cut off-angle, ”blocking” control (set blinds perpendicular to profile angle when a second reflection is possible and redirect transmitted light when cut-off angle redirection is not effective). 7.
(24) and glare control (rotate blinds when DGP index > 35%). They conclude that a combination of glare strategies would yield the best results depending on climate, window properties and orientation. Yun et al. (2014) evaluated venetian blinds in Incheon (South Korea) for the south, west and east orientations. They used fixed blinds and one case with dynamic blinds controlled by glare. They found that dynamic shading control with the dimmed lights was the best case for the east and the west façade, while, the case of 0 ◦ slat angle represents the smallest energy consumption for the south facçade. Konstantzos, Tzempelikos, and Chan (2015) evaluate controlled roller shades in office space in in West Lafayette (Indiana, USA) for south façade orientation. Three controls were evaluated, fully closed shades, work plane protection (prevents direct sunlight from falling on the work plane) and advanced control (prevent high workplane illuminances > 2000 lux at all times and maximize daylight provision under cloudy sky conditions). The advanced shading control is able to protect from glare for most of the time. Vera et al. (2016) evaluated exterior venetian blinds in San Francisco (USA) for south façade orientation. Control strategies are based on outdoor dry-bulb temperature and irradiance over the window. Liu, Wittchen, and Heiselberg (2015) evaluated intelligent glazed façade through glare and cut-off angle (during occupied hours blinds cut the direct solar radiation, and during unoccupied hours, the blind is controlled by temperature), in Buddinge (Denmark) for the four cardinal orientations. Bueno et al. (2015) evaluate two systems, Winglamella (highly reflective Aluminium material) perforated and non-perforated, and Warema venetian blinds with double clear glazing in Villafranca di Verona (Italy), for the south, west and east orientations. They used two controls, cut-off angle and retro (60 ◦ ), similar to cut-off angle. Winglamella system is a device composed of two separately mechanically controlled partitions (perforated in upper part, and non-perforated in lower part). This system is particularly suitable for east and west façade orientations. De Michele, Oberegger, and Baglivo (2015) evaluate venetian blinds in a shopping mall located in Genoa (Italy) for west façade orientation. Use two controls, one depend of internal air temperature and incident solar radiation on faa̧de, and the second depend of illuminance level on workplace. 8.
(25) Dynamic CFS are not always the best from an economic point of view (installation and maintenance can be more expensive than fixed CFS) (Nielsen, Svendsen, & Jensen, 2011). Thus, it is required the evaluation of different control strategies in real time to obtain the best option of movable CFS in terms of visual comfort and energy performance (Bastien & Athienitis, 2012). Development in the shading strategies, materials used and comfort parameters inside the buildings should profoundly be coped with (Kirimtat et al., 2016).. 1.1.2. Visual comfort metrics There are two types of visual comfort metrics, those related to illuminance level at workplane (e.g. daylight autonomy and useful daylight illuminance), and those related with the illuminance level at eye observer (glare indices). Comfort metrics related with illuminance level at workplane are described below, follow by metrics associates to glare indices.. 1.1.2.1. Metrics for illuminance level at the workplane Daylight Factor (DF) was developed in the early 20th century in United Kingdom. DF is a ratio that represents the amount of illuminance available indoors relative to the illumination present outdoors at the same time under overcast skies, expressed in percent. The higher the DF, the more natural light is available in the room (Daylighting Pattern Guide, n.d.). Practitioners encounter guidelines and recommendations for target DF values that they know are likely to result in over-glazed buildings with excessive solar gain and/or heat loss (Mardaljevic, Heschong, & Lee, 2009). Daylight Autonomy (DA) is a climate-based metric that represents how often in the year a specified illuminance is achieved (C. Reinhart & Mardaljevic, 2006). It is a major innovation since it considers geographic location specific weather information on an annual basis. It also relates power to electric lighting energy savings if the user defined threshold is set based upon electric lighting criteria. The user is free to set the threshold above which DA is calculated (Daylighting Pattern Guide, n.d.) 9.
(26) Useful Daylight Illuminance (UDI) is defined as the annual occurrence of illuminances across the work plane that are within a range considered useful by occupants. The UDI range is further subdivided into two ranges called UDI-supplementary and UDIautonomous. UDI-supplementary gives the occurrence of daylight illuminances in the range of 100-500 lux. For these levels of illuminance, additional artificial lighting may be needed to supplement the daylight for common tasks such as reading. UDI-autonomous gives the occurrence of daylight illuminances in the range of 500-2500 lux, where additional artificial lighting will most likely not be needed (Mardaljevic et al., 2009). Spacial Daylight Autonomy (sDA) and Annual Sunlight Exposure (ASE) were developed by Illuminating Engineering Society (IES) (IES, 2013). sDA is a metric describing annual sufficiency of ambient daylight levels in interior environments. It is defined as the percentage of an analysis area that meets a minimum daylight illuminance level for a specified fraction of the operating hours per year. sDA300/50% is recommended as the preferred metric for analysis of daylight sufficiency. sDA300/50% is reported as the percent of analysis points across the analysis area that meet or exceed 300 lux for at least 50% of the analysis period (e.g. from 8AM to 6PM, 10 hours per day). This metric and performance criteria was conducted between the N37 ◦ and N48 ◦ latitudes in North America. IES recommends two criteria to qualify the acceptability of performance: • Preferred Daylight Sufficiency: sDA300/50% must meet or exceed 75% of the analysis area • Nominally Accepted Daylight Sufficiency: sDA300/50% must meet or exceed 55% of the analysis area. ASE is a metric that describes the potential for visual discomfort in interior work environments (IES, 2013). It is defined as the percent of an analysis area that exceeds a specified direct sunlight illuminance level more than a specified number of hours per year. ASE1000/250h is recommended for analysis of the potential visual discomfort. ASE1000/250h is reported as the percent of analysis points across the analysis area that meet or exceed. 10.
(27) 1000 lux for 250 hours per year of the analysis period. IES recommends three criteria to qualify the acceptability of visual comfort by ASE: • Unsatisfactory: ASE is more than 10%. • Nominally acceptable: ASE is less than 7%. • Acceptable: ASE is less than 3%. Values recommended for sDA and ASE are not necessarily correct when applied to larger areas, such as an entire building floor or total building area. The supporting research did not include enough variety of sun penetration patterns by various orientations, space types, shading device types or climates zones to fully understand how occupants’ preferences vary by these factors. More information is needed from field studies to better understand the range of tolerance for sunlight penetration into workspaces, as well as which mitigation efforts are likely to be more successful, or unsuccessful to improve occupant comfort (IES, 2013).. 1.1.2.2. Metrics for glare Glare indices have been used to evaluate visual comfort in the luminous environment. There is a multitude of glare indices, but there only two glare indices intended for use in daylit environments. The first, the daylight glare index (DGI) was developed by Hopkinson (1972) and Hopkinson and Collins (1963) using large-area electric light glare sources and updated by Chauvel, Collins, Dogniaux, and Longmore (1982) in a setting with daylight but without sunlight or reflected sunlight. The second, daylight glare probability (DGP), was developed by Wienold and Christoffersen (2006) as an attempt to overcome the limitation of the DGI. The DGP tries to define “the probability that a person is disturbed instead of the glare magnitude” (Van Den Wymelenberg & Inanici, 2014). They found that the DGP outperformed the DGI, but this must be qualified in several ways. The basic equation for the DGP includes vertical illuminance at the eye (Ev ) as a primary input in addition to the common glare equation variables (Van Den Wymelenberg. 11.
(28) & Inanici, 2014). A simplified DGP (DGPs) was developed by Wienold (2007) and validated by Wienold (2009). DGPs based on the Ev only, and can be applied only if no direct sun or specular reflection of it hits the eye of the observer. Van Den Wymelenberg and Inanici (2014) performed an experiment where they evaluated different visual comfort metrics based on illuminance and luminance levels with 93 participant-days in two days, one day in summer and one day in fall. It was found that DGP, does not appear to be sensitive or robust enough for being used as stand-alone design criteria for daylighting visual comfort and in some cases might underpredict glare sensation. Mardaljevic, Andersen, Roy, and Christoffersen (2012) demonstrated that there is the potential to compute measures of daylight glare probability using indirect means, such as using the DGPs and luminance renderings on a per time-step basis. Also, the relation between DGPs for the 95th percentile and two UDI metrics seems sufficiently robust to warrant further development of this approach. According to Bellia et al. (2014), daylight should be studied using more reliable indices such as DA and UDI, while also evaluating glare risk. According to Konstantzos et al. (2015) for cases without the sun in the field of view, DGP and workplane illuminance are not well correlated, except for very low openness factors or perfectly diffuse materials. For cases without the sun in the field of view, DGP and vertical illuminance are well correlated, even when sunlight falls on interior surfaces (when shades are partially opened). This allows DGPs to be used for all instances except when sunlight directly hits the occupant.. 1.1.3. Energy and lighting simulation software This section introduces the energy, lighting and integrated simulation software. Energy simulation software are very often used for estimating the energy performance of a building. Lighting simulation software are used for estimating the luminance or illuminance levels on a scene. And, as CFS are related to the thermal and lighting domains of a building, the integrated software are needed for understand how affecting the CFS on visual comfort and energy consumption of a space. 12.
(29) 1.1.3.1. Lighting simulation software Radiance (Ward, 1994), daylighting simulation software, was created by Lawrence Berkeley National Laboratory. It is probably the best, most complete and flexible software for lighting simulations (Ochoa, Aries, & Hensen, 2012). Most of the researchers, including architects and engineers, use Radiance both to estimate accurate illumination levels and to design spaces via artificial and natural lighting technologies. In order to make simulations, the software presents interfaces for modelling space geometry, luminaire data and material characteristics (Kirimtat et al., 2016) and allows implementation of daylight coefficient (Tregenza & Waters, 1983) or three and five phases methods (Saxena, Ward, Perry, Heschong, & Higa, 2010; McNeil, 2013; Konstantoglou, Jonsson, & Lee, 2009; McNeil & Lee, 2013; Bourgeois, Reinhart, & Ward, 2008). DAYSIM (C. F. Reinhart, 2013) is a Radiance-based daylighting analysis software that models the annual amount of daylight in and around buildings. DAYSIM allows users to model dynamic façades systems ranging from standard venetian blinds to state-of-the-art light redirecting elements, switchable glazings and their combinations. Users may further specify complex electric lighting systems and controls including manual light switches, occupancy sensors and photocell controlled dimmed luminaires. Simulation outputs range from climate-based daylighting metrics such as daylight autonomy and useful daylight illuminance to annual glare and electric lighting energy use. DAYSIM also generates hourly schedules for occupancy, electric lighting loads and shading device status which can be directly coupled with thermal simulation engines such as EnergyPlus, eQuest and TRNSYS (C. F. Reinhart, 2013).. 1.1.3.2. Energy simulation software EnergyPlus is a building energy simulation software, development by the U.S. Department of Energy (DOE) Building Technologies Office (BTO) and managed by National Renewable Energy Laboratory (NREL) (EnergyPlus, n.d.). IEnergyPlus will calculate the heating and cooling loads necessary to maintain thermal control setpoints, conditions 13.
(30) throughout an secondary HVAC system and coil loads, and the energy consumption of primary plant equipment as well as many other simulation details that are necessary to verify that the simulation is performing as the actual building would. This software has some key capabilities for instance; infinite solutions can built into instantly, it can manipulate daylight, create thermal comfort models, heat and mass transfer can be integrated, and different window layouts can be computed (Kirimtat et al., 2016). TRNSYS is a flexible graphically based software used to simulate the behaviour of transient systems. While the vast majority of simulations are focused on assessing the performance of thermal and electrical energy systems, TRNSYS can equally well be used to model other dynamic systems such as traffic flow, or biological processes (TRNSYS, n.d.).. 1.1.3.3. Integrated lighting and energy simulation software OpenStudio (Guglielmetti, Macumber, & Long, 2011) couples Radiance with EnergyPlus. This program is currently in development, but allows use of daylight coefficients and three phases method. Also, allows determine glare due to daylight through simplified method (Wienold, 2009), it do not consider individual sources of glare, generating considerable errors in assessing direct views of the windows. Other limit is in the usage of BSDF data that are only contained in the OpenStudio’s database. In addition, dynamic shading control is not supported (De Michele et al., 2015). Fener (Bueno et al., 2015) ia a tool developed at the Fraunhofer institute, that performs energy and daylight simulations for advanced analysis of CFS in a single space. Model uses the three phases method and the BSDF data to evaluate indoor illuminance measured by virtual sensors arranged on a sensors grid and solar irradiance absorbed by indoor surfaces. The solar gains are used to evaluate the heat balance of the building. Fener can not perform multi-zone energy simulations.. 14.
(31) mkSchedule (Vera et al., 2016; Molina, 2014) is a tool that provides integrated simulations for CFS using three phases method integrating Radiance and EnergyPlus. Control algorithms is kept out of the main program and it can be defined through a Lua script. The control is flexible and can be based on weather file information or on the output of daylighting simulations.. 1.1.4. Optimization methods in building simulation Herein ”Building optimization” refers to a method that uses algorithms to find the optimal combination of simulation parameters for architectural design. The goal of the optimization process is to find the optimum for the lowest total energy cost and meets the criteria of visual comfort using a much shorter simulation time that the approach of comparing each possible combination of parameters. Discrete parameters are typically used for façade design problems because continuous parameters are almost non-existent in façade design. Examples of discrete parameters are window dimension, construction material, insulation thickness, glazing types (SHGC, U-value), etc. Continuous parameters methods do not use fixed numbers for the parameter setting for building shape or dimensions such as window-to-wall ratio, building orientation, or compactness. Optimization methods using discrete parameters are more suitable to solve building façade design problems (Shan, 2014). The major obstacles in solving building optimization problems by simulation based methods involve the complex natures of building simulation outputs, the expensive computational cost, the scale of the problems, multi-objective design problems, and uncertainty of many factors during the optimization, including design variables, environmental variables, model and constraint uncertainty among others (Nguyen, Reiter, & Rigo, 2014). Successful optimization requires a nuanced understanding of the relationships between model parametrization, optimization algorithm, and performance metrics (McNeil & Lee, 2012). EnergyPlus and TRNSYS are the mostly-used building simulation programs in optimization studies, and the mostly used optimization engines seems to be GenOpt and 15.
(32) Matlab optimization toolboxes (Nguyen et al., 2014). There are several optimization algorithms such as: genetic algorithms (GA), particle swarm optimization (PSO), HookeJeeves algorithms (HJ), simplex algorithms, coordinate search algorithms, hybrid algorithms, among others. The stochastic population-based algorithms (GAs, PSO, hybrid algorithms, evolutionary algorithms) have been the most frequently used methods in building performance optimization (Nguyen et al., 2014). Wetter and Wright (2003) compared the performance of a HJ algorithm and a GA in optimizing building energy consumption. Their results indicated that the GA outperformed the HJ algorithm and the latter have been attracted in a local minimum. Wetter and Wright (2004) found that the GA consistently got close to the best minimum and the Hybrid algorithm PSO-HJ achieved the overall best cost reductions. Kämpf, Wetter, and Robinson (2010) compared the performance of two metaheuristics algorithms, Covariance Matrix Adaptation Evolution Strategy Algorithm (CMA-ES/HDE) and PSO-HJ algorithm. They found that CMA-ES/HDE performed better than the PSO-HJ in solving the benchmark functions with 10 dimensions or less. However, if the number of dimensions is larger than 10, the PSO-HJ performed better. Nowadays, there are many architects, engineers and scientist working on optimization of buildings components (Blanco et al., 2016). Tsangrassoulis, Bourdakis, Geros, and Santamouris (2006) used a GA to design a slat-type shading system with one design parameter (angle of each slat segment). They demonstrated how GAs can be applied to the design of a shading system. McNeil and Lee (2012) developed an optimization process using GenOpt combined with Radiance simulation capabilities to search for optimal shapes of microprisms for a specific CFS model. The optimization process considered glare and lighting energy in the objective function to maximize lighting energy savings and minimize glare, tolerate 0.5% increase in glare frequency for a 1% decrease in fractional lighting energy use. Particle swarm algorithms was used. Has developed a film geometry with superior performance to what is commercially available. Rapone and Saro (2012) studied a typical curtain wall façade of an office building in order to find the configuration of selected parameters (percentage of glazed surface, depth of the louvers and spacing of the louvers) that minimizes the total carbon emissions arising from building 16.
(33) operation in four climates and the four cardinal orientations. They do not consider visual comfort evaluation. Simulation were based on PSO algorithm (using GenOpt) coupled to a dynamic energy simulation engine (EnergyPlus). Shan (2014) propose a methodology to find the optimal solutions for the total energy demand using a GA. The variables to optimize are the dimension of window grid and the depth of shading system. He used TRNSYS for energy simulations and DAYSIM for calculating loads due to artificial lights and turn off lights if exceed 500 lux, but he do not considered visual comfort metrics to evaluate daylight performance of the shading system. Manzan (2014) used a genetic optimization to design an optimal fixed shading device. The shading device is a flat panel positioned parallel to the window and inclined by its horizontal axis. He carried out this study using ESP-r for energy simulation and DAYSIM for calculating loads due to artificial lights, and ModeFRONTER with NSGA-II algorithm for optimization. The optimization is performed modifying four parameters (shading device height, width, angle and distance from the wall) and the objective function is in terms of total energy consumption. The optimized result was compared with unshaded window and results show energy savings up to 19% and 30% for Trieste and Rome (Italy), respectively. González and Fiorito (2015) developed a simplified method to overcome daylight and energy performance using DIVA, a plug-in for Rhinoceros/Grasshopper software, and Galapagos through GAs. The optimization process was carried out parametrically controlling the shadings’ geometries (shading depth, angle on horizontal plane and shading number) and they have two objective functions in terms of total energy consumption and CO2 emissions. The optimized result was compared with conventional design techniques showing energy savings between 9.3% and 35.8% and CO2 emissions reductions between 11.4% and 47.7%. He evaluate the daylight performance for the optimized solution, but they does not considerer the visual comfort evaluation inside the optimization process. Futrell, Ozelkan, and Brentrup (2015) used a hybrid GPS Hooke Jeeves/PSO algorithm in combination with the Epsilon Constraint Method to find Pareto efficient solutions to the daylighting and thermal optimization problem of a classroom design with only one exterior shade (without CFS). They used two objective functions, one for lighting and the other for energy consumption. 17.
(34) They conclude that these two objectives are not strongly conflicting. Blanco et al. (2016) studied double skin enclosure built with metal perforated sheet panels. This device controls the light and SHG changing opening areas or perforations depending on location and orientation of façade. They applied a simple optimization methodology to determinate the perforations ratio for different climatic areas in Spain, but does not considered daylight performance. The most of the studies about optimization of CFS’s geometry considerer only the energy consumption in the objective function. In two cases the objective function has the both metrics (energy consumption and visual comfort), (McNeil & Lee, 2012) and (Futrell2015). The first only considerer the lighting consumption and the second methodology are appropriate but do not have CFS. It is needed a methodology that integrate energy consumption (heating, cooling and lighting) and visual comfort to optimize the geometry of CFS in the early design stage of the office buildings to save computational time, and maximize the daylight availability and energy efficiency.. 1.2. Research opportunities CFS have a fundamental role in the energy performance and control of SHG in office buildings and provide occupant’s visual comfort. Designers, engineers and architects has developed many kinds of CFS such as louvers (fixed and movable), venetian blinds, perforated screens, among other, and if are not well designed can produce visual discomfort. The interaction between building and occupants have an important effect in energy consumption, for this, it is necessary modelling and optimization in the design stage of building (Nielsen et al., 2011; Kirimtat et al., 2016). It is necessary provide information to them to design correctly these devices, choosing the right CFS for the weather conditions and the building characteristics (window-to-wall ratio, façade orientation, etc.). According to literature reviewed, the studies are focused on the following topics/opportunities: 18.
(35) (1) Evaluate the behaviour of CFS in terms of thermal performance, control of SHG, energy consumption and visual comfort. (2) Evaluate different control strategies of movable CFS in terms of energy consumption and visual comfort. (3) Optimize the geometry of fixed and movable CFS in terms of energy consumption and visual comfort. (4) Design and optimization of complete building façades. (5) Determine the right visual comfort metrics. It is needed integrating all topics in a only methodology that allows to give all the information necessary for designers. mkSchedule have the potential in their methodology that use a time-efficient simulations to incorporate the first four topics. In this thesis, opportunities (1) and (2) are worked, while work about opportunity (3) considerer only fixed CFS.. 1.3. Objectives The general objective of this research is to advance in the design and optimization of complex fenestration systems through a tool that integrate lighting and thermal/energy simulations and an optimization software, considering variables that influence the energy performance of the offices buildings. Specific objectives are the following: (1) Evaluate the performance of undulated and perforated exterior louvers in terms of SHG, energy consumption and visual comfort in a given climate. (2) Demonstrate how the performance of movable CFS can be defined during the building design to property evaluate CFS of early design stage of office space. (3) Evaluate four CFSs control strategies in an office space for different climates and façade orientations. 19.
(36) (4) Optimize the geometry of a fixed undulated and perforated exterior CFS in terms of energy consumption and visual comfort.. 1.4. Hypothesis The hypothesis for this research are the following: (1) Using Groundhog R , mkSchedule Radiance and EnergyPlus allow to determinate the behavior of fixed and movable CFS in terms of SHG, energy consumption and visual comfort in several climates. (2) mkSchedule and GenOpt allow to optimize CFS to reduce building energy consumption and proper visual comfort.. 1.5. Methodology This study is based on modelling and performing simulation with the following software: Groundhog R , mkSchedule, Radiance, EnergyPlus and GenOpt.. 1.6. Thesis structure Besides this introduction, the thesis is composed of other four chapters, each one of them being an auto-contained potential journal article with their own abstract, introduction, methodology, results and conclusions. Those chapters correspond to: (1) Influence of four outdoor complex fenestration systems made of aluminum-zinc on solar heat gains, energy consumption and visual comfort of an office building space: evaluate the influence of four outdoor CFS in terms of their capability to control SHG and reduce the total energy consumption in a office space located in Santiago of Chile. Part of this paper was presented in the 49th ASA Conference and obtained the Best Presentation Award.. 20.
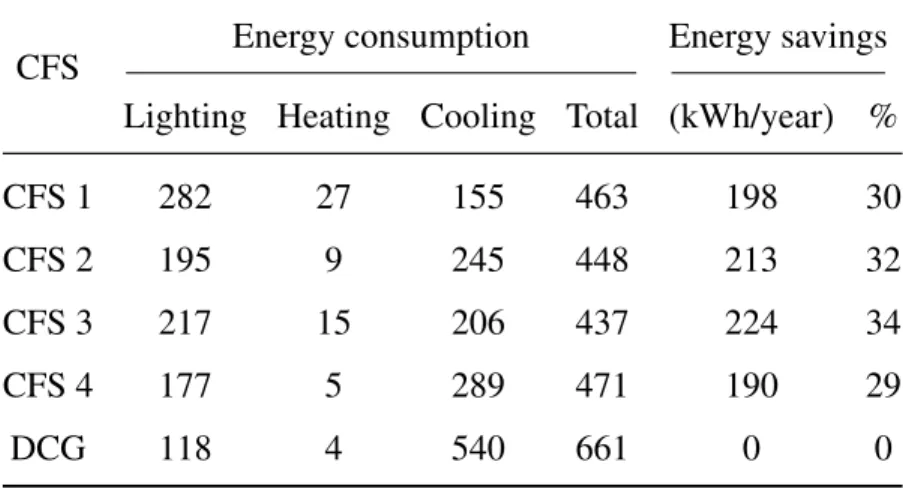
(37) (2) Integrated thermal and lighting performance simulations for minimizing energy consumption of office buildings with complex fenestration systems: a case study that explains how mkSchedule allows integrating thermal and lighting performance simulations to determine the best control strategy based on incident irradiance for minimizing energy consumption of an office space with two movable complex fenestration systems, undulated and perforated horizontal louvers and venetian blinds. (3) Impact of different control strategies of dynamic complex fenestration systems and luminaires in visual comfort and energy consumption of office buildings: a study of the impact of four different control strategies of complex fenestration systems based on incident irradiance, vertical eye illuminance, cut-off angle and blocking light control, on visual comfort and energy consumption. (4) Optimization of a fixed outdoor complex fenestration system for achieving visual comfort and energy performance criteria: an optimization methodology for a fixed fenestration system (undulated and perforated horizontal louvers). Using mkSchedule and GenOpt to determine the optimum parameters (slope angle, percentage of perforations and slats’ spacing) in term of energy consumption and visual comfort. Chapters 2, 3 and 4 search to prove hypothesis 1 and accomplish specific objectives 1, 2 and 3, chapter 5 proving hypothesis 2 and accomplish specific objective 4.. 1.7. Results This section present a synthesis of the main results of this research work. In chapter 2, four CFS made of aluminum-zinc alloy was evaluated in terms of control of SHG and reduce total energy consumption. All CFS are very effective building skins to achieve these objectives. However, visual comfort is only achieved by CFS 3 which has 20% perforations and 120 mm spacing between louvers. CFS 3 allows having a sDA300/50% and ASE4000/400h of 100% and 11% as well as providing proper outdoor visibility. This evidences importance of evaluating all performance aspects of CFS to establish 21.
(38) the ones that can achieve the expected performance. In terms of total energy consumption, energy savings of all cases with CFS are between 29% and 34% in comparison with the window without CFS. CFS 3 causes the lowest energy consumption. Coincidently, this CFS is the only one that also meet visual comfort criteria. In chapter 3, in order to define the best control strategy based on incident irradiance on the window, for each kind of CFS was obtained the optimum maximum irradiance level. For the venetian blinds, the optimum maximum irradiance for the control strategy are 450 W/m2 , 530 W/m2 , 570 W/m2 and 610 W/m2 for Santiago, Miami, Boulder and Montreal respectively, and for the louvers, the optimum maximum are 320 W/m2 , 290 W/m2 , 320 W/m2 and 350 W/m2 for Santiago, Miami, Boulder and Montreal respectively. Furthermore, a correct study of control strategy can be an important variable in the design stage to reduce energy consumption. In chapter 4, four control strategies for a CFS was evaluated, each one based on incident irradiance level, vertical eye illuminance, cut-off angle and blockling control. In terms of energy consumption and visual comfort, the most effective control strategy is S1 (incident irradiance level) for all cases with south/north façade orientation, and for west façade orientation in all cases the best strategy is S4 (blocking control), except in Miami, where S1 is the best strategy. Energy savings are around 10%. In chapter 5, the optimized solution was found to be a slope of 25 ◦ , 15% of perforation and 100 mm spacing for Montreal and a slope of 50 ◦ , 15% of perforation and 120 mm spacing for Santiago of Chile. Double clear glazing in both cities have high values for sDA300/50% and ASE2000/400h , that is discomfort for occupants, and the optimized solution meets the both criteria of visual comfort for the two cities, maximizing daylighting and preventing visual discomfort. This results was validated by a parametric analysis where the difference in respect of exact solution in terms of energy consumption is between 0.94 and 1.62%.. 22.
(39) In summary, the results shows that using Groundhog R , Radiance and EnergyPlus, it is possible determinate the behavior of fixed and movable CFS in terms of SHG, energy consumption and visual comfort of occupants, given a certain climate; and, using mkSchedule and GenOpt, it is possible optimize a fixed CFS to reduce building energy consumption and proper visual comfort.. 1.8. Conclusions In chapter 2 conclude that, all evaluated CFS cause a large reduction of SHG in comparison with an unshaded double clear glazing, whereas significant differences were found among the SHG of CFS due to different percentage of perforations and spacing. Increasing the louver spacing causes higher solar heat transmission through the fenestration system than that for perforations. However, it is rather than notorious that a low percentage of perforations (20%) also increases the SHG significantly in comparison with the CFS without perforations. In chapters 3 and 4 conclude that external movable CFS may significantly control daylighting. Results show that when a CFS is are not properly designed visual discomfort may occur, furthermore, a correct study of performance of movable CFS can be an important variable in the design stage to reduce energy consumption. Also, it has been observed that mkSchedule is an effective tool to be used in early design stages of architectural design to design and/or determinate the best control strategy of CFS based on visual comfort parameters and energy performance of a building. In chapter 5, the methodology of combination of parametric design of CFS with hybrid meta-heuristic algorithm and pattern search algorithm to determine the best set of CFS’s parameters, allow to determine optimized solutions to buildings performance in terms of energy consumption and visual comfort. Optimized solutions maximize the daylight availability and energy efficiency, validated through a parametric analysis.. 23.
(40) In summary, it conclude that outdoor CFS may significantly control daylighting and SHG, and mkSchedule is an effective tool to be used in early design stages of architectural design. The methodology can be using to design a fixed CFS, or to design and/or determine the best control strategy of a movable CFS.. 1.9. Future work This work can be divide in two parts: lighting/energy analysis of CFS control strategies and optimization processes. About the lighting/energy analysis through mkSchedule, the future work should advance in the following line: it is needed a empirically validation of the methodology using a laboratory measurements. Agreeing with Konstantoglou and Tsangrassoulis (2016), it should be studied the performance of more strategies and combinations of these, it is needed to improve the visual comfort metrics, add metric as glare indices and UDI, and additionally it should be studied the behaviour with several zones/rooms to design a complete façade. About the optimization process, future work can expand set of optimization criteria, combining energy-related indicator with other visual comfort metrics, such glare discomfort problems, include movable external shading devices, and calculate parametrically the BSDF during optimization progress without the need to use WINDOW software to generate a BSDF’s database. Finally, it is needed apply sensitivity analysis to determine the effect of each variable on the optimization problem.. 24.
(41) 2. INFLUENCE OF OUTDOOR COMPLEX FENESTRATION SYSTEMS MADE OF ALUMINUM-ZINC ON SOLAR HEAT GAINS, ENERGY CONSUMPTION AND VISUAL COMFORT OF AN OFFICE BUILDING SPACE. 2.1. Abstract Semiarid regions, such as Central Chile, are characterized by high solar radiation and temperature. In this climate, current architecture of fully glazed façade office buildings might cause high cooling energy consumption due to high solar heat gains (SHG), even in winter periods. In Chile’s Central region, the implementation of outdoor complex fenestration systems (CFS) is a common practice. However, the impact of CFS on the building thermal performance is usually unknown. The main objective of this paper is to evaluate the impact of four outdoor CFS of aluminum-zinc in terms of their capability to control SHG through a window oriented northwest, energy consumption and occupant’s visual comfort of an office space located in Santiago of Chile. An integrated thermal-lighting analysis tool is used to evaluate the performance of these CFS. The CFS evaluated are undulated horizontal louvers spaced 120 or 240 mm with 0 or 20% of perforations. The main results show that the CFS evaluated significantly reduce SHG over the whole-year compared with SHG through an unshaded clear double glazing window; perforations and spacing of louvers increase SHG substantially in comparison with the CFS without transparency, but they allow outdoor visibility; and the CFS 3, with slats spaced 120 mm and 20% perforations, provides a good balance between the control of SHG and outdoor visibility, and also, have the lowest energy consumption and it is the only CFS that meets the visual comfort criteria.. 2.2. Introduction The building sector accounts for 40% of the total energy consumption and one-third of the green gas house emissions (UNEP, 2009). In Chile, a developing country, the building sector consumes 28.8% of the total energy consumption (MinEnergı́a, 2013). Chile’s 25.
(42) Central region, where Santiago is located (S33 ◦ 22’; W70 ◦ 46’), is a cooling dominated climate, thus office buildings usually presents high cooling energy consumption due to high internal and solar heat gains (SHG) even in winter-time. The SHG are significant due to the climate characteristics of Santiago of Chile and the current architecture tendency of fully glazed buildings’ façades. Santiago’s climate is characterized by maximum temperatures ranging from 20 to 35 ◦ C between October and April, while the maximum global horizontal solar radiation is between 500 and 1000 W/m2 (ASHRAE, 2013). This climatic condition exposes office building to large heat gains due to solar radiation and heat conduction. Different architectural design strategies could be implemented to achieve proper building performance in terms of energy consumption and occupant’s visual comfort. Some of this strategies are reducing window-to-wall ratio (WWR), using windows with very low solar heat gain coefficient (SHGC), implementing high efficient lighting with very low heat gains, among others. However, most of the buildings are designed and constructed with fully glazed façades as the Titanium Tower, the second tallest building in Chile, shown in Figure 2.1, which follows a worldwide architectural tendency. In Santiago’s climate, these types of buildings are affected by excessive SHG, which turns in high cooling energy consumption and visual discomfort. For instance, it is observed in Figure 2.1 that internal rollers of the north oriented façade are down in the Titanium Tower. This fact should be the user’s response to high SHG or excessive daylighting. The glazing installed on this building has a low SHGC, thus the fact of observing rollers down evidences that the control of SHG in this climate can not be fulfilled by the glazing system only. Solar heat gains through windows highly impact on the building energy performance and occupant’s comfort. Several authors have reported the large contribution of SHG through fenestration to cooling loads in warm climates (Reilly & Hawthorne, 1998; Li & Lam, 2000; Winkelmann, 2001; Kuhn, 2006). Exterior shading devices are effective architectural building skins to reduce SHG through glazed façades because they intercept solar radiation before it reaches the glass. Fully shaded glazing façades can reduce SHG 26.
(43) Figure 2.1. Titanium Tower, a 60-story building located in Santiago of Chile. up to 80% according to ASHRAE (2013), while Bustamante et al. (2014) have reported reduction of short wave solar transmissions above 90% due to outdoor shading devices such as rollers and curved and perforated metallic screens. In Santiago of Chile, it is a common architectural practice to incorporate exterior shading devices to control SHG. There is a large variety of exterior shading devices such as louvers (fixed and movable), venetian blinds, and perforated screens. However, most of these devices correspond to a non-specularly transmitting layer, thus they can be defined as complex fenestration systems or CFS (Laouadi & Parekh, 2007). This means that unlike perfect specular materials, such as many glasses, which transmit the solar ray with the same angle of incidence (see Figure 2.2a), CFS transmit the solar rays in different directions as shown in Figure 2.2b. Most commonly studied exterior CFS corresponds to venetian blinds alone (Kirimtat et al., 2016; E. Shen et al., 2014; Correia da Silva et al., 2013; Chan & Tzempelikos, 2013; Bueno et al., 2015; Yi, Srinivasan, & Braham, 2015) and combined systems like venetian blinds with roller shades or fabrics (Bueno et al., 2015; H. Shen & Tzempelikos, 27.
(44) (a). (b). Figure 2.2. Comparison of solar ray transmission of: (a) specular material (e.g. glass). (b) a non-secular material (e.g. CFS). Adapted from (McNeil, 2015a). 2012; Tzempelikos & Shen, 2013; Chan & Tzempelikos, 2015). The purpose of these devices is to reduce energy consumption of the buildings in terms of lighting, cooling and heating, and, improve the visual comfort of occupants related to glare control, daylighting maximization and exterior vision. Bellia et al. (2014) shows an overview of building shading systems, and they pointed out the need of studying different CFS on different climatic conditions worldwide. The use of perforated screens as shading devices is a tendency in modern building design (Blanco et al., 2014; Mainini et al., 2014). Appelfeld et al. (2012) studied the daylighting transmission of a micro structural perforated shading screen and compared its performance with rollers and venetian blinds. They concluded that the perforated screen provides similar shading effect as the venetian blinds. Mainini et al. (2014) studied different metal screens like perforated metal sheets, stamped metal sheets and metal mesh grids with 40% openness factor. They obtained angular light and solar transmittance measurement of these devices via experimental work, and then, the data collected were integrated. 28.
(45) to obtain visible and solar transmittance using WINDOW 6.2. Finally, they use this information for evaluating the thermal behavior of an office with curtain wall. Blanco et al. (2014) developed a theoretical model for predicting the thermal behavior of double skin façades with glass and sheet-panels, which was validate through experiments. The evaluated panel was able to filter the direct radiation thus significantly lowering the temperatures of the internal glass surface. These studies on perforated screens have focused on either lighting transmission or thermal behavior of the screen but lack of the influence of these perforated screens on the building energy consumption and occupant’s visual comfort. On the contrary, Stazi et al. (2014) monitored the behavior of aluminum sliding perforated panels and the experimental data was used for calibrating the numerical models for shading devices. Then, they evaluated the impact of these screens on the energy consumption and visual comfort in a located in a Mediterranean climate of Italy. Common shading devices used in Chilean buildings corresponds to curved louvers made of aluminum-zinc alloy which can be unperforated or having different perforation percentages. The problem arises because the thermal and optical properties of these CFS are commonly unknown and most of building energy simulation tools consider them in simplified ways. As consequence, this situation makes difficult to evaluate the impact of CFS on the building performance in terms of energy consumption and occupant’s visual comfort, especially during the early design stages. For this reason, the aim of this paper is to evaluate the influence of two outdoor CFS made of aluminum-zinc alloy in terms of their capability to control SHG through fenestration system and their influence on the building energy consumption and occupant’s visual comfort of an office located in Santiago of Chile, a semiarid climate.. 29.
Figure

+7

Documento similar
