Search for supersymmetry in events with large missing transverse momentum, jets, and at least one tau lepton in 20 fb( 1) of root s=8 TeV proton proton collision data with the ATLAS detector
54
0
0
Texto completo
(2) Contents 1. 2 SUSY scenarios. 2. 3 The ATLAS detector and data sample. 4. 4 Simulated samples. 5. 5 Event reconstruction. 7. 6 Event selection. 8. 7 Background estimation 7.1 W , Z and top quark backgrounds 7.2 Multijet backgrounds. 12 12 16. 8 Systematic uncertainties on the background. 18. 9 Results. 20. 10 Conclusions. 29. The ATLAS collaboration. 37. 1. Introduction. Supersymmetry (SUSY) [1–5] introduces a symmetry between fermions and bosons, resulting in a SUSY partner (sparticle) for each Standard Model (SM) particle, with identical mass and quantum numbers except a difference of half a unit of spin. As none of these sparticles have been observed with the same mass as their SM partners, SUSY must be a broken symmetry if realized in nature. Assuming R-parity conservation [6–10], sparticles are produced in pairs and then decay through cascades involving other sparticles until the lightest SUSY particle (LSP), which is stable, is produced. In many SUSY models tau leptons can provide an important signature for new physics. Naturalness arguments [11, 12] suggest that the lightest third-generation sparticles should have masses of a few hundred GeV to protect the Higgs boson mass from quadratically divergent quantum corrections. Light sleptons could play a role in the co-annihilation of neutralinos in the early universe,. –1–. JHEP09(2014)103. 1 Introduction.
(3) 2. SUSY scenarios. The search presented in this paper is sensitive to a variety of SUSY scenarios, which are outlined below. In particular, good sensitivity is achieved for SUSY strong production processes due to the requirement of several high-momentum jets. GMSB model. Minimal GMSB models can be described by six parameters: the SUSYbreaking mass scale in the low-energy sector (Λ), the messenger mass (Mmess ), the number of SU(5) messenger fields (N5 ), the ratio of the vacuum expectation values of the two Higgs doublets (tan β), the Higgs sector mass parameter (µ) and the scale factor for the gravitino mass (Cgrav ). For the analysis presented here, Λ and tan β are treated as free parameters, and the other parameters are fixed to the values used in ref. [32]: Mmess = 250 TeV, N5 = 3, 1. In addition to squarks and gluinos, charged sleptons and sneutrinos are superpartners of charged leptons and neutrinos. The SUSY partners of the gauge and Higgs bosons are called gauginos and higgsinos, respectively. The charged, electroweak gauginos and higgsinos mix to form charginos (χ± i , i = 1,2), and the neutral ones mix to form neutralinos (χ0j , j = 1,2,3,4). Finally the gravitino is the SUSY partner of the graviton.. –2–. JHEP09(2014)103. and, in particular, models with light tau sleptons (staus) are consistent with dark matter searches [13]. If squarks and gluinos, superpartners of quarks and gluons,1 are in the LHC reach, their production rate may be dominant among SUSY processes. They could then decay in cascades involving tau leptons, high transverse momentum jets and missing transverse momentum from the LSP, which escapes undetected. More details about the various SUSY models considered in this paper are given in section 2. Furthermore, should SUSY or any other theory of physics Beyond the Standard Model (BSM) be discovered, independent studies of all three lepton flavours are necessary to investigate the coupling structure of the new physics, especially with regard to lepton universality. This paper reports on an inclusive search for SUSY particles produced via the strong interaction in events with large missing transverse momentum, jets and at least one hadronically decaying tau lepton. Four distinct topologies are studied: one tau lepton (“1τ ”) or two or more tau leptons (“2τ ”) in the final state, with no additional light leptons (e/µ); or one or more tau leptons with exactly one electron (“τ +e”) or muon (“τ +µ”). These orthogonal channels have been optimized separately, and, where relevant, are statistically combined to increase the analysis sensitivity. The analysis is performed using 20.3 fb−1 of proton-proton √ (pp) collision data at s = 8 TeV recorded with the ATLAS detector at the Large Hadron Collider (LHC) in the 2012 run. The results are interpreted in several different models, which are described in more detail in section 2: a minimal gauge-mediated supersymmetry breaking (GMSB) model [14–19], an mSUGRA/CMSSM [20–25] model, a natural gauge mediation framework (nGM) [26] and a bilinear R-parity-violation (bRPV) [27, 28] model. Previous searches for direct production of the SUSY partners of the tau lepton in the minimal GMSB model have been reported by the LEP Collaborations ALEPH [29], DELPHI [30] and OPAL [31]. The analysis reported in this paper extends the searches presented in ref. [32]. The CMS Collaboration presented the results of a supersymmetry search in events with tau leptons, jets and missing transverse momentum in 4.98 fb−1 of 7 TeV data in ref. [33]..
(4) mSUGRA/CMSSM model. The mSUGRA/CMSSM scenario is defined by five parameters: the universal scalar mass (m0 ), the universal trilinear coupling (A0 ) the universal gaugino mass (m1/2 ), tan β and µ. These are chosen such that across a large area of the (m0 , m1/2 ) plane the mSUGRA/CMSSM lightest Higgs boson mass is compatible with the observed mass of the recently discovered Higgs boson at the LHC [34, 35]. Near the low m0 boundary of this area the difference in mass between the τ̃1 and the lightest SUSY particle, the neutralino, is small and allows the two particles to co-annihilate in the early universe [36]. The dark matter relic density is therefore brought down to values compatible with the Planck and WMAP measurements [37, 38]. The consequence of the small difference in mass for the experimental sensitivity is a bias towards very low momenta of at least one tau lepton and consequently towards fewer detectable tau candidates in the final state. nGM model. A rich phenomenology is obtained in the framework of general gauge mediation (GGM) [39]. Starting from GGM, it is possible to construct a set of natural Gauge Mediated (nGM) models where the phenomenology depends on the nature of the NLSP [26, 40]. Various models assume that the fermion mass hierarchies are generated by the same physics responsible for breaking SUSY (see for example [41] and [42]). Typically in these models the entire third generation of sfermions is lighter than the other two. Coupled with the fact that sleptons only get soft masses through hypercharge interactions in gauge mediation, this leads to a stau NLSP. In the model considered here it is also assumed that the gluino is the only light coloured sparticle. All squark and slepton mass parameters are set to 2.5 TeV except the lightest stau mass, mτ̃ , which is assumed to be smaller to allow a stau NLSP (this has no effect on the fine tuning). The bino and wino masses (M1 and M2 respectively) are also set to 2.5 TeV while all trilinear coupling terms are set to zero. It is further assumed that µ ≪ M1 , M2 . This leaves the gluino mass M3 and the stau mass mτ̃ as the only free parameters, if µ is also fixed. The value of µ is set to 400 GeV to ensure that strong production is the dominant process at the LHC; moreover, this choice of the µ 0 0 parameter drives the mass of the χ̃± 1 , χ̃1 and χ̃2 , which are almost mass degenerate. The only light sparticles in the model are the stau, a light gluino, higgsino-dominated charginos and neutralinos, and a light gravitino, which is the LSP. Several decay modes are possible for the gluino:. –3–. JHEP09(2014)103. µ > 0 and Cgrav = 1. With this choice of parameters, the production of squark and/or gluino pairs is expected to dominate over other SUSY processes at the LHC. These sparticles decay into the next-to-lightest SUSY particle (NLSP), which subsequently decays to the LSP. In gauge-mediated models, the LSP is always a very light gravitino (G̃). The experimental signatures are largely determined by the nature of the NLSP: this can be either the lightest stau (τ̃1 ), a selectron or a smuon (ℓ̃R ), the lightest neutralino (χ̃01 ), or a sneutrino (ν̃), leading to final states usually containing tau leptons, light leptons (ℓ = e, µ), photons, or neutrinos, respectively. In most of the GMSB parameter space considered here the τ̃1 is the NLSP for large values of tan β (tan β > 20), and final states contain between two and four tau leptons. In the region where the mass difference between the τ̃1 and the ℓ̃R is smaller than the sum of the tau and the light lepton masses both the τ̃1 and the ℓ̃R decay directly into the LSP and therefore both define the phenomenology..
(5) 1. g̃ → g χ̃0i → gτ τ̃1 → gτ τ G̃, with i = 1, 2 2. g̃ → q q̄ χ̃0i → q q̄τ τ̃1 → q q̄τ τ G̃, with i = 1, 2 ′ ′ 3. g̃ → qq ′ χ̃± 1 → qq ντ τ̃1 → qq ντ τ G̃. bRPV model. In the bRPV scenario, bilinear R-parity-violating (RPV) terms are assumed to be present in the superpotential, resulting in an unstable LSP. The RPV couplings are included in the mSUGRA/CMSSM model described above and, for a chosen set of mSUGRA/CMSSM parameters, the bilinear RPV parameters are determined under the tree-level dominance scenario [48] by fitting them to neutrino oscillation data as described in ref. [49]. The neutralino LSP decays promptly through decay modes that include neutrinos [50]. The main LSP decay modes considered are: 1. χ̃01 → W (∗) µ (or τ ), 2. χ̃01 → Z (∗) /h(∗) ν. These result in final states with several leptons and jets, but a reduced missing transverse momentum compared with the standard R-parity-conserving mSUGRA/CMSSM model.. 3. The ATLAS detector and data sample. The ATLAS experiment is described in detail in ref. [51]. It is a multi-purpose detector with a forward-backward symmetric cylindrical geometry and nearly 4π solid angle coverage.2 The inner tracking detector (ID), covering |η| < 2.5, consists of a silicon pixel detector, a 2. ATLAS uses a right-handed coordinate system with its origin at the nominal interaction point (IP) in the centre of the detector and the z-axis along the beam pipe. The x-axis points from the IP to the centre of the LHC ring and the y-axis points upward. Cylindrical coordinates (r, φ) are used in the transverse plane, φ being the azimuthal angle around the beam pipe. The pseudorapidity is defined in terms of the polar angle θ as η = − ln tan(θ/2).. –4–. JHEP09(2014)103. where q and q̄ are almost exclusively quarks of heavy flavour (either top or bottom quarks). The first process proceeds through a squark-quark loop, and equal amounts of χ̃01 and χ̃02 production are expected. The second and third processes proceed via an off-shell squark, and the relative proportion of the first process to the other two depends on the precise relationship between M3 and the squark masses. At the lowest values of M3 , the first process dominates entirely. The effect of the last two processes increases with rising gluino mass (with M3 approaching the squark masses). For M3 & 1 TeV, the proportion of decays through the first process is at the level of a few percent, and the other two processes are expected to dominate [26]. The branching ratios are approximately constant as a function of M3 for the signal scenarios considered. In gauge-mediated SUSY scenarios a variety of mechanisms exist [43–47] to generate a Higgs boson mass compatible with the observed value [34, 35], without changing the phenomenology of the models considered in this search. In the model used in this analysis, the lightest Higgs boson mass is specifically set to 125 GeV..
(6) 4. Simulated samples. Samples of Monte Carlo (MC) simulated events are used for evaluating the expected SM backgrounds and for estimating the signal efficiencies for the different SUSY models. Samples of W +jets and Z+jets events with up to four jets from matrix elements (ME) are simulated by the SHERPA [54] generator version 1.4.1, where the CT10 [55] set of parton distribution functions (PDFs) is used. To improve the agreement between data and simulation, W /Z+jets events are reweighted based on the pT of the vector boson using measured Z boson pT distributions in the data [56]. For the purpose of evaluating generator uncertainties, additional W /Z+jets samples are produced with the ALPGEN 2.14 [57] MC generator, which simulates W and Z/γ ∗ production with up to five accompanying partons using the CTEQ6L1 [58] set of PDFs. Z/γ ∗ events with mℓℓ < 40 GeV are referred to in. –5–. JHEP09(2014)103. semiconductor microstrip detector and a transition radiation tracker. The ID is surrounded by a thin superconducting solenoid providing an axial 2 T magnetic field and by a finegranularity lead/liquid-argon (LAr) electromagnetic calorimeter (covering |η| < 3.2). An iron/scintillator-tile calorimeter provides hadronic coverage in the central pseudorapidity range (|η| < 1.7). The endcap and forward regions (1.5 < |η| < 4.9) are instrumented with LAr calorimeters, with either steel, copper or tungsten as the absorber material, for both the electromagnetic and hadronic measurements. An extensive muon spectrometer system that incorporates large superconducting toroidal air-core magnets surrounds the calorimeters. Three layers of precision gas chambers provide tracking coverage in the range |η| < 2.7, while dedicated fast chambers allow triggering in the region |η| < 2.4. The data used in this search are pp collisions recorded by the ATLAS detector at a √ centre-of-mass energy of s = 8 TeV during the period from April 2012 to December 2012. After the application of beam, detector and data-quality requirements, the total integrated luminosity amounts to (20.3 ± 0.6) fb−1 . The luminosity measurement is performed using techniques similar to those in ref. [52], and the calibration of the luminosity scale is derived from beam-separation scans performed in November 2012. In the 1τ and 2τ channels, candidate events are triggered by requiring a jet with high transverse momentum (pT ) miss ) [53]. In and high missing transverse momentum (whose magnitude is denoted by ET the τ +e channel, candidate events are triggered by requiring the presence of an energy cluster in the electromagnetic calorimeter with a shower shape consistent with that of an electron, and with uncorrected transverse energy (ET ) above 24 GeV. The selection is further refined by matching the cluster to an isolated track in the ID [53]. In order to maximize the efficiency for high-pT electrons, data selected using a single-electron trigger with ET > 60 GeV but no isolation requirements are added. In the τ +µ channel, events are selected by requiring a muon candidate identified as a single isolated track reconstructed by the ID and the muon spectrometer, with uncorrected transverse momentum above 24 GeV. In addition, events are also selected using a non-isolated muon trigger, with a muon pT threshold of 36 GeV [53]. The trigger requirements have been optimized to ensure a uniform trigger efficiency for all data-taking periods, which exceeds 98% with respect to the offline selection for all final states considered..
(7) –6–. JHEP09(2014)103. this paper as “Drell-Yan”. In the ALPGEN samples fragmentation and hadronization are performed with HERWIG 6.520 [59], using JIMMY [60] for the underlying event simulation. The SHERPA MC generator is used for simulating the production of diboson events (W W , W Z and ZZ). Alternative samples for evaluating systematic uncertainties are generated by POWHEG r2129 [61–63] interfaced to PYTHIA 8.165 [64]. Top quark pair production is simulated with POWHEG r2129 interfaced to PYTHIA 6.426 [65], using the CT10 PDF set. To improve the agreement between data and simulation, tt̄ events are reweighted based on the pT of the tt̄ system; the weights are ex√ tracted from the ATLAS measurement of the tt̄ differential cross section at s = 7 TeV [66]. Alternative samples to evaluate systematic uncertainties are generated with a setting very similar to the one used for W /Z+jets, using ALPGEN with up to four additional partons in the ME. The production of single-top events in the s- and W t-channels is simulated using MC@NLO 4.06 [67–69] with HERWIG 6.520 showering and the CT10 PDF set, while for the t-channel AcerMC 3.8 [70] with PYTHIA 6.426 showering is used with the CTEQ6L1 PDF set. In all samples a top quark mass of 172.5 GeV is used consistently. The SUSY signal samples used in this analysis are generated with PYTHIA 6.426 for the bRPV model and Herwig++ 2.5.2 [71] for all other models, with the CTEQ6L1 PDF set in all cases. For all signal models the signal cross sections are calculated to next-to-leading order in the strong coupling constant, adding the resummation of soft gluon emission at next-to-leading-logarithmic accuracy (NLO+NLL) [72–76]. The nominal cross section and the uncertainty are taken from an envelope of cross-section predictions using different PDF sets and factorization and renormalization scales, as described in ref. [77]. The decays of tau leptons are simulated directly in the generators in the case of event samples produced with SHERPA, Herwig++ 2.5.2 and PYTHIA 8.165, while in all other cases TAUOLA 2.4 [78, 79] is used. For the underlying event model the ATLAS AUET2B tune [80] is used for all samples except for those generated with Herwig++ 2.5.2 (UEEE tune [81]), with PYTHIA 8.165 (AU2 tune [82]), with SHERPA (which use the built-in SHERPA tune) and the tt̄ sample generated with POWHEG (Perugia 2011C tune [83]). All samples are processed either through the Geant4-based simulation of the ATLAS detector [84, 85] or a fast simulation framework where showers in the calorimeters are simulated with a parameterized description [86] and the rest of the detector is simulated with Geant4. The fast simulation framework is used only for top quark pair production with POWHEG and the low-pT W /Z+jets samples simulated with SHERPA. The fast simulation was validated against full Geant4 simulation on the tt̄ sample, where a fraction of the events were simulated in both frameworks. In all cases, a realistic treatment of the variation of the number of pp interactions in the same and neighbouring bunch crossings (pile-up) is included, with an average of around 20 interactions per bunch crossing. For the initial comparison with data, all SM background cross sections are normalized to the results of higher-order calculations when available. The theoretical cross sections for W and Z production are calculated with DYNNLO [87] with the MSTW 2008 NNLO [88] PDF set. The same ratio of the next-to-next-leading-order (NNLO) to leading-order cross sections is applied to the production of W /Z in association with heavy-flavour jets. The inclusive tt̄ cross section is calculated at NNLO, including resummation of next-to-next-to-.
(8) leading logarithmic (NNLL) soft gluon terms, with Top++2.0 [89, 90] using MSTW 2008 NNLO PDFs. Approximate NLO+NNLL calculations are used for single-top production cross sections [91–93]. For the diboson sample, the cross section is calculated at NLO with MCFM [94], using MSTW 2008 PDFs.. 5. Event reconstruction. –7–. JHEP09(2014)103. Vertices consistent with the interaction region and with at least five associated tracks with pT > 400 MeV are selected; the primary vertex (PV) is then identified by choosing the vertex with the largest summed |pT |2 of the associated tracks [95]. Jets are reconstructed from three dimensional calorimeter energy clusters using the anti-kt jet clustering algorithm [96] with distance parameter R = 0.4. Jet momenta are constructed by performing a four-vector sum over clusters of calorimeter cells, treating each as an (E, p~ ) four-vector with zero mass. The jets are corrected for energy from additional pile-up collisions using the method suggested in ref. [97], which estimates the pile-up activity in any given event as well as the sensitivity of any given jet to pile-up. Clusters are classified as originating from electromagnetic or hadronic showers by using the local cluster weighting calibration method [98]. Based on this classification, specific energy corrections from a combination of MC simulation and data [99] are applied. A further calibration (jet energy scale) is applied to calibrate on average the energies of jets to the scale of their constituent particles [99]. In this analysis jets are selected within an acceptance of |η| < 2.8 and are required to have pT > 20 GeV. Jets containing b-quarks are used in the analysis to define specific regions where the contribution of background events from W /Z+jets or tt̄ processes are estimated. They are identified using a neural-network algorithm [100, 101] and a working point corresponding to 60% (< 0.5%) tagging efficiency for b-jets (light-flavour or gluon jets) is used, where the tagging efficiency was studied on simulated tt̄ events. Reconstruction of hadronically decaying tau leptons starts from jets with pT > 10 GeV [102], and an η- and pT -dependent energy calibration to the tau energy scale for hadronic decays is applied [103]. Discriminating variables based on observables sensitive to the transverse and longitudinal shapes of the energy deposits of tau candidates in the calorimeter are combined with tracking information as inputs to a boosted decision tree (BDT) discriminator. Measurements from the transition radiation tracker and calorimeter information are used to veto electrons misidentified as taus. Suitable tau lepton candidates must have one or three associated tracks (one or three “prongs”), with a charge sum of ±1, and satisfy pT > 20 GeV and |η| < 2.5. A sample of Z → τ τ events is used to measure the efficiency of the BDT tau identification. The “loose” (“medium”) working points in ref. [102] are used herein and correspond to an efficiency of approximately 70% (60%), independent of pT , with a rejection factor of 10 (20) against jets misidentified as tau candidates (referred to as “fake” taus). Muon candidates are identified by matching one or more track segments in the muon spectrometer [104] with an extrapolated inner detector track. They are required to have pT > 10 GeV and |η| < 2.4. Electron candidates must satisfy pT > 20 GeV, |η| < 2.47.
(9) 6. Event selection. For the 1τ channel, events with only one hadronically decaying medium tau lepton candidate with pT > 30 GeV, no additional loose tau candidates, and no candidate muons or electrons are selected; in the 2τ channel, events are selected with two or more loose tau leptons with pT > 20 GeV and no candidate muons or electrons; events in the τ +e and τ +µ channels have one or more loose tau candidates with pT > 20 GeV and one additional signal electron or muon, respectively. All events have to fulfil a common initial set of requirements, in the following referred to as the “preselection”. Events are required to have a reconstructed PV, to have no jets or muons that show signs of problematic reconstruction, to have no jets failing to satisfy quality criteria, and to have no muons that are likely to have originated from cosmic rays. After the preselection, several requirements are applied to define various signal regions (SRs) in each final state. The individual SRs have been optimized for specific signal models and are combined in the final results for the respective signal scenarios. Two SRs (1τ “Loose” and 2τ “Inclusive”) are designed with relaxed selections to maintain sensitivity for other BSM scenarios and to provide model independent limits. The following variables are used to suppress the main background processes (W +jets, Z+jets and top, including tt̄ and single-top events) in each final state:. –8–. JHEP09(2014)103. and satisfy the “Medium++” identification criteria described in ref. [105], re-optimized for 2012 conditions. Muons and electrons satisfying these identification criteria are referred to as “baseline” leptons. miss , are measured The missing transverse momentum vector p~Tmiss and its magnitude, ET from the transverse momenta of identified jets, electrons, muons and all calorimeter clusters miss measurement tau leptons with |η| < 4.5 not associated with such objects [106]. In the ET are not distinguished from jets and it was checked that this does not introduce a bias in any kinematic variables used in the analysis. Following object reconstruction, ambiguities between candidate jets, taus and light leptons are resolved and further criteria are applied to select “signal” objects. Muons are required to have pT > 25 GeV and to be isolated. The scalar sum of the transverse momenta p of tracks within a cone of size ∆R ≡ (∆η)2 + (∆φ)2 = 0.2 around the muon candidate, excluding the muon candidate track itself, is required to be less than 1.8 GeV. Electrons are required to have pT > 25 GeV and pass the “Tight++” selection [105]. The sum of all transverse components of deposits in the calorimeter around the electron candidate in a cone of size ∆R = 0.2 is required to be less than 10% of the electron candidate pT . Finally the electron trajectory is required to deviate not more than 1 mm in the transverse plane and 2 mm in the longitudinal direction from the reconstructed PV. Signal jets are required to have pT > 30 GeV and to be within the acceptance of the inner detector (|η| < 2.5). Soft central jets (pT < 50 GeV, |η| < 2.4) originating from pile-up collisions are removed by requiring a jet vertex fraction (JVF) above 0.5, where the JVF is defined as the ratio of the sum of the transverse momentum of jet-matched tracks that originate from the PV to the sum of transverse momentum of all tracks associated with the jet..
(10) 1τ Loose SR pjet1 T. Trigger selection. > 130 GeV, > 30 GeV miss ET > 150 GeV Nτmedium = 1 pT > 30 GeV. Taus. Nℓbaseline = 0. Light leptons Multijet rejection. 1τ Tight SR pjet2 T. ∆φ(jet1,2 , pmiss ) > 0.4, ∆φ(τ, pmiss ) > 0.2 T T mτT > 140 GeV. Signal selections miss ET. 2τ Inclusive SR. 2τ GMSB SR pjet1 T. Trigger selection. Nτloose ≥ 2 pT > 20 GeV Nℓbaseline = 0. Light leptons. ∆φ(jet1,2 , pmiss ) ≥ 0.3 T. Multijet rejection mτT1 +mτT2 ≥ 150 GeV 2j HT > 1000 GeV. τ +ℓ GMSB SR. mτT1 + mτT2 ≥ 250 GeV 2j HT > 1000 GeV Njet ≥ 4. τ +ℓ nGM SR. 2j HT > 600 GeV Njet ≥ 4. τ +ℓ bRPV SR. Trigger selection. pℓT. Taus. Nτloose ≥ 1 pT > 20 GeV. mτT1 +mτT2 ≥ 150 GeV 2j HT > 1000 GeV Njet ≥ 4. τ +ℓ mSUGRA SR. > 25 GeV. Nℓsignal = 1,. Light leptons. baseline Nother lep = 0. mℓT > 100 GeV. Multijet rejection Signal selections. 2τ bRPV SR. > 130 GeV, > 30 GeV miss ET > 150 GeV. Taus. Signal selections. 2τ nGM SR pjet2 T. meff > 1700 GeV. miss ET > 350 GeV Njet ≥ 3. meff > 1300 GeV Njet ≥ 4. miss ET > 300 GeV Njet ≥ 3. Table 1. Signal region selection criteria for the different channels presented in this paper. miss • mτT , the transverse q mass formed by ET and the pT of the tau lepton in the 1τ miss (1 − cos(∆φ(τ, pmiss ))). In addition the variable mτ1 + mτ2 channel mτT = 2pτT ET T T T is used as a discriminating variable in the 2τ channel; ℓ miss ℓ • m qT , the transverse mass formed by ET and the pT of the light leptons mT = miss (1 − cos(∆φ(ℓ, pmiss ))); 2pℓT ET T. • HT , the scalar sum of the transverse momenta of the tau, light lepton and signal jet P P P (pT > 30 GeV) candidates in the event: HT = all ℓ pℓT + all τ pτT + all jets pjet T ; • HT2j , the scalar sum of the transverse momenta of the tau and light lepton candidates. –9–. JHEP09(2014)103. miss ET > 300 GeV HT > 1000 GeV. > 200 GeV HT > 800 GeV.
(11) and the two jets with the largest transverse momenta in the event: HT2j = P P jeti τ all τ pT + i=1,2 pT ;. P. ℓ all ℓ pT +. miss ; • the magnitude of the missing transverse momentum ET miss ; • the effective mass meff = HT2j + ET. • the number of reconstructed signal jets Njet .. 1τ signal regions The various selection criteria used to define the two SRs in the 1τ channel are summarized in table 1. A requirement on the azimuthal angle between p~Tmiss and either of the two miss arises leading jets (∆φ(jet1,2 , pmiss T )) is used to remove multijet events, where the ET from mismeasured highly energetic jets. To further reduce these events in the SRs, a miss is also applied. The transverse mass mτ is used to remove tighter selection on ET T W +jets events, while a requirement on HT is applied in order to reduce the contribution of all remaining backgrounds. miss and H as a result of The main SR (“tight SR”) applies tight selections on ET T optimizing the sensitivity in the high-Λ region of the GMSB model parameter space, given that lower mass regions were excluded in earlier analyses. A “loose SR”, with looser miss and H , is also defined and used to calculate model-independent requirements on ET T limits. In the GMSB model the strong production cross section, for which the analysis has the largest sensitivity, decreases faster with increasing Λ than the cross sections for weak production. Therefore, the selection efficiency with respect to the total SUSY production decreases for large values of Λ. For high tan β, the product of acceptance and efficiency is of the order of 0.3%, decreasing to 0.1% for low tan β. The tight SR yields the best sensitivity in the high-m1/2 , low-m0 region of the mSUGRA and bRPV models and, when combined with the other channels, extends the overall sensitivity range in these models. In the mSUGRA model the product of acceptance and efficiency for the tight signal selection ranges from the permille level to around 4%, with the higher values being observed in the low m1/2 region. In the bRPV signal region the product of acceptance and efficiency for the tight SR ranges from the permille level to around 1% (tight SR), with the higher values being observed in the low-m0 , high-m1/2 region. The 1τ channel does not contribute to the nGM scenario where by construction each event contains at least two high-pT taus. 2τ signal regions The criteria used to define the four SRs in the 2τ channel are shown in table 1. Multijet events are rejected by a requirement on ∆φ(jet1,2 , pmiss T ), while Z+jets events are efficiently τ1 τ2 removed by a requirement on mT + mT . A selection on HT2j is then applied in order to. – 10 –. JHEP09(2014)103. While optimizing the choice of variables, studies showed that there is a correlation between HT and Njet , given that the sum of the jet pT is used in the defintion of HT . In the 2τ and τ +lepton channels, where a selection on Njet is used to define different SRs, the variable HT2j is used in order to avoid such correlation..
(12) reduce the contribution of all remaining backgrounds. Additional requirements on the number of jets in the event are also used to define SRs that are sensitive in specific signal models.. τ +lepton signal regions Events from multijet production and from decays of W bosons into a light lepton and a neutrino, which constitute the largest source of SM background, are suppressed by requiring mℓT > 100 GeV. Different SRs are then defined by applying further requirements miss , m on ET eff and Njet to yield good sensitivity to each of the considered signal models. In the GMSB model, the SR selection was also optimized for the high-Λ region; a tight requirement on meff is applied to significantly reduce the contribution of all backgrounds. The product of acceptance and efficiency in this SR varies between 0.2% to 0.4% across the (Λ, tan β) plane. The nGM SR was optimized for high gluino masses. Since a high jet multiplicity is expected in this scenario, events with at least three signal jets are semiss . lected. The remaining background contribution is reduced with a requirement on ET The product of acceptance and efficiency of this selection is of the order of 2% for high mg̃ , decreasing to 0.2% for lower values of the gluino mass. Requirements similar to those for the nGM SR are applied to define the mSUGRA SR, which was optimized to be sensitive in a low-m1/2 and high-m0 region of the parameter space. The product of acceptance and efficiency in this case ranges from the permille level to 2% across the parameter space. For the bRPV SR the selection optimization is performed in a high-m0 , medium-m1/2 region of the parameter space. At least four signal jets are required and the remaining background contribution is reduced with a requirement on meff . The product of acceptance and efficiency also in this case ranges from the permille level to 2%. The full list of criteria used to define the different SRs in the τ +e and τ +µ channels is given in table 1.. – 11 –. JHEP09(2014)103. The GMSB SR was optimized to be sensitive to the high-Λ region of the parameter space. For high tan β the product of acceptance and efficiency is of the order of 0.5%, falling to 0.2% for low tan β. The nGM SR was optimized for high gluino masses. Given the topology of the signal events, at least four jets are required and a lower requirement on the value of HT2j with respect to the GMSB SR is applied. In this model the gluino pair production cross section is primarily a function of mg̃ , ranging from 17.2 pb for mg̃ = 400 GeV to 7 fb for mg̃ = 1100 GeV. The product of acceptance and efficiency for this channel in the nGM model is of the order of 4% for high mg̃ , independent of mτ̃ , and it falls to ∼2% for miss . The 2τ low mg̃ due to the analysis requirements on the pT of the leading jet and on ET channel has extremely small acceptance in the mSUGRA model, due to the requirement of a second high-pT tau; for this reason no SR optimized for this scenario is defined. In the bRPV SR the selection was optimized to be sensitive in the low-m0 , high-m1/2 region of the parameter space, where the branching ratio to events with two real taus is highest. The product of acceptance and efficiency of the dedicated SR is of the order of 1% in the most sensitive regions of the parameter space, decreasing to the permille level in other regions..
(13) Background W +jets (true) W +jets (fake) Z+jets (true) Z+jets (fake) Top (true) Top (fake) Multijets Dibosons. 1τ matrix inversion matrix inversion with W +jets with W +jets matrix inversion matrix inversion ABCD method from simulation. 2τ matrix inversion matrix inversion — matrix inversion jet-smearing method from simulation. τ +lepton — matrix inversion — — matrix inversion matrix inversion matrix method from simulation. 7. Background estimation. The background in this analysis arises predominantly from W +jets, Z+jets, top and multijet events, with contributions from “true” taus and “fake” taus (jets misidentified as taus). The contributions of these backgrounds in the various signal regions are estimated from data. Because of the differences of the topologies in the four final states considered, different techniques are employed to estimate the multijet background. Table 2 gives an overview of all the different methods used for the background estimation in all channels, which are described in the following subsections. The small diboson background contributions are estimated using MC simulations, while the contributions from other backgrounds like low mass Drell-Yan, tt̄ +V and H → τ τ were found to be negligible. 7.1. W , Z and top quark backgrounds. The main estimation technique for electroweak and top quark backgrounds is referred to in the following as the “matrix inversion” method. In each signal region, the SM background predicted by MC simulation is scaled by factors obtained from appropriately defined control regions (CRs). This is done to reduce the impact of possible mis-modelling of tau misidentification probabilities and kinematics in the MC simulations. The CRs are chosen such that: • they are as kinematically close as possible to the final signal regions, without overlapping with them, while having low signal contamination; • each CR is enriched with a specific background process; • the tau misidentification probability is, to a good approximation, independent of the kinematic variables used to separate the SR from the CRs. By doing this, the measured ratio of the data to MC event yields in the CR can be used to compute scaling factors to correct the MC background prediction in the SR. The vector defined by the scaling factors for each background (~ ω ) is obtained by inverting the equation ~ data = A ω ~ data is the observed number of data events in each CR, after subtractN ~ , where N ing the expected number of events from other SM processes, and the matrix A is obtained from the MC expectation for the number of events originating from each of the backgrounds. – 12 –. JHEP09(2014)103. Table 2. Overview of the various techniques employed for background estimation..
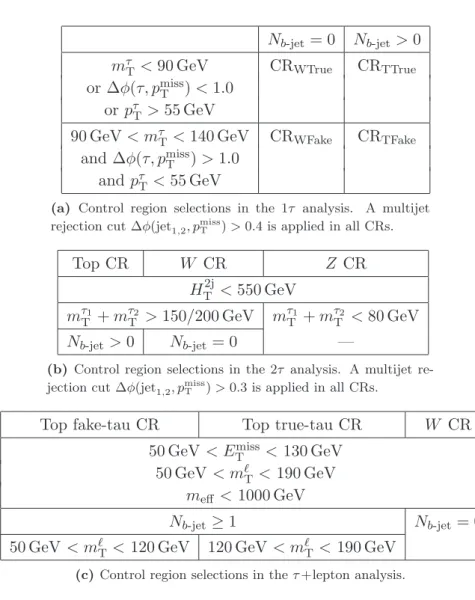
(14) Nb-jet = 0. Nb-jet > 0. < 90 GeV or ∆φ(τ, pmiss T ) < 1.0 or pτT > 55 GeV. CRWTrue. CRTTrue. 90 GeV < mτT < 140 GeV and ∆φ(τ, pmiss T ) > 1.0 and pτT < 55 GeV. CRWFake. CRTFake. mτT. Top CR. W CR HT2j. Z CR. < 550 GeV. mτT1 + mτT2 > 150/200 GeV Nb-jet > 0. mτT1 + mτT2 < 80 GeV. Nb-jet = 0. —. (b) Control region selections in the 2τ analysis. A multijet rejection cut ∆φ(jet1,2 , pmiss ) > 0.3 is applied in all CRs. T. Top fake-tau CR. Top true-tau CR. W CR. miss < 130 GeV 50 GeV < ET 50 GeV < mℓT < 190 GeV. meff < 1000 GeV Nb-jet ≥ 1. 50 GeV < mℓT < 120 GeV. Nb-jet = 0. 120 GeV < mℓT < 190 GeV. (c) Control region selections in the τ +lepton analysis.. Table 3. Overview of the various control regions employed for the background estimation of W , Z and top quark backgrounds. Trigger requirements and selected objects are identical to the signal region requirements in the respective channels.. (W , Z and top). The signal contamination in all CRs has been determined from MC simulation and is well below 5%, except for the nGM SR in the 2τ channel where up to 10% contamination is observed.3 Correlations due to the contribution of each background process in the different CRs are properly taken into account in the matrix A. To obtain the statistical uncertainties on the scaling factors, all contributing parameters are varied within their uncertainties, the procedure is repeated and new scaling factors are obtained. The width of the distribution of the resulting scaling factors is then used as their statistical uncertainty. 1τ channel. The dominant backgrounds to the 1τ SR arise from W +jets, Z+jets and tt̄. Events can be divided into those which contain a true tau and those in which a jet is misidentified as a tau. Since the composition of true and fake taus in the control region and signal region may differ, it is necessary to compute separate scaling factors for events 3. It was checked that this contamination has a negligible effect on the limit obtained in this scenario.. – 13 –. JHEP09(2014)103. (a) Control region selections in the 1τ analysis. A multijet rejection cut ∆φ(jet1,2 , pmiss ) > 0.4 is applied in all CRs. T.
(15) 106. ATLAS s = 8 TeV, 20.3 fb- 1. 105. Data 2012 Multijets. Standard Model W+jets. Z+jets. Top Quarks. Events / 25 GeV. Events. 107. Dibosons. 104 103 102. s = 8 TeV, 20.3 fb-1. 104. Data 2012 Multijets. Standard Model W+jets. Z+jets. Top Quarks. Dibosons. 3. 10. 102 10. 10. 1. 1. 10-1. -1. Data/SM. 10 Data/SM. ATLAS. 105. 1.5 1 0.5 2. 3. 4. 5. 6. 7. 8. ≥9 Njets. (a) Njets distribution in inclusive W /Z and tt̄ region.. 100. 200. 300. 400. 100. 200. 300. 400. 500. 600. 500 600 mτT [GeV]. (b) mτT distribution in the tt̄ validation region.. Figure 1. Kinematic distributions in the 1τ channel for events (a) in an inclusive W /Z and tt̄ validation region and (b) tt̄-enriched validation region. Data are represented by the points. All backgrounds are scaled according to the results of the data-driven background estimates. The shaded band centred around the total background indicates the statistical uncertainty on the background expectation.. with true and fake taus. For this purpose, the CRs are defined by using two variables: the transverse mass, used to separate true and fake taus, and the b-tagging, used to provide a top-enriched (tt̄ CR) or top-depleted (W or Z CR) sample. The contribution in these CRs from other backgrounds (e.g. multijet background) is negligible. The full list of selection requirements for these control regions, after the preselection, tau selection and light-lepton veto requirements are applied, is provided in table 3. The matrix A is a 4 × 4 matrix from which the scale factors for W events with a true tau candidate, W/Z events with a fake tau candidate, and top events with either a true or a fake tau candidate are obtained. In Z+jets events, the background is dominated by Z decays to neutrinos, and therefore the tau candidate is typically a misidentified jet. For this reason, the scaling factor is obtained from the CR defined for W +jets (fake) events. Typical scaling factors obtained for the various MC samples are ∼0.6 for W +jets, Z+jets and ∼1.0 for tt̄ with fake taus, while they are ∼1.1 for W +jets and ∼1.0 for tt̄ with true taus. The comparatively large scale factor for W +jets and Z+jets with fake tau candidates reflects the insufficient description in MC simulation of narrow jets, which in these events are predominantly initiated by colour-connected light quarks, as opposed to the fake tau candidates in ttbar events. The associated statistical uncertainties on these scaling factors are in the range of 5–50%, depending on the CR. Good agreement between data and scaled MC events is observed in the relevant kinematic distributions in the CRs. Figure 1(a) shows the jet multiplicity distribution (an independent variable not used for background separation) on an inclusive data sample made from the four CRs, extending the kinematic range up to (but excluding) the SR. A tt̄-enriched validation region is formed from the inclusive sample by means of b-tagging, and the corresponding mτT distribution is shown in figure 1(b). It shows good agreement in the true-tau-dominated low-mτT range as well as for mτT > 140 GeV (beyond the CR), where events with either a true or a fake tau candidate contribute with similar amounts.. – 14 –. JHEP09(2014)103. 1. 0. 1.5 1 0.5 0.
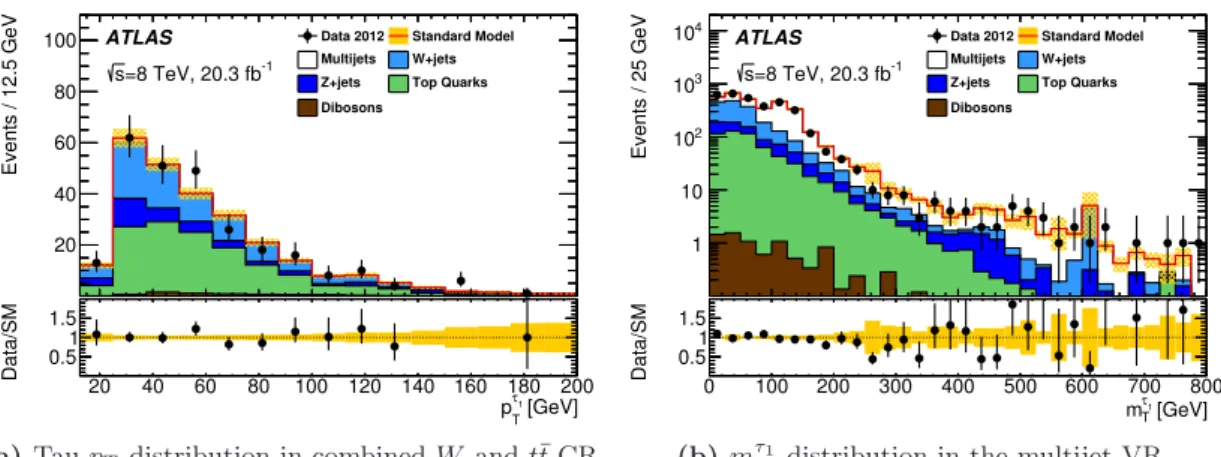
(16) -1. s=8 TeV, 20.3 fb. 80. Data 2012. Standard Model. Multijets. W+jets. Z+jets. Top Quarks. Events / 25 GeV. ATLAS. Dibosons. 60. 104 103. 20. 1 40. 60. 80. 100. 120. 140 160. 20. 40. 60. 80. 100. 120. 140 160. 180. 200. 180 200 τ p 1 [GeV] T. (a) Tau pT distribution in combined W and tt̄ CR.. s=8 TeV, 20.3 fb. Data 2012. Standard Model. Multijets. W+jets. Z+jets. Top Quarks. 0 1.5 1 0.5 0. 100. 200. 300. 400. 500. 600. 700. 800. 100. 200. 300. 400. 500. 600. 700 800 τ mT1 [GeV]. (b) mτT1 distribution in the multijet VR.. Figure 2. Kinematic distributions for events (a) in the 2τ W and tt̄ control region and (b) in the multijet validation region. Data are represented by the points. All backgrounds are scaled according to the results of the data-driven background estimates. The shaded band centred around the total background indicates the statistical uncertainty on the background expectation.. 2τ channel. In the 2τ analysis, the backgrounds from W +jets and tt̄ are dominated by events in which one tau candidate is a true tau and the other is a jet misidentified as a tau. The contributions from Z+jets events are dominated by final states with Z → τ τ decays. The definitions of the 2τ control regions are given in table 3. Three CRs are defined, for W +jets, Z+jets and tt̄ events. All CRs have a negligible contamination from multijet events due to the requirement on ∆φ(jet1,2 , pmiss T ). Given that the ratio of true to fake tau candidates in the CR and SR is the same, as confirmed by generator-level MC studies, there is no need to separate the CRs for fake tau and true tau backgrounds. The matrix A in this case is a 3 × 3 matrix from which the scale factors for W , Z and top events are obtained. The selection criteria mτT1 + mτT2 > 150 GeV (for the Inclusive and bRPV SR) or mτT1 + mτT2 > 200 GeV (for the GMSB and nGM SR) are applied to reproduce the signal region kinematics. Typical scaling factors obtained for various MC samples are ∼0.6 for the W +jets, ∼1.4 for the Z+jets and ∼0.9 for tt̄, with associated statistical uncertainties in the range of 10– 30%. Good agreement between data and scaled MC events in the relevant kinematic distributions is observed in the CRs. An example can be seen in figure 2(a), where the distribution of the transverse momentum of the leading tau candidate in data and scaled MC is compared in an inclusive CR defined by combining the W and tt̄ CRs discussed in this section. τ +lepton channel. In the τ +lepton analysis the ratio of real to fake taus depends on the background process. For W decays, due to the high efficiency and purity of the electron and muon reconstruction, the light lepton is always a real lepton from the W decay, while the tau is faked by a recoiling hadronic object. For tt̄ the light lepton originates from the decay chain of one of the top quarks, while the tau can either be a real tau from the decay of the other top or a fake tau from a jet in the event. Z decays do not contribute a significant amount to the background and are estimated from simulation.. – 15 –. JHEP09(2014)103. 20. -1. 102 10. 1.5 1 0.5. ATLAS. Dibosons. 40. Data/SM. Events / 12.5 GeV. Data/SM. 100.
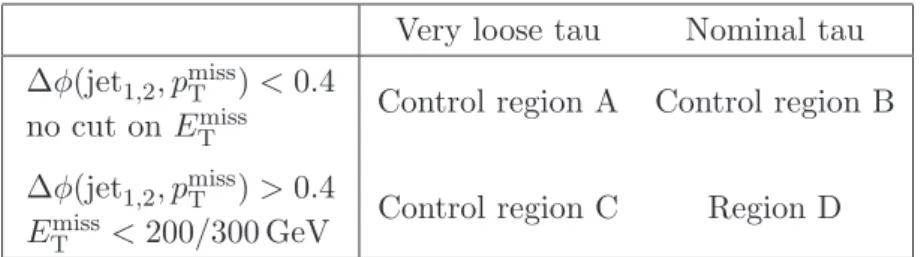
(17) ATLAS -1. s = 8 TeV, 20.3 fb. Data 2012. Standard Model. Multijets. W+jets. Z+jets. Top Quarks. Events / 15 GeV. Events / 15 GeV. 108 107 106 105 104 103 102. Dibosons. 10. -1. s = 8 TeV, 20.3 fb. Data 2012. Standard Model. Multijets. W+jets. Z+jets. Top Quarks. Dibosons. 100 150 200 250 300 350 400 450. 50. 100 150 200 250 300 350 400 450 mlT [GeV]. (a) mℓT distribution (τ +e).. 1 0 1.5 1 0.5 0. 50. 100 150 200 250 300 350 400 450. 50. 100 150 200 250 300 350 400 450 mlT [GeV]. (b) mℓT distribution (τ +µ).. Figure 3. Kinematic distributions in the τ +lepton combined W and tt̄ control regions. Data are represented by the points. All backgrounds are scaled according to the results of the datadriven background estimates and the multijet background is estimated as described in section 7.2. The shaded band centred around the total background indicates the statistical uncertainty on the background expectation.. Three control regions are defined for W , tt̄ with fake taus and tt̄ with true taus. Events with true or fake taus are separated by using a requirement on the mℓT of the event, as summarized in table 3. The matrix A in this case is a 3 × 3 matrix from which the scale factors for W , top with true taus and top with fake taus are obtained. Typical scaling factors obtained are ∼0.7 for the W +jets, ∼0.9 for the tt̄ with a fake tau and ∼0.8 for tt̄ with a true tau. The associated statistical uncertainties are of the order of 20%. An example of the very good agreement in the CRs between data and scaled MC is shown in figure 3, which presents the mℓT distribution for the τ +e and τ +µ channels in a combined W and tt̄ CR defined as the CR selection apart from the cut on the variable plotted. 7.2. Multijet backgrounds. To estimate the multijet background contribution in the signal regions, different methods are employed for each of the three channels. 1τ channel. For the 1τ channel, the contribution arising from multijet background processes due to fake taus is estimated from data using the so-called “ABCD” method. Four exclusive regions, labelled A, B, C and D, are defined in a two-dimensional plane specified by two discriminating variables that are uncorrelated for background events: the tau idenmiss and its angular separation in φ to either of tification tightness and a combination of ET the leading and sub-leading jets (table 4). To increase the number of events in regions A and C, very loose tau candidates are defined by taking the nominal (medium) tau selection and relaxing the criteria on the BDT discriminant. Region D is defined to be similar miss is inverted and there is no to the SR, except for the fact that the requirement on ET requirement on HT . Multijet events in region D may be estimated because the ratio of the numbers of events in regions A and B is equal to the ratio of numbers of events in regions. – 16 –. JHEP09(2014)103. 50. Data/SM. Data/SM. ATLAS. 10. 1 0 1.5 1 0.5 0. 108 107 106 105 104 103 102.
(18) ∆φ(jet1,2 , pmiss T ) miss no cut on ET. < 0.4. ∆φ(jet1,2 , pmiss T ) > 0.4 miss < 200/300 GeV ET. Very loose tau. Nominal tau. Control region A. Control region B. Control region C. Region D. (a) Regions used in the ABCD method for the 1τ analysis. The requirement on HT is not applied in the definition of these control regions.. pjet1 T. Multijet VR pjet2 T. > 130 GeV, > 30 GeV miss ET > 150 GeV Nℓbaseline = 0 ∆φ(jet1,2 , pmiss T ) < 0.3 miss ET /meff < 0.4. Nτloose = 0. Nτloose = 1. (b) Regions used for normalization and validation of the miss multijet pseudo-data in the 2τ analysis. The ET object in the selection is defined by the jet-smearing method.. Table 4. Definitions of control regions used in the estimates of the multijet backgrounds.. C and D. Therefore, the number of events in region D (ND ) is ND = c × NB , where NB is NC is the “correction factor”. In order to estithe number of events in region B and c = N A mate the total yield from multijet events in the final SR, the number of events obtained in miss . region D is scaled by the fraction of events passing the final requirements on HT and ET This fraction is derived in region A, after checking that it has little dependence on the requirements used to define the different multijet regions. In each region, the non-multijet contribution is estimated using MC events scaled according to the procedure detailed in the previous section, and is subtracted from the data. miss from 2τ channel. Background events from multijet production contain both fake ET instrumental effects in the jet energy measurements and fake taus. Since both effects are difficult to simulate reliably and the large cross section would require very large simulation samples, the multijet background expectation for the 2τ final state is computed using a sample from data with the “Jet Smearing” technique [107]. Using this method a sample of miss is obtained, where all other particles, including fake taus, are events with artificial ET taken from data. This sample is then used in the analysis to estimate the background from miss are selected from data requiring that they pass a multijet events. Events with low ET pP 1 miss significance S = E miss / ET < 0.6 GeV 2 , where single-jet trigger and have an ET T P miss , as detailed in ET includes the same reconstructed objects used for computing ET miss is then obtained by applying jet energy section 5. A pseudo-data sample with fake ET resolution smearing to all jets in these events. After subtracting the small contribution (< 7%) from other backgrounds using scaled MC simulations, this sample is normalized in. – 17 –. JHEP09(2014)103. Multijet CR.
(19) a multijet-enriched CR defined by the criteria in table 4, which include the presence of two or more jets with the same pT requirements as the SR. The performance of the method is assessed in a validation region (VR) which has identical kinematic requirements to the normalization region but where one tau is required (table 4). All relevant kinematic properties, including those of the fake taus, are found to be well described by the normalized multijet template, as shown in figure 2(b) for one of the kinematic variables considered in the analysis.. 8. Systematic uncertainties on the background. Various systematic uncertainties were studied and the effect on the number of expected background events in each of the SRs was calculated. Because of the normalization procedure in the CRs, these estimates are not affected by theoretical errors on absolute cross sections, but only by generator dependencies when extrapolating from the CRs to the SRs. The difference in the estimated number of background events from two different generators is used to define the uncertainty due to the choice of MC generator for the tt̄, W +jets, Z+jets and diboson samples (see section 4). Moreover, the uncertainties on initial- and final-state radiation modelling and renormalization and factorization scales, which are found to be relatively small, are fully covered by the difference in generators. For all samples, the statistical uncertainty on the prediction obtained from the alternative MC generator is also included in the estimate of the generator uncertainty. The experimental systematic uncertainties on the SM background estimates arise from the jet energy scale and resolution [99], the tau energy scale [103] and tau identification [102]. The relative difference between the number of expected background events obtained with the nominal MC simulation and that obtained after applying the uncertainty variations on the corresponding objects is taken to be the systematic uncertainty on the background estimate. The uncertainties from the jet and tau energy scales are the largest experimental uncertainties and are treated as uncorrelated, given that they are calibrated by different methods. The systematic uncertainty associated with the simulation of pile-up is taken into account by recomputing the event weights in all MC samples such that the resulting variation in the average interactions per bunch crossing corresponds to the observed uncertainty. The uncertainty on the integrated luminosity is 2.8%, as detailed in ref. [52]. This uncertainty affects only the normalization of the diboson background, which is estimated entirely from simulation. Additional uncertainties due to the methods used to estimate the background from multijet events are also considered. In the 1τ channel, a 100% uncertainty is obtained by. – 18 –. JHEP09(2014)103. τ +lepton channel. In the τ +lepton channels the background contribution due to events with fake leptons is dominated by multijet events. Hence the multijet background contribution can be obtained from data by estimating the number of fake lepton events. For this purpose, the “matrix method” described in ref. [108] is used, which exploits the difference in the isolation of the lepton candidates in events with true and fake leptons. The estimated contribution is found to be negligible..
(20) Source of uncertainty 1τ Loose 1τ Tight 2τ Incl. 2τ GMSB 2τ nGM 2τ bRPV Generator uncertainties 19% 30% 22% 78% 27% 33% Jet energy resolution 2.8% 9.7% 2.1% 4.7% 2.1% 9.4% Jet energy scale 3.6% 4.0% 5.3% 2.4% 4.9% 8.0% Tau energy scale 3.6% 1.3% 2.3% 8.6% 3.0% 2.8% Pile-up re-weighting 1.0% 1.0% 1.4% 1.5% 1.6% 1.3% Multijet estimate 10.5% 9.6% 2.0% 7.5% 0.8% 3.8% Total syst. 24% 35% 24% 79% 30% 36% τ +e. τ +e. τ +e. τ +e. τ +µ. τ +µ. τ +µ. τ +µ. GMSB nGM bRPV mSUG. GMSB nGM bRPV mSUG.. Generator uncertainties Jet energy resolution Jet energy scale Tau energy scale Pile-up re-weighting Total syst.. 51% 4% 7% 7% 3% 60%. 46% 5% 9% 2% 2% 48%. 19% 9% 7% 8% 1% 32%. 28% 3% 12% 1% 0% 30%. 28% 5% 7% 8% 2% 36%. 30% 6% 13% 8% 3% 34%. 39% 8% 10% 4% 1% 41%. 32% 3% 13% 4% 1% 33%. Table 5. Overview of the major systematic uncertainties on the total expected background in each signal region for the background estimates in the channels presented in this paper. The total systematic error also includes some minor systematic uncertainties, not detailed in the text or in the table.. taking into account possible correlations between the variables used in the ABCD method, as well as the uncertainties on the scaling factors of the non-multijet samples that are subtracted from the data. In the 2τ channel, uncertainties of the Jet Smearing method are evaluated by varying the jet response function used within the smearing process. This reflects the uncertainty on the ability to constrain the jet response to data in special multijet control regions when measuring the optimal jet response [107]. In the τ +lepton channels, given that only an upper limit on the estimate of the multijet background is obtained, a conservative 100% uncertainty on the multijet background is assumed. The total systematic uncertainty related to the background estimation and its breakdown into the main contributions are shown in table 5 for each signal region. The total experimental systematic uncertainty on the signal selection efficiency from the various sources discussed in this section varies for each channel and for each signal model considered. In the GMSB scenario this uncertainty is 5–10% for the 1τ channel, rising to 20% for high values of Λ; 20–30% for most of the parameter space in the 2τ channel, increasing to as high as 45% in the region of highest Λ and low tan β; 5–15% for the τ +lepton channel. In the mSUGRA model the signal systematic uncertainty is at the level of 10% across most of the (m0 , m1/2 ) plane for all channels. The total experimental uncertainty on the signal selection efficiency in the nGM scenario is 10–20% for the 2τ channel; in the τ +lepton channels it is of the order of 15–20% for lower masses and decreases to an average level of 5–10% for high mg̃ . In the (m0 , m1/2 ) plane of the bRPV model the total systematic uncertainty on the signal selection efficiency is at the level of 10% across. – 19 –. JHEP09(2014)103. Source of uncertainty.
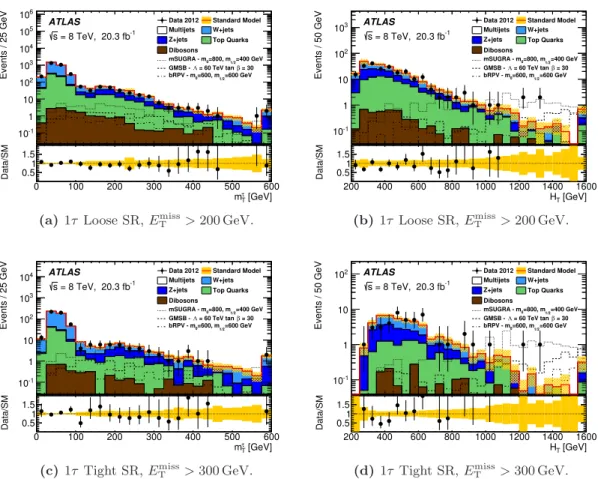
(21) ATLAS. 105. s = 8 TeV, 20.3 fb-1. 104. Data 2012 Multijets. Standard Model W+jets. Z+jets. Top Quarks. Events / 50 GeV. Events / 25 GeV. 106. Dibosons mSUGRA - m0=800, m1/2 =400 GeV GMSB - Λ = 60 TeV tan β = 30 bRPV - m0=600, m1/2 =600 GeV. 103 102 10. ATLAS. 103. s = 8 TeV, 20.3 fb-1. Data 2012 Multijets. Standard Model W+jets. Z+jets. Top Quarks. Dibosons. 102. mSUGRA - m0=800, m1/2 =400 GeV GMSB - Λ = 60 TeV tan β = 30 bRPV - m0=600, m1/2 =600 GeV. 10 1. 1 10-1 0. 200. 300. 400. 100. 200. 300. 400. 500. 600. 500 600 mτT [GeV]. 200. 1.5 1 0.5 200. ATLAS. 104. Data 2012 Multijets. s = 8 TeV, 20.3 fb-1. 103. Z+jets. Standard Model W+jets Top Quarks. Dibosons mSUGRA - m0=800, m1/2 =400 GeV GMSB - Λ = 60 TeV tan β = 30 bRPV - m0=600, m1/2 =600 GeV. 102. 600. 800. 1000. 1200. 1400. 400. 600. 800. 1000. 1200. 1600. 1400 1600 HT [GeV]. miss (b) 1τ Loose SR, ET > 200 GeV.. Events / 50 GeV. Events / 25 GeV. miss (a) 1τ Loose SR, ET > 200 GeV.. 400. 10. ATLAS. 102. s = 8 TeV, 20.3 fb-1. Data 2012 Multijets. Standard Model W+jets. Z+jets. Top Quarks. Dibosons. 10. mSUGRA - m0=800, m1/2 =400 GeV GMSB - Λ = 60 TeV tan β = 30 bRPV - m0=600, m1/2 =600 GeV. 1. 1 10-1 0. 1.5 1 0.5 0. 100. 200. 300. 400. 100. 200. 300. 400. 500. 600. Data/SM. Data/SM. 10-1. 500 600 mτT [GeV]. miss (c) 1τ Tight SR, ET > 300 GeV.. 200. 1.5 1 0.5 200. 400. 600. 800. 1000. 1200. 400. 600. 800. 1000. 1200. 1400. 1600. 1400 1600 HT [GeV]. miss (d) 1τ Tight SR, ET > 300 GeV.. Figure 4. Distribution of mτT after all analysis requirements but the requirement on mτT and the final requirement on HT , and of HT after the mτT requirement for (a, b) the 1τ “Loose” and (c, d) “Tight” SRs. Data are represented by the points. The SM prediction includes the data-driven corrections discussed in the text. The shaded band centred around the total SM background indicates the statistical uncertainty on the background expectation. MC events are normalized to data in the CRs corresponding to mτT below 130 GeV. Also shown is the expected signal from typical mSUGRA, GMSB and bRPV samples. The last bin in the expected background distribution is an overflow bin.. most of the plane for all channels, rising to 50% at the lowest m1/2 region studied and to 80% for individual signal samples generated at the highest m1/2 values.. 9. Results. Observed data and expected background events in the signal regions Data and scaled background simulation were compared for different kinematic quantities. Figure 4 shows the mτT distribution after all the requirements of the analysis except the ones on mτT and HT , as well as the HT distribution after the requirement on mτT for the 1τ channel. “Loose” and “Tight” SR plots are displayed individually with the corresponding miss applied. Figure 5 shows the mτ1 +mτ2 , H 2j and N requirement on ET jet distributions after T T T τ1 all the requirements of the analysis except the final selection on mT +mτT2 and HT2j for the 2τ. – 20 –. JHEP09(2014)103. 1.5 1 0.5 0. 100. Data/SM. Data/SM. 10-1.
(22) 102. ATLAS -1. s=8 TeV, 20.3 fb. Data 2012. Standard Model. Multijets. W+jets. Z+jets. Top Quarks. Events / 50 GeV. Events / 25 GeV. 103. Dibosons bRPV - m0=600 GeV m1/2=600 GeV nGM - mg~ = 940 GeV m∼τ = 210 GeV. 10. 103. ATLAS -1. s=8 TeV, 20.3 fb. 102. W+jets. Z+jets. Top Quarks. bRPV - m0=600 GeV m1/2=600 GeV nGM - mg~ = 940 GeV m∼τ = 210 GeV. 10. GMSB - Λ = 60 TeV tan β = 30. 1. 300. 400. 500. 600. 200. 300. 400. 500. 600. 700. 800. 700 800 τ τ mT1 + mT2 [GeV]. 200 1.5 1 0.5 200. 400. 600. 800 1000 1200 1400 1600 1800 2000. 400. 600. 800 1000 1200 1400 1600 1800 2000 2j HT [GeV]. 2j (b) 2τ HT distribution.. Events. (a) 2τ mτT1 + mτT2 distribution. 104. ATLAS s=8 TeV, 20.3 fb-1. 3. 10. Data 2012. Standard Model. Multijets. W+jets. Z+jets. Top Quarks. Dibosons bRPV - m0=600 GeV m1/2=600 GeV. 102. nGM - mg~ = 940 GeV m∼τ = 210 GeV GMSB - Λ = 60 TeV tan β = 30. 10. Data/SM. 1. 1.5 1 0.5. 2. 3. 4. 5. 6. 7. 8. 9. 10. 11. 12. 2. 3. 4. 5. 6. 7. 8. 9. 10 11 12 Jet Multiplicity. (c) 2τ Njet distribution.. Figure 5. Distribution of mτT1 + mτT2 , HT2j and Njet in the 2τ channel after all analysis requirements but the final SR requirements on mτT1 + mτT2 and HT2j . To reduce the contributions from events with Z bosons decaying into tau leptons, the requirement mτT1 + mτT2 > 150 GeV is applied to all distributions. Data are represented by the points. The SM prediction includes the data-driven corrections discussed in the text. The shaded band centred around the total SM background indicates the statistical uncertainty on the background expectation. MC events are normalized to data in the CRs corresponding to HT2j below 550 GeV. Also shown is the expected signal from typical bRPV, nGM and GMSB samples. There are no data events in the overflow bin after all analysis requirements are applied.. channel. The mτT1 +mτT2 > 150 GeV requirement common to all SRs is applied to reduce contributions from events with Z bosons decaying into tau leptons. Figures 6 and 7 show the miss distributions for each of the SRs in the τ +lepton channels. All common remeff and ET quirements and the jet multiplicity selection corresponding to the respective SR are applied. Good agreement between data and SM expectations is observed for all distributions after applying all corrections and data-driven background estimation techniques. Tables 6–9 summarize the number of observed events in the four channels in data and the number of expected background events. No significant excess over the Standard Model background estimate is observed. Upper limits at 95% confidence level (CL) on the number of signal events for each SR independent of any specific SUSY model are derived using the. – 21 –. JHEP09(2014)103. 200. Data/SM. 1. Data/SM. Standard Model. Multijets Dibosons. GMSB - Λ = 60 TeV tan β = 30. 1.5 1 0.5. Data 2012.
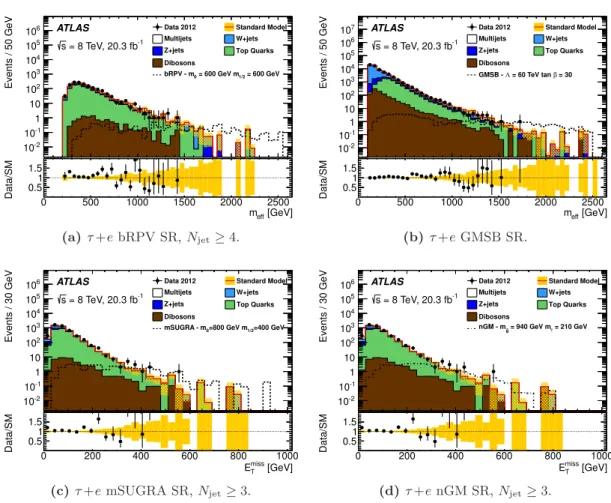
(23) W+jets. Z+jets. Top Quarks. Dibosons bRPV - m0 = 600 GeV m1/2 = 600 GeV. 1500. 2000. 1500. 2000. 2500. 2500 meff [GeV]. Events / 50 GeV. Standard Model. Multijets. Data/SM. Events / 50 GeV. Data/SM. Data 2012. Data 2012. Standard Model. Multijets. W+jets. Z+jets. Top Quarks. Dibosons mSUGRA - m0=800 GeV m1/2=400 GeV. 600. 800. 1000. 600. 800 1000 Emiss [GeV] T. Events / 30 GeV. ATLAS 106 105 s = 8 TeV, 20.3 fb-1 104 103 102 10 1 10-1 10-2 0 200 400 1.5 1 0.5 0 200 400. Data 2012. Standard Model. Multijets. W+jets. Z+jets. Top Quarks. Dibosons GMSB - Λ = 60 TeV tan β = 30. 1500. 2000. 1500. 2000. 2500. 2500 meff [GeV]. (b) τ +e GMSB SR.. Data/SM. Data/SM. Events / 30 GeV. (a) τ +e bRPV SR, Njet ≥ 4.. ATLAS 107 106 s = 8 TeV, 20.3 fb-1 105 104 103 102 10 1 10-1 10-2 0 500 1000 1.5 1 0.5 0 500 1000. (c) τ +e mSUGRA SR, Njet ≥ 3.. ATLAS 106 105 s = 8 TeV, 20.3 fb-1 104 103 102 10 1 10-1 10-2 0 200 400 1.5 1 0.5 0 200 400. Data 2012. Standard Model. Multijets. W+jets. Z+jets. Top Quarks. Dibosons nGM - mg~ = 940 GeV m∼τ = 210 GeV. 600. 800. 1000. 600. 800 1000 Emiss [GeV] T. (d) τ +e nGM SR, Njet ≥ 3.. Figure 6. Distribution of the final kinematic variables in the τ +e channel after all analysis miss requirements but the final SR selections on meff and ET . Data are represented by the points. The SM prediction includes the data-driven corrections discussed in the text. The shaded band centred around the total SM background indicates the statistical uncertainty on the background expectation. MC events are normalized to data in the CRs described in the text. Also shown is the expected signal from typical bRPV, GMSB, mSUGRA and nGM signal samples. The last bin in the expected background distribution is an overflow bin. There are no data events in the overflow bin after all analysis requirements are applied.. CLs prescription [109]. The profile likelihood ratio is used as a test statistic [110] and all systematic uncertainties on the background estimate are treated as nuisance parameters, neglecting any possible signal contamination in the control regions. The limits are computed by randomly generating a large number of pseudo-datasets and repeating the CLs procedure. This calculation was compared to an asymptotic approximation [110], which is used for the model-dependent limits, and was found to be in good agreement. These limits are then translated into upper limits on the visible signal cross section, σvis , by normalizing them to the total integrated luminosity in data. The visible cross section is defined as the product of acceptance, selection efficiency and production cross section. These results are also given in tables 6–9 for all channels.. – 22 –. JHEP09(2014)103. ATLAS 106 105 s = 8 TeV, 20.3 fb-1 104 103 102 10 1 10-1 10-2 0 500 1000 1.5 1 0.5 0 500 1000.
(24) W+jets. Z+jets. Top Quarks. Dibosons bRPV - m0 = 600 GeV m1/2 = 600 GeV. 1500. 2000. 1500. 2000. 2500. 2500 meff [GeV]. Events / 50 GeV. Standard Model. Multijets. Data/SM. Events / 50 GeV. Data/SM. Data 2012. Data 2012. Standard Model. Multijets. W+jets. Z+jets. Top Quarks. Dibosons mSUGRA - m0=800 GeV m1/2=400 GeV. 600. 800. 1000. 600. 800 1000 Emiss [GeV] T. Events / 30 GeV. ATLAS 106 105 s = 8 TeV, 20.3 fb-1 104 103 102 10 1 10-1 10-2 0 200 400 1.5 1 0.5 0 200 400. Data 2012. Standard Model. Multijets. W+jets. Z+jets. Top Quarks. Dibosons GMSB - Λ = 60 TeV tan β = 30. 1500. 2000. 1500. 2000. 2500. 2500 meff [GeV]. (b) τ +µ GMSB SR.. Data/SM. Data/SM. Events / 30 GeV. (a) τ +µ bRPV SR, Njet ≥ 4.. ATLAS 107 106 s = 8 TeV, 20.3 fb-1 105 104 103 102 10 1 10-1 10-2 0 500 1000 1.5 1 0.5 0 500 1000. (c) τ +µ mSUGRA SR, Njet ≥ 3.. ATLAS 106 105 s = 8 TeV, 20.3 fb-1 104 103 102 10 1 10-1 10-2 0 200 400 1.5 1 0.5 0 200 400. Data 2012. Standard Model. Multijets. W+jets. Z+jets. Top Quarks. Dibosons nGM - mg~ = 940 GeV m∼τ = 210 GeV. 600. 800. 1000. 600. 800 1000 Emiss [GeV] T. (d) τ +µ nGM SR, Njet ≥ 3.. Figure 7. Distribution of the final kinematic variables in the τ +µ channel after all analysis miss requirements but the final SR selections on meff and ET . Data are represented by the points. The SM prediction includes the data-driven corrections discussed in the text. The shaded band centred around the total SM background indicates the statistical uncertainty on the background expectation. MC events are normalized to data in the CRs described in the text. Also shown is the expected signal from typical bRPV, GMSB, mSUGRA and nGM signal samples. The last bin in the expected background distribution is an overflow bin. There are no data events in the overflow bin after all analysis requirements are applied.. Interpretation A statistical combination of SRs is performed to produce 95% CL limits on the model parameters for all signal models. For each scenario the combination of SRs from each channel that gives the best expected sensitivity is chosen (see table 10). In setting the limits the full likelihood function that represents the outcome of the combination is used. The combination profits from the fact that all channels considered in the analysis are statistically independent. The limits are calculated using an asymptotic approximation and including all experimental uncertainties on the background and signal expectations, as well as theoretical uncertainties on the background, as nuisance parameters, neglecting any possible signal contamination in the control regions. Correlations between signal and background uncertainties are taken into account.. – 23 –. JHEP09(2014)103. ATLAS 106 105 s = 8 TeV, 20.3 fb-1 104 103 102 10 1 10-1 10-2 0 500 1000 1.5 1 0.5 0 500 1000.
(25) 1τ Loose +1.27 1.12 ± 0.49 −1.12 3.13 ± 0.57 ± 1.10 1.89 ± 0.56 ± 1.58 3.87 ± 0.99 ± 1.62 0.47 ± 0.18 ± 0.16 10.5 ± 1.4 ± 2.6 12. 1τ Tight 0.23 ± 0.10 ± 0.24 0.73 ± 0.20 ± 0.69 0.42 ± 0.15 ± 0.14 0.82 ± 0.34 ± 0.46 0.16 ± 0.10 ± 0.09 2.4 ± 0.4 ± 0.8 3. — — — —. 6.4 ± 0.7 ± 0.4 — 2.8 ± 0.4 ± 0.4 15.7 ± 2.2 ± 1.1. 11.7 (10.1+3.6 −2.6 ). 5.9 (5.3+1.8 −1.3 ). 0.58 (0.50). 0.29 (0.26). 0.37. 0.37. Table 6. Number of expected background events and data yields in the 1τ final state. Where possible, the uncertainties on the number of expected events are separated into statistical (first) and systematic (second) components. The statistical uncertainty comprises the limited number of simulated events in both the SR and the CRs as well as the limited number of data events in the CRs. The SM prediction is computed taking into account correlations between the different uncertainties. Also shown are the number of expected signal events for one selected benchmark point for each signal model studied. For GMSB the chosen point has the parameters Λ = 60 TeV / tan β = 30, for nGM mg̃ = 940 GeV / mτ̃1 = 210 GeV, for bRPV m0 = 600 GeV / m1/2 = 600 GeV and for mSUGRA m0 = 800 GeV / m1/2 = 400 GeV. The resulting 95% CL limit on the number of observed (expected) signal events and on the visible cross sections from any new-physics scenario for each of the final states is shown, taking into account the observed events in data and the background expectations. Discovery p-values are capped at 0.5 in cases where the expected number of events exceeds the observed number.. The resulting observed and expected limits in the GMSB scenario for the combination of all final states considered are shown in figure 8. The yellow band around the expected exclusion limit represents the 1σ statistical and systematic uncertainty on the expected background, as well as the experimental uncertainty on the signal. The dashed red lines around the observed limit indicate the effect of the theoretical uncertainties on the signal cross section. The limits quoted in the following correspond to the assumption that the signal cross section is reduced by 1σ. A lower limit on the SUSY breaking scale Λ of 63 TeV is determined, independent of the value of tan β. The limit on Λ increases to 73 TeV for large tan β (tan β > 20). This corresponds to excluding gluino masses lower than about 1600 GeV. These are the strongest available limits on GMSB-like SUSY with tau lepton signatures.. – 24 –. JHEP09(2014)103. — Multijet W + jets Z + jets Top Diboson Total background Data Signal MC Events GMSB 60/30 nGM 940/210 bRPV 600/600 mSUGRA 800/400 Obs (exp) limit on signal events Obs (exp) limit on vis. cross section (fb) Discovery p-value p(s = 0).
Figure


+7


Documento similar
87 Department of Physics and Astronomy, Michigan State University, East Lansing, Michigan, USA. 88a INFN Sezione di Milano,
Institute of High Energy Physics, Chinese Academy of Sciences, Beijing; (b) Department of Modern Physics, University of Science and Technology of China, Anhui; (c) Department
35 ( a ) Institute of High Energy Physics, Chinese Academy of Sciences, Beijing; ( b ) Department of Modern Physics, University of Science and Technology of China, Anhui; ( c
Institute of High Energy Physics, Chinese Academy of Sciences, Beijing; (b) Department of Modern Physics, University of Science and Technology of China, Anhui; (c) Department
As the soft and hard single-lepton channels are orthogonal in their signal and control region definitions, a full statistical combination of all soft and hard single-lepton
ATLAS Collaboration, Search for squarks and gluinos using final states with jets and missing transverse momentum with the ATLAS detector in √.. s = 7 TeV
Besides avoiding a reliance on the value of the theoretical V γ cross sec- tion, which is observed to underestimate the measured production rate of W γ events [57,58], this method
The following four background contributions are estimated by using data: W + jets and tt production, which are the dominant components for the single-muon search; ( Z → νν ) +
