Antimicrobial nanocomposites and electrospun coatings based on poly(3 hydroxybutyrate co 3 hydroxyvalerate) and copper oxide nanoparticles for active packaging and coating applications
28
0
0
Texto completo
(2) *4b: Manuscript Click here to view linked References. 1 2 3 4 5 6 7 8 9 10 11 12 13 14 15 16 17 18 19 20 21 22 23 24 25 26 27 28 29 30 31 32 33 34 35 36 37 38 39 40 41 42 43 44 45 46 47 48 49 50 51 52 53 54 55 56 57 58 59 60 61 62 63 64 65. Antimicrobial. and. Nanoparticles. Virucidal. Incorporated. Activity into. of. Copper. Biodegradable. hydroxybutyrate-co-3-hydroxyvalerate). of. Interest. Oxide Poly(3-. in. Food. Packaging and Coating Applications. a. a. b. a. a. J.L. Castro-Mayorga , M.J. Fabra , L. Cabedo , G. Sanchez and J.M. Lagaron *. a. b. Institute of Agrochemistry and Food Technology (IATA), CSIC, 46980, Valencia, Spain. Polymers. and. Advanced. Materials. Group. (PIMA),. Universitat. Jaume. I,. 12071,. *. Castellon,. Spain. Corresponding author. IATA-CSIC, Avda. Agustín Escardino, 7, 46980, Paterna, Valencia, Spain. Tel.:+34 96 3900022; fax: +34 96 3636301.E-mail address: [email protected].
(3) 1 2 3 4 5 6 7 8 9 10 11 12 13 14 15 16 17 18 19 20 21 22 23 24 25 26 27 28 29 30 31 32 33 34 35 36 37 38 39 40 41 42 43 44 45 46 47 48 49 50 51 52 53 54 55 56 57 58 59 60 61 62 63 64 65. ABSTRACT Active. biodegradable. poly(3-hydroxybutyrate-co-3-hydroxyvalerate). (PHBV). melt. mixed. nanocomposites and bilayer structures containing cooper oxide (CuO) nanoparticles were developed and characterized. The bilayer structures consisted of a bottom layer of compression molded PHBV3 (3% mol valerate) coated with an active electrospun fibers mat made with microbial mixed culture derived PHBV18 (18 % valerate) and CuO nanoparticles. The results showed that the oxygen barrier properties were slightly enhanced by the addition of 0.05% CuO nanoparticles to nanocomposite films but a negligible effect was registered for the bilayer structures. Neither the water vapor permeability nor the mechanical properties were modified by the addition of CuO. Interestingly, by incorporating highly dispersed and distributed CuO nanoparticles in a coating by electrospinning, a lower metal oxide loading was required to exhibit significant bactericidal and virucidal. performance. against. the. food-borne. pathogens. Salmonella. enterica,. Listeria. monocytogenes and Murine norovirus. The biodisintegration tests of the samples under composting conditions showed that even the 0.05% CuO coated structures biodegraded within 35 days.. KEYWORDS: metal nanoparticles, polyhydroxyalkanoates, active packaging, electrospinning, biodisintegration.. 1. INTRODUCTION. Among the different kinds of nanoparticles applied in many fields of human life, which range from energy production to industrial production processes and biomedical applications, those having antimicrobial activity are highlighted as they can be incorporated into a variety of polymer matrices used in daily life, producing novel biocide materials. Metal and metal oxide nanoparticles based on gold, zinc, silver and copper have been reported to exhibit a wide antimicrobial spectrum against different species of microorganisms, including virus, fungi and bacteria [1]..
(4) 1 2 3 4 5 6 7 8 9 10 11 12 13 14 15 16 17 18 19 20 21 22 23 24 25 26 27 28 29 30 31 32 33 34 35 36 37 38 39 40 41 42 43 44 45 46 47 48 49 50 51 52 53 54 55 56 57 58 59 60 61 62 63 64 65. In the specific case of copper, it has been used for centuries as biocide compound to disinfect liquids, solids and human tissues and more recently used as an antifouling agent, water purifier, algaecide, fungicide, and bactericide for different biomedical applications [2]. In the food area, metallic copper sheets have been studied as antimicrobial surfaces to inhibit the growth of enteropathogens [3]. Copper and copper oxide bulk materials (micro-sized) has been physically and chemically characterized and investigated as antimicrobial agents [4, 5], counting with added advantages such as that they are easily mixed with polar liquids and polymers, relatively stable in terms of chemical and physical properties and cheaper and less toxic for living organism than silver [6, 7]. However, the antimicrobial use of copper could be successfully extended by using it in the nano-sized form and by embedding into polymeric matrices. The incorporation of antimicrobials in a polymer matrix allows the gradual release of the biocide substance from package, controlling the microbial contamination during the transport and storage phase of food distribution at the same time reducing the amount of preservatives added within the bulk of food [8]. Because of the intrinsic characteristics of electrospun fibres such as very high specific surface and porosity [9] and the suitability of the technique to encapsulate active substances within the fibres, the electrospun materials provide excellent candidates for many applications [17]. Biopolymers constitute ideal carriers for antimicrobials in active packaging applications because of their adaptable capacity for controlled release and the possibility of development of blends and multilayers [10]. One of the most promising biopolymers are the polyhydroxyalkanoates (PHAs) family which has been attracting much attention in recent years as biocompatible and biodegradable thermoplastics with potential applications [11]. The most extensively studied polymer from the PHAs group is the poly(3-hydroxybutyrate), PHB. PHB is partially crystalline with a high melting temperature and high degree of crystallinity and high rigidity [12, 13].. To overcome these aspects, the copolymer. obtained with the insertion of 3-hydroxyvalerate (HV) units, known as poly(3-hydroxybutyrate-co-3hydroxyvalerate), PHBV, is usually employed to improve the handling properties of PHB films..
(5) 1 2 3 4 5 6 7 8 9 10 11 12 13 14 15 16 17 18 19 20 21 22 23 24 25 26 27 28 29 30 31 32 33 34 35 36 37 38 39 40 41 42 43 44 45 46 47 48 49 50 51 52 53 54 55 56 57 58 59 60 61 62 63 64 65. To the best of our knowledge, there is no existing literature on the incorporation of CuO nanoparticles in bio-based matrices and, in particular, in PHAs matrices. Therefore, the main goal of this work was to develop and characterize the antimicrobial performance and physicochemical properties of PHBV nanocomposites and bilayer films containing CuO nanoparticles. Concretely, melt mixed nanocomposites of commercial PHBV3 (3% mol valerate) and mixed microbial cultures derived PHBV18 (18% mol valerate) with different CuO loadings were prepared and the effect of adding an electropun PHBV18/CuO coating over compression molded PHBV3 films on the mechanical, thermal, barrier, biodisintegration properties and more interestingly on the antibacterial and antiviral activity against the food-borne pathogens Salmonella enterica, Listeria monocytogenes and Murine Norovirus were studied.. 2. MATERIALS AND METHODS. 2.1 Materials Copper oxide (CuO) nanoparticles were kindly supplied by Hefei Quantum Quelle Nano Science & Technology Co., Ltd (Hefei, China). PHBV3 (3 mol % valerate content) purchased from Tianan Biopolymer (Ningbo, China) and unpurified PHBV18 (18 mol % valerate) synthesized from mixed microbial cultures fed with cheese whey, according to the method described by Martinez-Abad et al., 2015 [14], were used as polymer matrix. 2,2,2-Trifuoroethanol (TFE, ≥ 99 wt.%, Sigma Aldrich) was used as a solvent for the PHBV18.. 2.2 CuO particle size.
(6) 1 2 3 4 5 6 7 8 9 10 11 12 13 14 15 16 17 18 19 20 21 22 23 24 25 26 27 28 29 30 31 32 33 34 35 36 37 38 39 40 41 42 43 44 45 46 47 48 49 50 51 52 53 54 55 56 57 58 59 60 61 62 63 64 65. The particle size distribution, weight mean diameter (D4,3) and volume-surface mean diameter (D3,2) were determined in triplicate with a dynamic light scattering (DLS) instrument (Malvern Mastersizer, Malvern Instruments, Worcestershire, U.K.). In order to avoid agglomeration/clustering of the nanoparticles in the water suspension, a small amount of Sodium hexametaphosphate (Sigma Aldrich, St. Louis, USA) was incorporated to the water and ultrasound stirring was applied prior to the DLS measurement. D4,3 is the average size based on the unit weight of particles, whereas D3,2 represents the average size based on the specific surface per unit volume. These parameters are described by equations 1 and 2, where ni is the number of droplets of a determined size range and di is the droplet diameter.. D4 , 3. n d n d. D3, 2 . i. 4 i. i. 3 i. (Eq. 1). n d n d. 3 i i 2 i i. (Eq. 2). 2.3 Development of active PHBV films Active films based on CuO nanoparticles and PHBV were developed using two different methods of preparation and two different loading. The samples code and composition are summarized in Table 1. Table 1. Samples code and composition of the developed materials. Sample code. Composition. PHBVs. 86% PHBV3 + 14% PHBV18. 0.1%. PHBVs + 0.1% CuO. 0.05%. PHBVs + 0.05% CuO. 0.05% ES. Bottom layer: PHBV3, coating: 14% electrospunPHBV18+0.05% CuO. 2.3.1 Preparation of nanocomposites PHBV3 pellet (86 wt.%), unpurified PHBV18 powder (14 wt.%) and the CuO powder (0.05 and 0.1 wt.%) were directly melt mixed in an internal mixer (Brabender Plastograph, Germany) during 5 minutes at 60 rpm and 180°C. Neat PHBV3/PHBV18 (sample code: PHBVs) blends prepared by melt mixing were used as control for comparative purposes.. The batches were subsequently.
(7) 1 2 3 4 5 6 7 8 9 10 11 12 13 14 15 16 17 18 19 20 21 22 23 24 25 26 27 28 29 30 31 32 33 34 35 36 37 38 39 40 41 42 43 44 45 46 47 48 49 50 51 52 53 54 55 56 57 58 59 60 61 62 63 64 65. processed into thin sheets (thickness of 130 μm) by compression molding, using a hot-plate hydraulic press (Carver 4122, U.S.) at 180°C, 1.8 MPa and 3 min.. 2.3.2 Preparation of the coated systems In a second approach, PHBV3 films were coated with PHBV18/CuO ultrathin fibers mats containing 0.05 wt.% of CuO which were produced by means of the electrospinning technique according to the above description (sample code: 0.05% ES). For the PHBV18/CuO ultrathin fibers mats preparation, polymer solutions contained a total solids content of 6 wt.% was prepared as follow: First, the unpurified PHBV18 at 99.95 wt.% was dissolved in TFE under magnetic stirring for 4 h at 50°C and cooled down at room temperature. Then, CuO nanoparticles were incorporated at the remaining 0.05 wt. % and stirred for 2 more hours. After this time, the mixture was homogenized for 2 min using a high shear speed homogenizer (Model T25, Ultra-Turrax, IKA, Germany). Thereafter, the solution was transferred to a 5 mL glass syringes, connected through PTFE tubes to a stainless steel needle (0.9 mm of inner diameter) and processed using a Fluidnatek® LE-10 electrospinning equipment (Valencia, Spain). Processed samples were collected on a rotational stainless-steel drum spinning at 200 rpm connected to the cathode of the power supply and oriented in parallel at the syringe. The injector was motorized to scan along the width of the drum collector to homogenously deposit the fibers. The distance between the needle and the collector was 12 cm and the voltage was maintained at 10 kV. All experiments were carried out at room temperature under a steady flow-rate of 7 mL/h. After electrospinning, the fibers mats were dried at 60°C under vacuum for 24 h to completely remove the solvent and were subsequently used to prepare the coating. Later, a post-annealing step was applied to form a continuous film by fibers coalescence. Fibers mats (14 wt.%) of c.a. 40 µm of thickness were placed onto PHBV3 films prepared by compression moulding as described above. This assembly was put in between hot plates hydraulic press (Carver 4122, USA) at 150 °C during 2 min (without pressing)..
(8) 1 2 3 4 5 6 7 8 9 10 11 12 13 14 15 16 17 18 19 20 21 22 23 24 25 26 27 28 29 30 31 32 33 34 35 36 37 38 39 40 41 42 43 44 45 46 47 48 49 50 51 52 53 54 55 56 57 58 59 60 61 62 63 64 65. 2.4 Characterization of CuO nanoparticles and active films. 2.4.1 Morphology The morphology of the electrospun fibers and the active films were studied by Scanning Electron and Transmission Microscopy, SEM and TEM respectively. For SEM observations, the films were cryo-fractured after immersion in liquid nitrogen and subsequently sputtered with a gold- palladium mixture under vacuum. The SEM was conducted on a Hitachi microscope (Hitachi S-4800) at an accelerating voltage of 5 kV and a working distance of 8-10 mm. The TEM analysis was performed on previously ultra-microtomed (Leica EM UC6) samples sing a Jeol 1010 (Hitachi) transmission electronic microscope with an accelerating voltage of 80kV. To obtain an accurate estimation of the average fiber and nanoparticles diameter, 200 to 300 measurements were done by means of the Adobe Photoshop CS4 software from the SEM and TEM micrographs in their original magnification.. 2.4.2 Optical properties Transparency of the neat PHBV3 film and coated systems was determined through the surface reflectance spectra in a spectrocolorimeter CM-3600d (Minolta Co., Tokyo, Japan) with a 10 mm illuminated sample area. The internal transmittance (Ti) of the samples was determined by applying the Kubelka-Munk theory [15] for multiple scattering to the reflection spectra where an increase in the spectral distribution of transmittance is associated with more homogeneous and transparent samples. Measurements were taken in triplicate for each sample by using both a white and black background. Moreover, CIE-L* a* b* coordinates (CIE, 1986) were obtained by the infinite reflection spectra of the samples, using D65 illuminant/10 observer. Samples were evaluated per duplicate and three measurements were taken at random locations on each of the studied films..
(9) 1 2 3 4 5 6 7 8 9 10 11 12 13 14 15 16 17 18 19 20 21 22 23 24 25 26 27 28 29 30 31 32 33 34 35 36 37 38 39 40 41 42 43 44 45 46 47 48 49 50 51 52 53 54 55 56 57 58 59 60 61 62 63 64 65. 2.4.3 Wide Angle X-Ray Diffraction Analysis (WAXD) X–ray diffractograms of the CuO powder samples and films were recorded at room temperature using a Bruker AXSD4 Endeavour diffractometer with a Cu–Kα source (wavelength = 1.54178 Å). Peak fitting was carried out using IgorPro software package (Wavemetrics, Lake Oswego, Oregon). Gaussian function was used to fit the experimental diffraction profiles obtained. The crystallinity degree (Xc) of the films was taken as the ratio of the sum of areas under the crystalline diffraction peaks to the total area under the curve between 2θ = 5°and 40°.. 2.4.4 Differential Scanning Calorimetry (DSC) Thermal properties of the neat PHBVs films and its active nanocomposites were evaluated by DSC using a Perkin-Elmer DSC 8000 thermal analysis system under nitrogen atmosphere. The sample treatment consisted of a first heating step from 0°C to 200°, a subsequent cooling down to -50°C and a second heating step up to 200°C. The heating and cooling rates for the runs were 10°C/min and the typical sample weight was 3 mg. The first melting endotherm, and the controlled crystallization at 10°C/min from the melt, was analysed. To ensure reliability of the data obtained, heat flow and temperature were calibrated using indium as a standard. The tests were done, at least, in triplicate.. 2.4.5 Mechanical properties Tensile tests were performed according to ASTM Standard D638 using a Universal Testing Machine (Shimadzu AGS-X 500N). Before testing, the samples were allowed to reach the equilibrium under ambient conditions (25°C and 50% R.H. for 24 hours) and cut in dumbbell shaped specimen. Elastic modulus, tensile strength, and elongation at break were determined from the stress-strain curves, estimated from force–distance data obtained for the different films. At least, three specimens of each film were tensile tested as to obtain statistically meaningful results..
(10) 1 2 3 4 5 6 7 8 9 10 11 12 13 14 15 16 17 18 19 20 21 22 23 24 25 26 27 28 29 30 31 32 33 34 35 36 37 38 39 40 41 42 43 44 45 46 47 48 49 50 51 52 53 54 55 56 57 58 59 60 61 62 63 64 65. 2.4.6 Water Vapour Permeability (WVP) Water vapour permeability (WVP) was determined according to the ASTM E96 (ASTM 2011) gravimetric method, using Payne permeability cups (Elcometer SPRL, Hermelle/s Argenteau, Belgium). Cells containing distillate water were placed inside a desiccator at 0% RH and 24°C and 2. the water weight loss through a film area of 0.001 m was monitored. WVP was calculated from the steady-state permeation slopes obtained from the regression analysis of weight loss data over time. All measurements were performed in triplicate.. 2.4.7 Oxygen transmission rate (OTR) measurements The oxygen permeability coefficient was derived from oxygen transmission rate (OTR) measurements recorded using an Oxygen Permeation Analyzer M8001 (Systech Illinois, UK). Experiments were carried out at 23°C and 80% RH. The samples were previously purged with -1. nitrogen in the humidity equilibrated samples, before exposure to an oxygen flow of 10 mL min . 2. The exposure area during the test was 5 cm for each sample. In order to obtain the oxygen permeability, film thickness and gas partial pressure were considered in each case. The measurements were done in triplicate.. 2.5 Antibacterial activity of active films The antibacterial activity experiments were performed with the foodborne pathogens, Salmonella enterica CECT 4300 and Listeria monocytogenes CECT 7467. All the strains were obtained from the Spanish Type Culture Collection (CECT: Valencia, Spain) and stored in phosphate buffered saline (PBS, Sigma Aldrich) with 10 wt.-% tryptic soy broth (TSB, Conda Laboratories) and 10 wt.-% glycerol at -80˚C until needed. The stock culture was maintained by regular subculture to tryptone soy agar (TSA) slants at 4°C and transferred monthly. Previous to each antimicrobial assay, a loopful of bacteria was transferred to 10 mL of TSB and incubated at 37˚C overnight and an aliquot was again transferred to TSB and grown at 37˚C and 120 rpm to the mid-exponential phase of growth and this cultured was used as inoculum..
(11) 1 2 3 4 5 6 7 8 9 10 11 12 13 14 15 16 17 18 19 20 21 22 23 24 25 26 27 28 29 30 31 32 33 34 35 36 37 38 39 40 41 42 43 44 45 46 47 48 49 50 51 52 53 54 55 56 57 58 59 60 61 62 63 64 65. The antibacterial activity of the active films was evaluated according to the Japanese Industrial Standard JIS Z 2801 (ISO 22196:2011) with some modifications. Film samples (3 x 3 cm) sterilized by UV treatment were placed into sterile Petri dishes. A microorganism suspension containing 5. about 5x10 CFU/mL was put onto film samples. Then inoculated film samples were covered with an inert piece of UV sterilized Low-Density Polyethylene (LDPE) of 2.5 x 2.5 cm. Petri dishes containing the inoculated film samples were incubated at 25°C under relative humidity (RH) of above 95% for 24 h. After the incubation time, microorganisms were recovered from film samples and inoculated onto TSA plates for conventional microbiological counts. The PHBVs films (without CuO) were used as a control. The value of the bacterial reduction (R) was calculated by determining log10 (N0/Nt), where N0 is the average of the number of viable cells of bacteria on the untreated test piece after 24 h and Nt is the average of the number of viable cells of bacteria on the antimicrobial test piece after 24 h. Three replicate experiments were performed for each sample.. 2.6 Virucidal activity of active films Murine norovirus, MNV-1 strain, was propagated and assayed in RAW 264.7 cells (kindly provided by Prof. H. W. Virgin, Washington University School of Medicine, USA). Semi-purified viral stocks were harvested 2 days post infection by three freeze-thaw cycles of infected cells followed by centrifugation at 660×g for 30 min to remove cell debris. Infectious viruses were enumerated by determining the 50% tissue culture infectious dose (TCID 50) with eight wells per dilution and 20 μl of inoculum per well using the Spearman-Karber method [16]. The virucidal activity of copper based films was also evaluated based on the JIS Z 2801 (ISO 22196:2011) standard. Briefly, a suspension of MNV diluted in PBS buffer (6 log TCID 50/ml) was placed onto the test films of 3×3 cm and covered by an inert piece of Low-Density Polyethylene (LDPE) of 2.5×2.5 cm and 10 μm thickness. Samples were overnight incubated at 25 °C and 95% RH. Subsequently, the top film was lifted, and the virus droplet-exposed sides were recovered. Tenfold dilutions of the samples were inoculated into confluent RAW monolayers in 96-well plates. Then, infectious viruses were enumerated by cell culture assays as described above. Each experimental condition was done in triplicate. Positive controls were virus inoculated in PHBVs.
(12) 1 2 3 4 5 6 7 8 9 10 11 12 13 14 15 16 17 18 19 20 21 22 23 24 25 26 27 28 29 30 31 32 33 34 35 36 37 38 39 40 41 42 43 44 45 46 47 48 49 50 51 52 53 54 55 56 57 58 59 60 61 62 63 64 65. films. The decay of MNV titters was calculated as log10 (N0/Nt), where N0 is the infectious virus titter for PHBVs films and Nt is the infectious virus titter for active films containing CuO. 2.7. Biodisintegration in composting conditions Disintegratibility of the films was assessed by means of a disintegration test under lab-scale composting conditions according to the ISO 20200 standard, “Determination of the degree of disintegration of plastic materials under simulated composting conditions in a laboratory-scale test”. For the preparation of solid synthetic waste, 10% of activated mature compost (Vigorhumus H-00, purchased from Burás Profesional, S.A., Girona, Spain) was mixed with 30 wt. % rabbit food, 10 wt. % starch, 5 wt. %. sugar, 1wt. % urea, wt. 4% corn oil and 40wt. % sawdust. The water content of the substrate was around 55 wt. % and the aerobic conditions were guaranteed by gently mixing the compost and periodically adding water according to the standard requirements. The samples 3. were cut from the films (10 x 10 x 0.1 mm ) and buried inside plastic mesh bags to simplify their extraction and allow the contact of the compost with the specimens, and were incubated at 58ºC for 41 days. At different composting times samples were recovered for analysis, washed with distilled water, dried at 40ºC under vacuum for 24 h, and weighed. The degree of disintegration was calculated by normalising the sample weight, at different days of incubation, to the initial weight with Equation (3), where mi is the initial dry mass of the test material and m f is the dry mass of the test material recovered at different incubation stages. (3). 2.8 Statistical analysis The statistical analysis was carried out by means of StatGraphics Plus version 5.1 (Statistical Graphics Corp.) through the analysis of variance (ANOVA). Homogeneous sample groups were obtained by using Tukey’s Honestly Significant Difference (HSD) (95% significant level)..
(13) 3. RESULTS AND DISCUSSION. In the present work, commercial CuO nanoparticles were incorporated into PHBV by direct meltmixing at two different concentrations (0.05 and 0.1% CuO) and, the lower loading (0.05%) was also used for the formation of an annealed coating of electrospun PHBV18/CuO fibers mats put over compression molded PHBV3 films for comparison purposes. The physicochemical properties of both systems were determined and are shown below.. 3.1 Morphology and optical properties of CuO nanoparticles and active films. Firstly, the morphology and the particle size of the commercial CuO nanoparticles were characterized. From Figure 1, the morphology of the particles appears to be rather flaky (Figure 1a) and their the particle size distribution shows (Figure 1b) a bimodal distribution with a mean weight size D4,3 of 191nm.. (a). (b). 10 9 8 7 6. Volume (%). 1 2 3 4 5 6 7 8 9 10 11 12 13 14 15 16 17 18 19 20 21 22 23 24 25 26 27 28 29 30 31 32 33 34 35 36 37 38 39 40 41 42 43 44 45 46 47 48 49 50 51 52 53 54 55 56 57 58 59 60 61 62 63 64 65. 5 4 3 2 1 0 0.01. 0.1. 1. 10. 100. Particle size (m). Figure 1. Morphological properties of CuO nanoparticles (a) SEM images, (b) particle size distribution.. Once the CuO nanoparticles were incorporated into the PHBV films, a microstructural analysis by means of electronic microscopy was carried out in order to obtain information about the arrangement of films components and CuO nanoparticles dispersion. Representative SEM micrographs of cryo-fractured sections of the nanocomposites films are displayed in Figure 2. PHBVs films showed a compacted structure (cf. Fig 2a) which was not significantly altered by the.
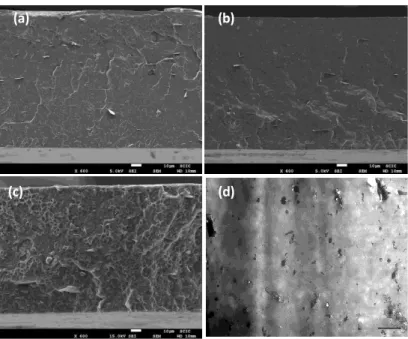
(14) 1 2 3 4 5 6 7 8 9 10 11 12 13 14 15 16 17 18 19 20 21 22 23 24 25 26 27 28 29 30 31 32 33 34 35 36 37 38 39 40 41 42 43 44 45 46 47 48 49 50 51 52 53 54 55 56 57 58 59 60 61 62 63 64 65. addition of 0.05% CuO by melt-mixing (cf. Fig 2b). However, the incorporation of CuO at 0.1% promoted some changes in the morphology of the PHBVs matrix since a rough surface was observed in the cross-section of films (cf. Fig 2c) and a marked agglomeration pattern in the TEM images of the ultrathin sections (cf. Fig 2d). Moreover, it is noteworthy to remark that all samples shows the presence of some flaky elements in the morphology of the cross section (see Figures 2a, 2b and 2c) that could be ascribed to the presence of a nucleating additive (see later the WAXD data in further support of this argument).. (a). (c). (b). (d). Figure 2. Micrograph of the neat PHBVs and its active nanocomposites obtained by melt mixing. (a) SEM image of PHBVs, (b) SEM image of PHBVs 0.1%, (c) SEM image of PHBVs 0.05%, (d) TEM image of an ultrathin section of 0.01% CuO film.. The fibers mats used as coating in the 0.05% ES films were also observed by SEM, Figure 3 shows representative images of electrospun PHBV18/CuO fibers before the annealing step (cf. Fig 3a) exhibiting an average diameter of 1.01 ± 0.2 µm. After the thermal annealing, the electrospun fibers formed a continuous layer (cf. Fig3b) which was strongly adhered to the surface of PHBV3 (cf. Fig 3c). Moreover, CuO nanoparticles appeared well dispersed and distributed within the polymer.
(15) 1 2 3 4 5 6 7 8 9 10 11 12 13 14 15 16 17 18 19 20 21 22 23 24 25 26 27 28 29 30 31 32 33 34 35 36 37 38 39 40 41 42 43 44 45 46 47 48 49 50 51 52 53 54 55 56 57 58 59 60 61 62 63 64 65. matrix, having a diameter of around 182 ± 5 nm as it can be seen in the ultrathin section of TEM images of the coated structure TEM images (cf.. Fig 3d). This value matches with the CuO. nanoparticles mean weight size (D4,3 =191nm) observed for CuO nanoparticles before their incorporation into the PHBV film and is an indication of the effective prevention of nanoparticles agglomeration resulted from the application of electrospinning coating technique.. (a). (b). (c). (d). Figure 3. Microscopic pictures of the electrospun fibers and the active 0.05% ES film. (a) SEM image of the PHBV18/CuO fibers, (b) top view of the 0.05% ES film. (c) cross-section of the 0.05% ES film. (d) TEM image of the ultrathin section of the 0.05% ES film. The white arrows in figure 3c highlight the thickness of the active coating layer. Optical properties (transparency and color parameters) are relevant for the packaging application, since it is desirable that the packaging contents can be inspected through the film. Changes in transparency are related with their internal structure since CuO nanoparticles might affect the optical properties. Figure 4 shows the contact transparency images of the neat PHBV3, the PHBVs mixture and the active systems. In principle, the neat PHBV3 and coating structures preserved a good contact transparency but it was slightly compromised in nanocomposite films prepared by.
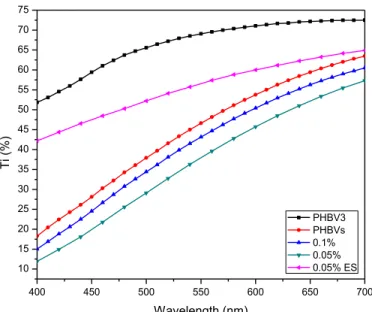
(16) 1 2 3 4 5 6 7 8 9 10 11 12 13 14 15 16 17 18 19 20 21 22 23 24 25 26 27 28 29 30 31 32 33 34 35 36 37 38 39 40 41 42 43 44 45 46 47 48 49 50 51 52 53 54 55 56 57 58 59 60 61 62 63 64 65. melt-mixing (with and without CuO), in turn suggesting some level of degradation of the PHBV18 during the melt-mixing process.. Figure 4. Contact transparency pictures of films. (A) PHBV3, (B) PHBVs, (C) 0.1%, (D) 0.05%, (E) 0.05% ES. The transparency was also quantitatively assessed by means of internal transmittance (Ti) measurements. This parameter is directly related to the arrangement of film´s components and thus, linked to the light transmission/dispersion behavior of nanocomposites/coating structures. As observed, the neat PHBV3 and the coating structure (0.05% ES) showed a similar pattern over the wavelength considered (cf. Fig. 5), although Ti values of the coating structure were significantly lower (less transparent) than the neat PHBV3 matrix which can be associated to the presence of several compounds with different refractive index (i.e. PHBV18 and CuO). Interestingly, a different pattern was observed for active PHBVs melt compounded nanocomposites, being also less transparent (lower Ti values) than the neat PHBVs and the coated structures. Therefore, the surface morphology and thus, the strategy followed to develop the films (nanocomposites or coating) play an important role on their optical properties. The lower Ti values observed in nanocomposite films, implies a greater light dispersion, greater opacity and thus, more heterogeneous matrices probably due to the presence of PHBV18 which seems to be thermally degraded to some extent during the melt-mixing process, making the film darker with a brown hue as it can also be deduced from the contact transparency images (cf. Fig. 4)..
(17) 75 70 65 60 55 50 45. Ti (%). 1 2 3 4 5 6 7 8 9 10 11 12 13 14 15 16 17 18 19 20 21 22 23 24 25 26 27 28 29 30 31 32 33 34 35 36 37 38 39 40 41 42 43 44 45 46 47 48 49 50 51 52 53 54 55 56 57 58 59 60 61 62 63 64 65. 40 35 30 25. PHBV3 PHBVs 0.1% 0.05% 0.05% ES. 20 15 10 400. 450. 500. 550. 600. 650. 700. Wavelength (nm). Figure 5. Internal transmittance (Ti) of PHBV3, PHBVs and their CuO nanocomposites.. Color differences were also quantitatively assessed by means of lightness (L*), hue (hab*) and Chroma (Cab)*, obtained from the reflectance spectra of an infinity thickness film and the results are gathered in Table 2. The first thing to highlight is that the degraded PHBV18 in nanocomposite films (with and without CuO) made the films darker (lower L*), less vivid (higher Cab*) and with a brown hue indicating rather deficient optical properties, as compared to the neat PHBV3 and the coated films. This was supported by the highest total difference values (ΔE) obtained for the PHBVs and nanocomposites films; whereas the coating structures presented the lowest color difference as compared to the neat PHBV3. As previously reported by Castro-Mayorga et al. [17], this color differences can be ascribed to PHBV18 impurities from the fermentation process (close to 30 wt.%, Castro-Mayorga et al. [18], which induce Maillard reactions between amide groups and residual reducing sugars during the melt-mixing process. Interestingly, while the addition of ZnO mitigated the effect of the unpurified PHBV18, improving the appearance of the melt-mixed nanocomposite films [19], this seems not to occur for CuO nanoparticles as it can be observed in Figure 4..
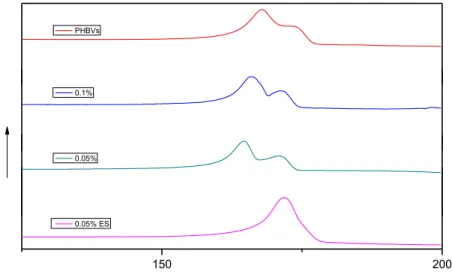
(18) 1 2 3 4 5 6 7 8 9 10 11 12 13 14 15 16 17 18 19 20 21 22 23 24 25 26 27 28 29 30 31 32 33 34 35 36 37 38 39 40 41 42 43 44 45 46 47 48 49 50 51 52 53 54 55 56 57 58 59 60 61 62 63 64 65. Table 2. Color parameters of PHBV3, PHBVs and their CuO nanocomposites/coating systems. Sample. L. Cab. ΔE. hab. PHBV3. 82.4 ± 0.4. a. 17.8 ± 0.1. a. 85.5 ± 0.7. a. PHBVs. 48.4 ± 1.1. b. 19.2 ± 0.4. a. 68.5 ± 0.7. b. bc. 19.4 ± 0.3. a. 68.5 ± 0.7. b. 42.8 ± 0.4. c. 16.9 ± 0.0. a. 66.0 ± 0.0. b. 40.1 ± 0.7. b. 73.0 ± 0.8. d. 19.5 ± 1.9. a. 82.5 ± 0.7. c. 9.7 ± 0.8. c. 0.1% 0.05% 0.05%ES. 45.4 ± 1.3. 34.5 ± 0.8 37.4 ± 1.6. a. ab. Mean values ± standard deviation. Mean values with different superscript letters in the same column represent significant differences (p < 0.05) among the samples according to ANOVA and Tukey’s multiple comparison tests.. 3.2 Thermal properties Differential Scanning Calorimetry (DSC) assays were carried out to evaluate how the CuO nanoparticles affected the thermal properties of the PHBVs matrix. Table 3 gathers thermal parameters (melting/crystallization temperature and melting enthalpy) of the developed samples which were determined from the first heating run, offering information related to the thermal characteristics of the so obtained material. Figure 6 shows. representative first heating. thermograms for each sample. The first clear observation is that the method of CuO incorporation, either by melt-mixing or as an electrospun coating, affected the thermal behavior of the PHBVs films. Thus, when CuO nanoparticles were directly added in the melt mixing process, the DSC curves of the first heating scan showed two distinguishable melting peaks, which occurred between 165°C and 172°C. Multiple melting peaks occurring during the DSC first heating scan of PHBV and PHBV containing metal nanoparticles have been previously interpreted as a result of a meltingrecrystallization process during the thermal run [19-21]. Nevertheless, compared to the neat PHBVs, the active films prepared by melt compounding, i.e. 0.1% and 0.05% films, did not present any significant difference in their melting enthalpy (ΔHm) or crystallization temperature (T c) suggesting that the nanoparticles do not interfere with crystallization. In contrast, the addition of CuO within the coated structures led to a significant decrease in the melting enthalpy with regard to the neat PHBVs and their nanocomposites. This agrees with the results reported earlier by Castro-Mayorga et. al. [22] which ascribed the thermal behavior.
(19) variations to the more homogeneous melting of the fibers due to the high surface to volume ratio of the electrospun materials as compared to a thicker continuous film. These results do not necessarily translate into crystallinity due to the differential behavior during melting of the materials and the crystallinity development observed during the DSC run.. Table 3. DSC maximum of melting (Tm) and melting enthalpy (∆Hm) obtained from the first heating scan of the neat PHBVs film and their CuO nanocomposites/coated systems. * The degree of crystallinity (Xc) was determined by WAXDS. Sample. Tm1 (°C). Tm2 (°C). ΔHm. Tc (°C). Xc * (WAXD). (J/g PHBVs) PHBVs. 169.6 ± 2.4. a. 173.2 ± 1.0. a. 107.1 ± 1.0. a. 74 ± 2. a. 66 ± 1. a. 0.10%. 165.3 ± 0.9. a. 171.5 ± 0.5. a. 104.9 ± 0.3. a. 75 ± 2. a. 66 ± 1. a. 0.05%. 165.1 ± 0.7. a. 171.4 ± 0.5. a. 103.8 ± 0.7. a. 77 ± 2. a. 64 ± 1. a. 0.05% ES. 169.9 ± 2.7. a. 107.6 ± 2.5. a. 69 ± 1. b. 57 ± 1. b. Mean values ± standard deviation. Mean values with different superscript letters in the same column represent significant differences (p < 0.05) among the samples according to ANOVA and Tukey’s multiple comparison tests.. PHBVs. Heat Flow (mW) Endo. 1 2 3 4 5 6 7 8 9 10 11 12 13 14 15 16 17 18 19 20 21 22 23 24 25 26 27 28 29 30 31 32 33 34 35 36 37 38 39 40 41 42 43 44 45 46 47 48 49 50 51 52 53 54 55 56 57 58 59 60 61 62 63 64 65. 0.1%. 0.05%. 0.05% ES. 150. 200 o. Temperature ( C). Figure 6. DSC thermograms of the first heating run of the neat PHBVs films and their CuO nanocomposites/coated systems..
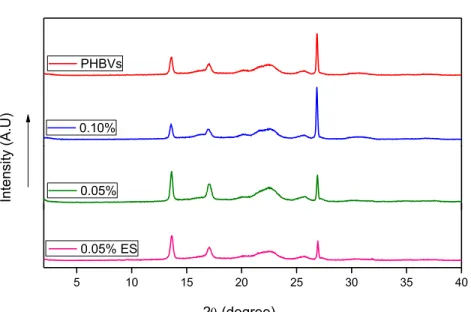
(20) In order to have a more reliable source of crystallinity information, the effect of the CuO addition and the processing type on the PHBVs crystallinity was also analyzed by WAXD (Fig. 7). The X-Ray patterns of all samples showed the typical peaks at 2Ɵ angles of 13.6°, 17.1° and 22.6°, corresponding to the (0 2 0) , (1 1 0) and (1 0 1) lattice planes of the orthorhombic unit cell of PHBV [23, 24]. A more intense peak at 2Ɵ = 26° was found and associated to the (0 2 2) reflection of boron nitride, which has been recently reported by Sanchez-Safont et al. [25] as a nucleating agent used in the commercial PHBV3 grade used as matrix. No significant differences in the diffraction peak positions were observed between the neat and the active film. This suggests that the crystal morphology of the PHBVs did not noticeably change with the CuO addition neither with the processing type. However, the lower intensity of the diffraction peaks of 0.05% coated films pointed out a lower crystallinity degree for the electrospun coating layer (also supported by the DSC results shown in the Table 3).. PHBVs. Intensity (A.U). 1 2 3 4 5 6 7 8 9 10 11 12 13 14 15 16 17 18 19 20 21 22 23 24 25 26 27 28 29 30 31 32 33 34 35 36 37 38 39 40 41 42 43 44 45 46 47 48 49 50 51 52 53 54 55 56 57 58 59 60 61 62 63 64 65. 0.10%. 0.05%. 0.05% ES 5. 10. 15. 20. 25. 30. 35. 40. 2 (degree). Figure 7. WAXD diffractograms of the neat PHBVs films and their CuO nanocomposite/coated systems.. 3.3 Mechanical properties.
(21) 1 2 3 4 5 6 7 8 9 10 11 12 13 14 15 16 17 18 19 20 21 22 23 24 25 26 27 28 29 30 31 32 33 34 35 36 37 38 39 40 41 42 43 44 45 46 47 48 49 50 51 52 53 54 55 56 57 58 59 60 61 62 63 64 65. Elastic modulus (E), elongation at break (EAB) and tensile strength (TS) were measured for the different specimens and the results are shown in Table 4. In general, mechanical properties were not significantly altered by the addition of CuO either by the melt-mixing process or by the coating methodology. The negligible impact of CuO on mechanical properties of the active films could be explained mainly by the low CuO loading and the high nanoparticles dispersion. These results were in line with the previous observations by Castro-Mayorga et al. [17, 22] and Jeong et al. [26] in which highly dispersed silver nanoparticles did not present a significant effect on PHBV melt compounded nanocomposites.. Table 4. Tensile parameters (E: Elastic modulus, EAB: Elongation at break and TS: Tensile strength and) of the neat PHBVs films and their CuO nanocomposite/coated systems. Sample. E (GPa). EAB (%). TS (MPa). PHBVs. 2.4 ± 0.0. a. 1.7 ± 0.2. a. 35.8 ± 4.0. a. 0.10%. 2.4 ± 0.1. a. 1.9 ± 0.1. a. 39.3 ± 2.6. a. 0.05%. 2.3 ± 0.1. a. 2.1 ± 0.2. a. 41.9 ± 2.5. a. 0.05% ES. 2.3 ± 0.2. a. 1.8 ± 0.2. a. 34.2 ± 4.4. a. Mean values ± standard deviation. Mean values with different superscript letters in the same column represent significant differences (p < 0.05) among the samples according to ANOVA and Tukey’s multiple comparison tests.. 3.4 Barrier properties The barrier properties are key for the application use of the materials in food packaging. The water vapour permeability (WVP) and oxygen permeability (OP) of the nanocomposite and coated systems are summarized in Table 5. As the table shows, the WVP of the obtained films increased with the addition of CuO, more especially when the fibers mats were put as an antimicrobial active coating onto PHBV3 matrix. This behavior might be related with the more hydrophilic character of the electrospun fibers mats prepared with PHBV18/CuO as compared to the neat PHBV3 film used as substrate in the coated system. In fact, Castro-Mayorga et. al [17] determined that the water uptake values of the neat PHBV18 (32.1 ± 1.2%) is significantly greater than that for the neat.
(22) 1 2 3 4 5 6 7 8 9 10 11 12 13 14 15 16 17 18 19 20 21 22 23 24 25 26 27 28 29 30 31 32 33 34 35 36 37 38 39 40 41 42 43 44 45 46 47 48 49 50 51 52 53 54 55 56 57 58 59 60 61 62 63 64 65. PHBV3 (9.8 ± 0.6%). Moreover, some authors reported on the superhydrophilic behavior of CuObased surfaces [27, 28].. Table 5. Water vapor permeability and oxygen permeability of the neat PHBVs films and their CuO nanocomposites/coating systems. Sample. 2. WVP (Kg m/ Pa. s. m ). 2. OP (m3.m/m . s .Pa) 80% RH. -15 a. 1.90 ± 0.11 e. -15 b. 1.45 ± 0.11 e. -15 bc. 1.25 ± 0.06 e. -15 c. 2.00 ± 0.14 e. PHBVs. 1.36 ± 0.17 e. 0.10%. 2.20 ± 0.31 e. 0.05%. 2.57 ± 0.07 e. 0.05% ES. 3.04 ± 0.27 e. -19 ac. -19 ab -19 b. -19 c. Mean values ± standard deviation. Mean values with different superscript letters in the same column represent significant differences (p < 0.05) among the samples according to ANOVA and Tukey’s multiple comparison tests.. The addition of 0.05% CuO to the nanocomposites reduced the OP of the PHBVs mixture by ca. 34.2 % which is more likely explained by the additional tortuous path created by the well dispersed and distributed nanoparticles. However, an increase in the CuO loading did not improve the oxygen barrier properties of the PHBVs mixture. The oxygen permeability of the coated system (0.05%ES) was higher than its counterpart prepared by melt-compounding (0.05%), which might be associated with its lower crystallinity degree.. 3.4 Antimicrobial properties. In this work, the antibacterial activity of the nanocomposites films and the coating structures containing CuO nanoparticles was explored against two food-borne pathogens: the Gram-negative Salmonella enterica and the Gram-positive Listeria monocytogenes, and the results are gathered in Table 6. As can be observed, PHBVs mixture (without CuO) did not exhibit antibacterial activity, whereas, after 24 h of exposure, a reduction of ca. 5 log CFU/mL of Salmonella enterica was recorded for those films prepared with 0.05% CuO by melt-mixing and no viable count of bacteria.
(23) 1 2 3 4 5 6 7 8 9 10 11 12 13 14 15 16 17 18 19 20 21 22 23 24 25 26 27 28 29 30 31 32 33 34 35 36 37 38 39 40 41 42 43 44 45 46 47 48 49 50 51 52 53 54 55 56 57 58 59 60 61 62 63 64 65. were recorded either for nanocomposites films containing 0.1% CuO or the 0.05% ES coating structure. Interestingly, after 24 h of exposure, no viable counts of L. monocytogenes were recorded in any of the samples. The more effective inactivation of L. monocytogenes should be attributed to structural and chemical compositional differences between cell surfaces of Gram-positive and Gram-negative bacteria [17, 29].. The virucidal activity against Murine Norovirus was also recorded in these films and reductions in the infectious titers of MNV inoculated in nanocomposites and coated structures are shown in Table 5. Accordantly to the bacterial results, coating structures seem to be more effective against Murine Norovirus than nanocomposite films. Results show that MNV titers decreased by more than 2 logs TCID50/ml when in contact with nanocomposite films containing 0.05 and 0.1 wt.% CuO while no infectious MNV were recovered when in contact with the coated structure. Therefore, it was demonstrated how by incorporating CuO into an electrospun coating form, it can be reduced the CuO loading, improve the nanoparticles dispersion and still achieve a significant bactericidal and virucidal performance. This could be of great interest for antimicrobial food packaging applications since the coating structure containing 0.05 wt.% CuO (0.05%-ES) is below the permitted migration limit (5mg Cu/Kg food) established by the current EU regulation (Commission Regulation (EU) No 10/2011 of 14 January 2011) for a hypothetical package surface 2. of 6 dm /Kg food, although there is not a specific regulation for nanoparticles.. Table 6. Antibacterial and virucidal microbial activity of the neat PHBVs films and their CuO nanocomposites/coating systems. against S. enterica, L.monocytogenes and Murine Norovirus after 24h of exposure. The detection limit were 20 CFU/mL and 1.15 TCID50/mL.. Control 0.1% 0.05% 0.05% ES. Salmonella enterica LOG CFU/mL (CFU/mL) (2.25 ± 0.79)x107 7.33 ± 0.14 ND (2.25 ± 1.42)x102 2.30 ± 0.29 ND. ND. Listeria monocytogenes R > 6.23 5.03 > 6.23. CFU/mL LOG (CFU/mL) (1.95 ± 0.8)x105 5.26 ± 0.21 ND ND ND. -. Murine Norovirus R > 4.16 > 4.16 > 4.16. TCID50/mL LOG (TCID50/mL) (5.83 ± 1.17)x105 5.95 ± 0.35 (5.13 ± 1.19)x102 2.76 ± 0.09 (1.39 ± 0.52)x104 4.12 ± 1.91 ND. ND. R 3.19 1.83 >4.81.
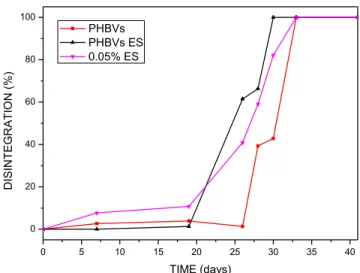
(24) 3.5 Biodegradability PHBV is known to undergo biodegradation in composting conditions within a short time, being this one of the main advantages of these materials for short time applications, such as packaging. However, in this work an antimicrobial agent has been introduced in the PHBV which may potentially interfere in its biodegradation; thus, the disintegrability of the most effective antimicrobial materials and their counterpart (without CuO) were assessed by measuring the weight loss over composting time according to the ISO 20200 standard. Figure 8 shows the evolution of the disintegration (%) over time for the PHBVs films, 0.05% ES films and bilayer PHBVs systems consisting of a PHBV3 matrix coated with electrospun PHBV18 fibers mat (PHBVs-ES) prepared for comparatives purposes.. 100. PHBVs PHBVs ES 0.05% ES. 80. DISINTEGRATION (%). 1 2 3 4 5 6 7 8 9 10 11 12 13 14 15 16 17 18 19 20 21 22 23 24 25 26 27 28 29 30 31 32 33 34 35 36 37 38 39 40 41 42 43 44 45 46 47 48 49 50 51 52 53 54 55 56 57 58 59 60 61 62 63 64 65. 60. 40. 20. 0 0. 5. 10. 15. 20. 25. 30. 35. 40. TIME (days). Figure 8. Disintegration of the blends over time under composting conditions.. Weight loss remained practically unchanged until the 19th day of composting for the three compositions studied. This induction time has been already reported for the same PHBV3 grade [25, 30]. However, there is a difference in the onset time for the PHBV depending on the surface:.
(25) 1 2 3 4 5 6 7 8 9 10 11 12 13 14 15 16 17 18 19 20 21 22 23 24 25 26 27 28 29 30 31 32 33 34 35 36 37 38 39 40 41 42 43 44 45 46 47 48 49 50 51 52 53 54 55 56 57 58 59 60 61 62 63 64 65. PHBVs-ES samples start the degradation before melt compounded PHBVs. This difference in biodegradation onset time for PHBV can be ascribed to a different accessibility of the microorganism involved in the biodegradation to the amorphous fraction in the surface of the polymer, since biodegradation takes place in the first place on the amorphous fraction. Therefore, the higher surface crystallinity of the melt compounded PHBVs sample would explain this trend. Nevertheless, once the biodegradation has started, the biodisintegration rate is similar for all the samples and the final disintegration is reached almost at the same time. Full biodegradation has occurred for all the samples in a period of 35 days. Therefore, the presence of 0.05% of CuO, although having an antimicrobial effect, did not affect the biodegradability of the final material.. 4. CONCLUSIONS Antimicrobial PHBV nanocomposites and coated structures containing CuO nanoparticles were developed and characterized. It was confirmed that the antimicrobial activity increase when the CuO is loaded into electrospun fibers mats and deposited as a coating onto PHBV3 films. For instance, the antiviral activity against of the nanocomposites vs. the coated structures, both containing 0.05% of CuO improved by more than 225%; the bacterial reduction against S. enterica by at least 23%; and no viable cells of L. monocytogenes were detected in either of them. It was furthermore demonstrated that the CuO addition by means of electrospinning enhanced the nanoparticles dispersion and did not modify significantly the oxygen permeability, mechanical or optical properties. Instead, the water vapour permeability increased due to the more hydrophilic character of the PHBV18 coating and the poor dispersion of the higher nanoparticles loading. Interestingly, biodisintegration tests showed that the coated structures were fully biodegraded in a period of 35 days at composting condition.. ACKNOWLEDGMENTS The authors would like to thank Prof. Maria Reis from Universidade Nova de Lisboa, and Dr. Catarina Oliveira, from Centro de Quimica fina e Biotecnologia, for the synthesis of PHBV18. This.
(26) 1 2 3 4 5 6 7 8 9 10 11 12 13 14 15 16 17 18 19 20 21 22 23 24 25 26 27 28 29 30 31 32 33 34 35 36 37 38 39 40 41 42 43 44 45 46 47 48 49 50 51 52 53 54 55 56 57 58 59 60 61 62 63 64 65. work was financially supported by the Spanish Ministry of Economy and Competitiveness (project AGL2015-63855-C2-1-R). J.L. Castro-Mayorga is supported by the Administrative Department of Science, Technology and Innovation (Colciencias) of Colombian Government. M. J. Fabra is recipient of a Ramon y Cajal contract from the Spanish Ministry of Economy and Competitiveness.. REFERENCES [1] M. Moritz, M. Geszke-Moritz, The newest achievements in synthesis, immobilization and practical applications of antibacterial nanoparticles, Chem. Eng. J. 228 (2013) 596-613. [2] M.S. Usman, M.E.E. Zowalaty, K. Shameli, N. Zainuddin, M. Salama, N.A. Ibrahim, Synthesis, characterization, and antimicrobial properties of copper nanoparticles, International Journal of Nanomedicine 8 (2013) 4467-4479. [3] G. Faúndez, M. Troncoso, P. Navarrete, G. Figueroa, Antimicrobial activity of copper surfaces against suspensions of Salmonella enterica and Campylobacter jejuni, BMC Microbiology 4 (2004) 19-19. [4] M. Vincent, P. Hartemann, M. Engels-Deutsch, Antimicrobial applications of copper, International Journal of Hygiene and Environmental Health 219(7, Part A) (2016) 585-591. [5] G. Grass, C. Rensing, M. Solioz, Metallic Copper as an Antimicrobial Surface, Applied and Environmental Microbiology 77(5) (2011) 1541-1547. [6] R.P. Allaker, M.A. Vargas-Reus, G.G. Ren, Nanometals as Antimicrobials, Antimicrobial Polymers2011, pp. 327-350. [7] O. Bondarenko, K. Juganson, A. Ivask, K. Kasemets, M. Mortimer, A. Kahru, Toxicity of Ag, CuO and ZnO nanoparticles to selected environmentally relevant test organisms and mammalian cells in vitro: a critical review, Arch. Toxicol. 87(7) (2013) 1181-1200. [8] P. Appendini, J.H. Hotchkiss, Review of antimicrobial food packaging, Innovative Food Science and Emerging Technologies 3(2) (2002) 113-126. [9] A. Frenot, I.S. Chronakis, Polymer nanofibers assembled by electrospinning, Current Opinion in Colloid and Interface Science 8(1-2) (2003) 64-75. [10] Y. Echegoyen, M.J. Fabra, J.L. Castro-Mayorga, A. Cherpinski, J.M. Lagaron, High throughput electro-hydrodynamic processing in food encapsulation and food packaging applications: Viewpoint, Trends in Food Science and Technology 60 (2017) 71-79. [11] D. Plackett, I. Siró, Polyhydroxyalkanoates (phas) for food packaging, Multifunctional and Nanoreinforced Polymers for Food Packaging2011, pp. 498-526. [12] M. Erceg, T. Kovačić, I. Klarić, Thermal degradation of poly(3-hydroxybutyrate) plasticized with acetyl tributyl citrate, Polym. Degrad. Stab. 90(2) (2005) 313-318. [13] E. Bugnicourt, P. Cinelli, A. Lazzeri, V. Alvarez, Polyhydroxyalkanoate (PHA): Review of synthesis, characteristics, processing and potential applications in packaging, Express Polymer Letters 8(11) (2014) 791-808. [14] A. Martínez-Abad, L. Cabedo, C.S.S. Oliveira, L. Hilliou, M. Reis, J.M. Lagarón, Characterization of polyhydroxyalkanoate blends incorporating unpurified biosustainably produced poly(3hydroxybutyrate-co-3-hydroxyvalerate, J. Appl. Polym. Sci. (2015)..
(27) 1 2 3 4 5 6 7 8 9 10 11 12 13 14 15 16 17 18 19 20 21 22 23 24 25 26 27 28 29 30 31 32 33 34 35 36 37 38 39 40 41 42 43 44 45 46 47 48 49 50 51 52 53 54 55 56 57 58 59 60 61 62 63 64 65. [15] M.J. Fabra, A. López-Rubio, J.M. Lagaron, On the use of different hydrocolloids as electrospun adhesive interlayers to enhance the barrier properties of polyhydroxyalkanoates of interest in fully renewable food packaging concepts, Food Hydrocolloids 39 (2014) 77-84. [16] F.X. Abad, R.M. Pinto, J.M. Diez, A. Bosch, Disinfection of human enteric viruses in water by copper and silver in combination with low levels of chlorine, Applied and Environmental Microbiology 60(7) (1994) 2377-2383. [17] J.L. Castro-Mayorga, M.J. Fabra, J.M. Lagaron, Stabilized nanosilver based antimicrobial poly(3-hydroxybutyrate-co-3-hydroxyvalerate) nanocomposites of interest in active food packaging, Innovative Food Science and Emerging Technologies 33 (2016) 524-533. [18] J.L. Castro-Mayorga, A. Martínez-Abad, M.J. Fabra, C. Olivera, M. Reis, J.M. Lagarón, Stabilization of antimicrobial silver nanoparticles by a polyhydroxyalkanoate obtained from mixed bacterial culture, Int. J. Biol. Macromol. 71 (2014) 103-110. [19] J.L. Castro-Mayorga, M.J. Fabra, A.M. Pourrahimi, R.T. Olsson, J.M. Lagaron, The impact of zinc oxide particle morphology as an antimicrobial and when incorporated in poly(3-hydroxybutyrateco-3-hydroxyvalerate) films for food packaging and food contact surfaces applications, Food and Bioproducts Processing 101 (2017) 32-44. [20] M. Martínez-Sanz, M. Villano, C. Oliveira, M.G.E. Albuquerque, M. Majone, M. Reis, A. LopezRubio, J.M. Lagaron, Characterization of polyhydroxyalkanoates synthesized from microbial mixed cultures and of their nanobiocomposites with bacterial cellulose nanowhiskers, New Biotechnology 31(4) (2014) 364-376. [21] J. Ambrosio-Martin, M.J. Fabra, A. López-Rubio, G. Gorrasi, A. Sorrentino, J.M. Lagaron, Assessment of Ball Milling as a Compounding Technique to Develop Nanocomposites of Poly(3Hydroxybutyrate-co-3-Hydroxyvalerate) and Bacterial Cellulose Nanowhiskers, J. Polym. Environ. 24(3) (2016) 241-254. [22] J.L. Castro-Mayorga, M.J. Fabra, L. Cabedo, J.M. Lagaron, On the use of the electrospinning coating technique to produce antimicrobial polyhydroxyalkanoate materials containing in situstabilized silver nanoparticles, Nanomaterials 7(1) (2017). [23] L.N. Carli, J.S. Crespo, R.S. Mauler, PHBV nanocomposites based on organomodified montmorillonite and halloysite: The effect of clay type on the morphology and thermal and mechanical properties, Composites Part A: Applied Science and Manufacturing 42(11) (2011) 1601-1608. [24] J. Li, C.R. Sun, X.Q. Zhang, Preparation, thermal properties, and morphology of graft copolymers in reactive blends of PHBV and PPC, Polym. Compos. 33(10) (2012) 1737-1749. [25] E.L. Sanchez-Safont, J. Gonzalez-Ausejo, J. Gamez-Perez, J.M. Lagaron, L. Cabedo, Poly(3Hydroxybutyrate-co-3-Hydroxyvalerate)/ purifi ed cellulose fiber composites by melt blending: characterization and degradation in composting conditions, Journal of Renewable Materials 4(2) (2016) 123-132. [26] S. Jeong, S. Yeo, S. Yi, The effect of filler particle size on the antibacterial properties of compounded polymer/silver fibers, Journal of Materials Science 40(20) (2005) 5407-5411. [27] Z. Qiao bao, X. Daguo, H. Tak Fu, Z. Kaili, Facile synthesis, growth mechanism and reversible superhydrophobic and superhydrophilic properties of non-flaking CuO nanowires grown from porous copper substrates, Nanotechnology 24(6) (2013) 065602. [28] G. Fan, F. Li, Effect of sodium borohydride on growth process of controlled flower-like nanostructured Cu2O/CuO films and their hydrophobic property, Chem. Eng. J. 167(1) (2011) 388396. [29] A. Grigor'Eva, I. Saranina, N. Tikunova, A. Safonov, N. Timoshenko, A. Rebrov, E. Ryabchikova, Fine mechanisms of the interaction of silver nanoparticles with the cells of Salmonella typhimurium and Staphylococcus aureus, BioMetals 26(3) (2013) 479-488..
(28) 1 2 3 4 5 6 7 8 9 10 11 12 13 14 15 16 17 18 19 20 21 22 23 24 25 26 27 28 29 30 31 32 33 34 35 36 37 38 39 40 41 42 43 44 45 46 47 48 49 50 51 52 53 54 55 56 57 58 59 60 61 62 63 64 65. [30] A. Martínez-Abad, J. González-Ausejo, J.M. Lagarón, L. Cabedo, Biodegradable poly(3hydroxybutyrate-co-3-hydroxyvalerate)/thermoplastic polyurethane blends with improved mechanical and barrier performance, Polym. Degrad. Stab. 132 (2016) 52-61..
(29)
Figure


+6

Documento similar
History, concept and methods in Microbiology. Basic characteristics of different groups of microorganisms, metabolism, microbial growth, antimicrobial agents, and genetics and
Direct current (dc) electrical conductivity measurements were performed on different single crystals of compound 4 and pellets of compounds 3 and 4. The compounds were
The models are applied to describe experimental data derived from four different commercial Pd/Al 2 O 3 and Pd/AC catalysts for the full course of reaction and to deduce the
Such treatment promotes the appearance of oxygen containing functions (hydroxyls, carboxylic acids, etc.) on the surface of the nanotube that, in turn, are vital to
The research constructed 3 portfolios based on fundamental metrics, which were Return on Assets, Return on Equity and Debt to equity and it also constructed the naïve portfolio and
Also, blends of commercial PHB and purified PHBV obtained from fruit pulp waste filled with 10 wt% rice husk flour (RHF) also showed good miscibility, increased thermal stability,
Polymer (Guildf).. 1: SEM images of the fracture surfaces of PHBV/PLA blends with diisocyanates.. 2: DSC curves of neat PHBV, PHBV/PLA and PHBV/PLA blends with a 1:20 molar ratio of
Impedance spectroscopy measurements were carried out on the fillers and mixed matrix membranes (MMM) in wet conditions (ZIFsTW and PZIFsTW) and dry conditions (ZIFsTD and PZIFsTD)
