Accepted Manuscript
Title: Serum 25-Hydroxyvitamin D and breast cancer risk by pathological subtype (MCC-Spain)
Authors: Virginia Lope, Adela Castell´o, Antonio Mena-Bravo, Pilar Amiano, Nuria Aragon´es, Tania Fern´andez-Villa,
Marcela Guevara, Trinidad Dierssen-Sotos, Guillermo Fernandez-Tard´on, Gemma Casta˜no-Vinyals, Rafael
Marcos-Gragera, V´ıctor Moreno, Dolores Salas-Trejo, Marian Diaz-Santos, Madalen Oribe, Isabel Romieu, Manolis
Kogevinas, Feliciano Priego-Capote, Beatriz P´erez-G´omez, Marina Poll´an
PII: S0960-0760(18)30132-8
DOI: https://doi.org/10.1016/j.jsbmb.2018.04.005
Reference: SBMB 5135
To appear in: Journal of Steroid Biochemistry & Molecular Biology
Received date: 2-3-2018
Accepted date: 13-4-2018
Please cite this article as: Lope V, Castell´o A, Mena-Bravo A, Amiano P, Aragon´es N, Fern´andez-Villa T, Guevara M, Dierssen-Sotos T, Fernandez-Tard´on G, Casta˜no-Vinyals G, Marcos-Gragera R, Moreno V, Salas-Trejo D, Diaz-Santos M, Oribe M, Romieu I, Kogevinas M, Priego-Capote F, P´erez-G´omez B, Poll´an M, Serum 25-Hydroxyvitamin D and breast cancer risk by pathological subtype (MCC-Spain), Journal of Steroid Biochemistry and Molecular Biology (2010), https://doi.org/10.1016/j.jsbmb.2018.04.005
This is a PDF file of an unedited manuscript that has been accepted for publication. As a service to our customers we are providing this early version of the manuscript. The manuscript will undergo copyediting, typesetting, and review of the resulting proof before it is published in its final form. Please note that during the production process errors may be discovered which could affect the content, and all legal disclaimers that apply to the journal pertain.
© 2018. This manuscript version is made available under the
CC-BY-NC-ND 4.0 license http://creativecommons.org/licenses/by-nc-nd/4.0/
Serum 25-Hydroxyvitamin D and breast cancer risk by pathological subtype (MCC-Spain).
Virginia Lopea,b, Adela Castellóa,b, Antonio Mena-Bravoc,d, Pilar Amianob,e, Nuria Aragonésb,f,
Tania Fernández-Villag,h, Marcela Guevarai, Trinidad Dierssen-Sotosb,j, Guillermo
Fernandez-Tardónk, Gemma Castaño-Vinyalsb,l,m,n, Rafael Marcos-Gragerao, Víctor Morenob,p,q, Dolores
Salas-Trejor, Marian Diaz-Santoss,t, Madalen Oribee, Isabel Romieuu,v, Manolis Kogevinasb,l,m,n,
Feliciano Priego-Capotec,d, Beatriz Pérez-Gómeza,b, Marina Pollána,b. a
National Center for Epidemiology, Carlos III Institute of Health, Madrid, Spain.
b
Consortium for Biomedical Research in Epidemiology & Public Health, CIBERESP, Madrid, Spain;
c
Department of Analytical Chemistry, University of Córdoba, Spain.
d
Maimónides Institute of Biomedical Research (IMIBIC), Reina Sofía University Hospital, University of Córdoba, Spain.
e
Public Health Division of Gipuzkoa, BioDonostia Research institute, San Sebastian, Spain
f
Epidemiology Section, Public Health Division, Department of Health of Madrid, Spain
gÁrea de Medicina Preventiva y Salud Pública, Departamento de Ciencias Biomédicas,
Universidad de León, León, Spain
hGrupo de Investigación en Interacciones Gen-Ambiente y Salud (GIIGAS), Universidad de León,
León, Spain
i
Early Detection Section, Public Health Institute of Navarra, Pamplona, Spain.
jUniversity of Cantabria – IDIVAL, Santander, Spain k
IUOPA, University of Oviedo, Oviedo, Spain
l
ISGlobal, Centre for Research in Environmental Epidemiology (CREAL), Barcelona, Spain
m
Universitat Pompeu Fabra (UPF), Barcelona, Spain
n
IMIM (Hospital del Mar Medical Research Institute), Barcelona, Spain
o
Epidemiology Unit and Girona Cancer Registry, Oncology Coordination Plan, Department of Health, Autonomous Government of Catalonia, Catalan Institute of Oncology, Girona Biomedical Research Institute (IdiBGi), Girona, Spain
p
Department of Clinical Sciences, Faculty of Medicine, University of Barcelona, Campus de Bellvitge, L'Hospitalet del Llobregat, Spain
q
Unit of Biomarkers and Susceptibility, Cancer Prevention and Control Program, Catalan Institute of Oncology (ICO), IDIBELL, L’Hospitalet de Llobregat, Spain
r
Valencia Breast Cancer Screening Program, General Directorate Public Health, Valencia, Spain
s
Universidad de Huelva, Huelva, Spain.
t
Centro de Investigación en Salud y Medio Ambiente (CYSMA), Huelva, Spain.
u
Center for Research on Population Health, National Institute of Public Health, Mexico.
v
Hubert Department of Global Health, Emory University, Atlanta, Georgia, USA.
Corresponding author:
Prof. Marina Pollán
Cancer Epidemiology Unit
National Center for Epidemiology
Carlos III Institute of Health
Avda. Monforte de Lemos, 5
28029 Madrid (Spain)
e-mail: [email protected]
Phone: +34-918222635
Fax: +34-91-3877815
Highlights
High levels of serum Vitamin D seems to protect against breast cancer risk. The protective effect seems to be stronger for triple negative tumors
No differences were observed by menopausal status, TNM staging or main risk factors Similar results were observed using cases sampled in the 1st month after diagnosis. Abstract
Epidemiologic evidence on the association between vitamin D and breast cancer is still
inconclusive. This study analyzes the association between serum 25-hydroxyvitamin D
(25(OH)D) and breast cancer risk by pathologic subtype, stage at diagnosis and specific breast
cancer risk factors. We conducted a population-based multicase-control study where 546
histologically-confirmed breast cancer cases and 558 population controls, frequently matched by
geographic area, age and body mass index, were recruited in 12 Spanish provinces (MCC-Spain).
Information was collected by a questionnaire and plasma 25(OH)D was measured by solid-phase
extraction on-line coupled to liquid chromatography–tandem mass spectrometry (SPE–LC–
MS/MS). Odds ratios and 95% confidence intervals were calculated using logistic and
multinomial mixed regression models. We found a clear protective effect between 25(OH)D
levels and breast cancer risk, with a significant dose-response trend (OR per 10 nmol/L= 0.88;
95%CI= 0.82-0.94). While no differences were observed between pre and postmenopausal
women, stage at diagnosis, or across strata of the main breast cancer risk factors, the protection
ACCEPTED MANUSCRIPT
was more pronounced for triple negative tumors (OR per 10 nmol/L= 0.64;
p-heterogeneity=0.038). Similar results were observed when only cases sampled in the first month
after diagnosis were considered. The protective effect of vitamin D on breast cancer risk may be
subtype specific, being stronger for more aggressive tumors, which provides a new approach to
prevent this disease.
Abbreviations: 25(OH)D, 25-hydroxyvitamin D; N, number of participants in each group; P25-P75, percentil 25 and percentil 75 of the mean 25(OH)D concentration.
Keywords: 25(OH)D; Vitamin D; Calcidiol; Breast neoplasm; Triple negative tumor; Stage at
diagnosis
1. Introduction
Vitamin D is known as the “sunshine” vitamin, because sun exposure is by far the main source of this nutrient in humans. Vitamin D is the precursor to the steroid hormone calcitriol (1,25-dihydroxy-vitamin D), required
to absorb and maintain calcium concentrations within the physiological range, and its deficiency causes rickets,
osteomalacia and osteoporosis [1, 2]. Inside the body, vitamin D suffers a first hydroxylation in the liver and
the serum concentration of the resulting 25-hydroxy-vitamin D (25(OH)D) is considered the main biomarker
reflecting vitamin D status. A second hydroxylation in the kidney is required to transform 25(OH)D into
calcitriol [1]. During the last decade, vitamin D has attracted a lot of attention due to its role in multiple
signaling pathways involved in proliferation, apoptosis, differentiation, inflammation, invasion, angiogenesis
and metastasis [3]. Calcitriol functions activating the vitamin D nuclear receptor (VDR) present in most cells
in the body. In this way, calcitriol regulates as much as 3-5% of the human genome [1]. In fact, multiple
laboratory studies support a role for vitamin D in retarding cancer development and progression [3].
There is no unanimous consensus on optimal levels of 25(OH)D. While the Institute of Medicine in the US
established a cutoff of 50 nmol/L (20 ng/mL) [4], the US Endocrine Society considered that concentrations
between 20-29 ng/mL indicate a relative insufficiency and set up a cutoff of 75 nmol/L (30 ng/mL) [5]. Using
this definition, it has been estimated that Vitamin D insufficiency affects almost 50% of the population
worldwide [6]. In Spain, despite favorable climatology, the levels are similar to, or even lower than, those
described for Europe. These lower levels may be owing to more skin pigmentation, sunshine-avoiding
ACCEPTED MANUSCRIPT
behavior, use of UV protection cream and air pollution with ozone and nitrogen dioxide, which reduce
sun-induced vitamin D production [7, 8].
In 2008, a review by the International Agency for Research on Cancer concluded that observational studies
regarding vitamin D and colorectal cancer give conclusive evidence of a protective effect, while studies linking
vitamin D and breast cancer were more heterogeneous [9]. Since then, different meta-analyses have been
published, generally reflecting an inverse relationship between 25(OH)D and breast cancer [10-13], more
consistent in case-control than in cohort studies. Moreover, there is little information regarding the association
of vitamin D status and breast cancer subtypes.
This paper examines the association between serum 25(OH)D and breast cancer risk, the dose-response shape
of this relationship and possible differences in this association by menopausal status, pathologic subtype and
stage at diagnosis in a subsample of untreated breast cancer cases and population-based controls from a large
case-control study in Spain (MCC-Spain).
2. Materials and Methods
2.1. Study Population
MCC-Spain is a population-based multicase-control study conducted between 2008 and 2013 in 12
geographical areas in Spain, to identify environmental factors associated with malignant tumors with high
incidence -breast cancer included- and/or presenting specific characteristics in our country
(http://www.mccspain.org). The study design has been extensively described elsewhere [14]. Briefly, the study
recruited more than 6000 patients 20-85 years old with histologically confirmed incident tumors (including
1738 breast cancer cases), and a single set of 4101 population controls (including 2038 women, 1910 suitable
as breast cancer controls). Response rates were 69% for breast cancer cases and 54% among their controls
[15]. Participants were interviewed by trained personnel using a computer-assisted program, gathering
information on sociodemographic, life-style, reproductive history, hormonal factors, medications and personal
and family medical history. Participants received a validated Food Frequency Questionnaire (FFQ) referred to
the 12 months previous to diagnosis (cases) or recruitment (controls). This questionnaire was completed at
home and mailed to recruiting centers (response rate of 89.9% for cases and 90.2 for controls). Blood samples
were collected from 76% of participants. The study was approved by the Ethics Committees of the participating
institutions and all participants signed an informed consent form.
For this study, we selected those breast cancer cases who had donated a blood sample before starting
chemotherapy, radiotherapy or hormonotherapy (546 cases). Based on pathology records, the cases were
classified into three groups, using a simplified version of the St Gallen international consensus [16]: 1) estrogen
receptor positive (ER+) and/or progesterone receptor positive (PR+) without overexpression of the human
epidermal growth factor receptor 2 (HER2), 2) HER2 positive tumors (HER2+), and 3) triple negative (ER-,
PR- and HER2-) tumors. Regarding stage at diagnosis, we considered stage I, stage II and stages III & IV. The
last two were included in a single category, due to the small number of women showing metastasis at diagnosis
(16 women).
Cases and controls were frequency matched on geographic area, age (5-year groups) and body mass index
(BMI) (5-unit groups) (n=558).
2.2. Biochemical Analyses
Details of the method for determination of 25(OH)D have been described elsewhere [17]. In brief, an on-line
arrangement of automatic solid-phase extraction–liquid chromatography–tandem mass spectrometry (SPE–
LC–MS/MS) was used, in which 200 µL of filtered serum spiked with the deuterated standards of the analytes
was introduced for cleanup–chromatographic separation as required–tandem mass spectrometry detection.
Quantitation was carried out using calibration models with the ratio between the area of the chromatographic
peak from each analyte and that of the corresponding deuterated standard.
2.3. Statistical Methods
For descriptive purposes, characteristics of cases and controls were summarized as percentages and mean
values, and compared using chi-square and t-tests. Differences in the concentration of 25(OH)D according to
these characteristics were checked out in the control population (t-test and ANOVA tests). The association
between 25(OH)D and breast cancer was studied using mixed logistic regression models, considering the
geographical area as a random effect term (included in all multivariate analyses). Four logistic models with
increasing degrees of adjustment were fitted: Model 1 only adjusted for the matching variables: age and BMI.
Model 2 adds menopausal status and the day when the sample was extracted. This variable was included using
natural splines, to take into account the non-linear variation of vitamin D levels throughout the year. Model
3a, further adjusted for educational level, ethnicity, age at first full term delivery (with a category of
nulliparous), family history of breast cancer, personal history (previous breast biopsies, hypercholesterolemia
and hormone replacement therapy (HRT) use), skin color, and physical activity in the last 5 years
(MET-ACCEPTED MANUSCRIPT
h/week). Finally, a sensitivity analysis (model 3b) was fitted further adjusting for total energy intake, calcium
and alcohol intake using cases and controls who completed the FFQ. All these models were fitted with
25(OH)D concentration (nmol/L) categorized into 5 levels, according to the quintiles in the control group, and
as a continuous variable. The shape of the dose-response relationship was investigated using natural splines
with 5 nodes at percentiles 5, 27.5, 50, 72.5 and 95.
Differences in the effect of 25(OH)D according to menopausal status and breast cancer subtype were explored
considering both a 3-category variable, based on controls’ tertiles, and the continuous variable. For menopausal
status, differences in pre- and postmenopausal women were tested including in the final model the
corresponding interaction term. For breast cancer subtypes, we fitted multinomial logistic regression models
adjusting for the same factors. Heterogeneity of effects was tested comparing the coefficients (linear effect)
obtained for the three subtypes (Wald test).
In order to know to what extent the duration and/or extension of the disease may have affected our results,
multinomial models were also used to quantify the effect of 25(OH)D according to: 1) time from diagnosis to
sample extraction in cases (<30 days, 30-60 days, >60 days or unknown) and 2) stage at diagnosis (stage I,
stage II, stages III and IV).
Finally, possible effect modifications were contrasted by including interaction terms of 25(OH)D level
(continuous) with each of the covariates in the final model. All analyses were performed using STATA/MP
14.2 software.
3. Results
We initially selected 558 breast cancer cases and 558 controls, but 12 cases where excluded because they had
initiated chemotherapy before blood extraction. Thus, the final sample cohort included 546 cases and 558
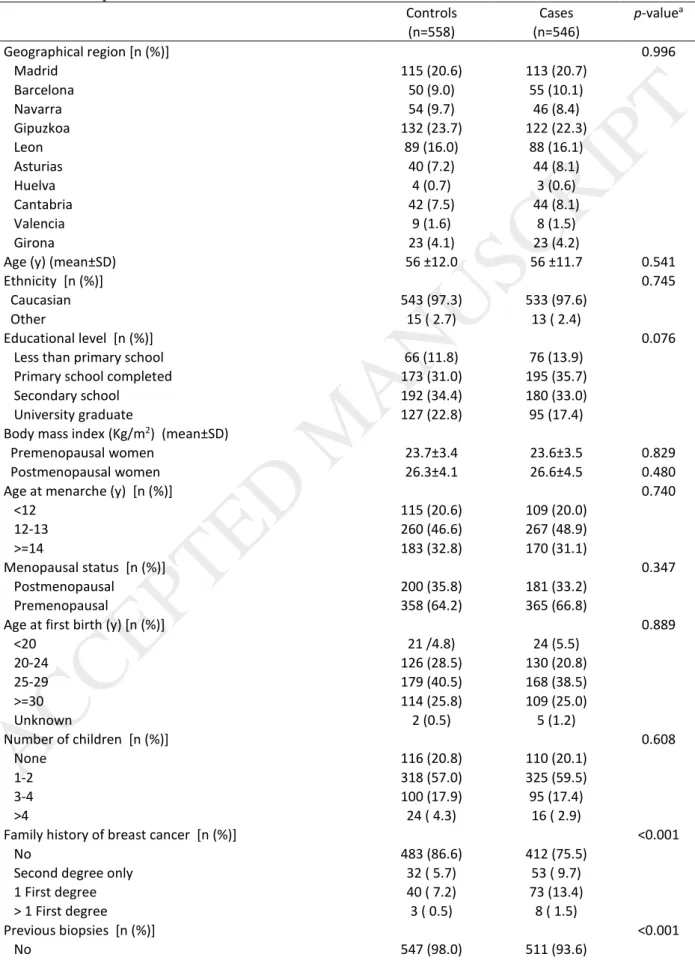
controls. Table 1 describes both groups. Their mean age was 56 years, around 2/3 were postmenopausal and
97% were Caucasian. Cases had more relatives with breast cancer and higher prevalence of previous biopsies,
while tended to be less educated and have darker skin color than controls. Cases had a lower concentration of
25(OH)D, even though the percentage of samples collected in summer and fall (seasons where Vit D
concentrations are higher) was greater in this group (Table 1).
Table 2 shows the distribution of 25(OH)D levels according to socioeconomic, reproductive and life style
characteristics in the control group. Apart from seasonal and geographical variations, the concentration of
25(OH)D decreased with age and BMI. It was lower in non-Caucasians and higher in women with
hypercholesterolemia and in those who had used HRT.
The association of 25(OH)D levels with breast cancer risk is shown in Table 3. Model 1 included, apart from
the geographical area, the other matching variables: age and BMI. Model 2 added menopausal status and day
of sample extraction. Model 3a added to Model 2 the following confounders: educational level, ethnicity, age
at first full term delivery, family history of breast cancer, previous breast biopsies, physical activity,
hypercholesterolemia, HRT use and skin color. Finally, Model 3b further adjusted for the following dietary
factors: total energy intake, calcium intake and alcohol intake to test their possible role as confounders. In all
models, a clear protective effect is seen, with ORs decreasing with increasing concentrations of 25(OH)D, with
a dose-response trend highly significant (OR per 10 nmol/L= 0.88; 95%CI= 0.82-0.94). The protective effect,
though, seems to level-off at the fourth quintile. According to the final model (model 3a), women in the two
highest quintiles had a reduction of risk over 50% (ORQ4vsQ1= 0.40; 95%CI= 0.26-0.61; ORQ5vsQ1= 0.46;
95%CI= 0.30-0.70).
This apparent level-off is explained by the shape of the dose-response curve (Figure 1), that showed a clear
and statistically significant departure from linearity (p value<0.001). Breast cancer risk clearly declined for
concentrations between 30 and 70 nmol/L, and the risk seems to increase afterwards, though it should be noted
that only 13% of controls and 10% of cases had concentrations over 70 nmol/L, and around 3% had levels
greater than 90 nmol/L. For this reason, in subsequent subgroup analyses, we used tertiles of 25(OH)D and
dose-response tests assumed a linear trend.
Table 4 presents the results in pre and postmenopausal women (top) and according to breast cancer subtypes
(medium rows) and stage at diagnosis (bottom). No clear differences were observed between pre and
postmenopausal women (p-interaction=0.597). Regarding breast cancer subtypes, ER+/PR+ tumors and
ACCEPTED MANUSCRIPT
HER2+ tumors presented similar effects (OR per 10 nmol/L= 0.89 and 0.88 respectively), but 25(OH)D
seemed to be particularly protective against triple negative tumors (OR per 10 nmol/L= 0.64;
p-heterogeneity=0.038), though this result is based on a reduced number of cases (36 breast cancer cases and
558 controls. Regarding stage at diagnosis, only 5 cases had metastasis at diagnosis, so stages III and IV were
combined in a single category. No differences in the effect of 25(OH)D were observed according to breast
cancer stage (p-heterogeneity=0.706).
Figure 2 plots the linear effect of 25(OH)D serum concentration on breast cancer risk (per 10 nmol/L) in
subgroup analyses by categories of the following variables: age, education, menarche, age at first child, family
history of breast cancer, previous biopsies, BMI, tobacco, physical activity, skin color, hypercholesterolemia,
HRT use and season. No differences were seen across strata, and all interaction p-values were greater than
0.30.
Finally, we tested whether the mean 25(OH)D levels in cases differed according to the time elapsed between
diagnosis and blood sampling. No differences were observed in 25(OH)D levels in cases sampled in the first
15 days compared to those sampled in week 3rd and 4th after diagnosis (45.89 nmol/L and 45.96 nmol/L,
p-value=0.977). However, 25(OHD) level seemed to decrease after the first month of diagnosis (25(OH)D
mean=41.75 nmol/L in women sampled in the second month; p-value=0.067; and 25(OH)D mean=40.95
nmol/L in women sampled afterwards; p-value=0.109). Owing to these differences, a sensitivity analysis was
conducted considering only breast cancer cases sampled in the first month (298 cases). The overall effect per
10 nmol/L was slightly attenuated, though no different from that obtained using the whole sample (OR=0.92;
95%CI=0.85-0.99; p-value=0.034). The corresponding OR for the second and third tertiles of 25(OH)D were
0.63 (95%CI=0.44-0.92) and 0.49 (95%CI=0.32-0.73), respectively. The heterogeneity of effects according to
breast cancer subtype was confirmed (p-heterogeneity=0.012). The OR per 10 nmol/L of 25(OH)D was 0.92
for ER+|PR+&HER2- (95%CI=0.84-1.01), 1.00 for HER2+ tumors (95%CI= 0.85-1.17) and 0.53 for triple
negative tumors (95%CI=0.36-0.78). These results are based on 205 ER+|PR cases, 43 HER2+ cases and 21
triple negative tumors (see Supplemental Material, Table S1).
4. Discussion
To our knowledge, this is the first study providing information on the association of 25(OH)D levels with
breast cancer risk by pathologic subtype in Spain. Our results show a consistent protective effect with increase
25(OH)D serum levels on breast cancer risk This effect is similar in pre and postmenopausal women, but,
interestingly enough, it seems to be stronger for triple negative tumors. Even though the non-linear shape of
the dose-response might suggest an increased risk in women at the upper extreme of the 25(OH)D range, very
few women had concentrations over 90 nmol/L.
Mean serum 25(OH) concentration in our study was similar to that reported in other European countries [18],
similar to that detected in small studies carried out in different Spanish regions [8] and slightly lower than the
concentration detected in larger Spanish studies, where the average levels fluctuated between 56 and 62 nmol/L
[19-21]. The prevalence of vitamin D deficiency (<50nmol/L) in our study (55% in controls and 69% in BC
cases) was higher than that reported among pre and post Mexican women (36%) [22], higher than the reported
at European level (40%) [18], and also higher than that reported in other Spanish studies [19-21, 23], but much
lower than that detected by Almirall et al. in 2010 [24] (80%) and Aguado et al. in 2000 [25] (87%) among
postmenopausal Spanish women.
Some meta-analyses have investigated the association between serum 25(OH)D levels and breast cancer risk
reporting controversial results. Among those focused solely on prospective studies, two detected an inverse
association only in postmenopausal women [26, 27], while the most recent reported a weak and nonsignificant
inverse association [12]. Other meta-analyses that separated analysis for case-control and prospective studies
found that the inverse association was restricted to case-control studies [11, 13]. However, Chen et al, in a
meta-analysis of 11 nested case-control and retrospective studies and 10 case-control studies, suggested that
higher blood vitamin D levels were associated with a significantly reduced risk of breast cancer [10].
The non-linear dose-response association detected in our study has been previously described by Bauer et al.
[26]. In this study, 25(OH)D levels at or above 27 ng/mL (67.5 nmol/L) threshold were associated with a 12%
lower risk of postmenopausal breast cancer per 5ng/mL increase in 25(OH)D. However, no further reductions
in risk were observed above 35 ng/mL (87.5 nmol/L). In our study, these cut-off points were left-shifted (30
ACCEPTED MANUSCRIPT
and 70 mmol/L, respectively), although it should be noted that serum 25(OH)D levels in our women were
lower than those reported in this meta-analysis.
In consonance with previous studies [28-31], women with triple negative breast cancer presented the lowest
mean 25(OH)D serum concentration and therefore, high levels of vitamin D seemed to be particularly
protective against this pathological subtype. Two previous epidemiological studies also found an inverse
association between serum 25(OH)D concentrations and triple negative breast cancer risk [32, 33].
Approximately two-thirds of these tumors express VDR [34], and it has been demonstrated that ligand bound
VDR inhibits the proliferation of triple negative breast cancer cell lines, inhibits the triple negative breast
cancer stem-like cells, induces differentiation and attenuates metastatic potential [34-36]. Moreover,
interesting studies revealed that calcitriol can stabilize DNA repair protein 53BP1 levels in tumor cells,
contributing to reduce proliferation of breast cancer with the poorest prognosis [37, 38], and can also induce
de novo E-cadherin expression by promoter demethylation in triple-negative breast cancer cells [39].
On the other hand, since calcitriol can suppress the expression of aromatase, reducing estrogen synthesis via
direct and indirect pathways [36], most studies have found an inverse association mainly in postmenopausal
women [26, 27]. Although we did not detect statistically significant differences between pre and
postmenopausal women in our study, a stronger protective effect was observed in postmenopausal women.
The major limitation of the present analysis is the possibility of reverse causation, a particular concern in
case-control studies. Since vitamin D levels were assessed after diagnosis, it may be possible that the progression of the disease or changes in patients’ lifestyle would have adversely affected 25(OH)D concentrations. In an attempt to minimize this bias a sensitivity analysis was also performed considering only breast cancer cases
sampled in the first month after diagnosis (time in which the serum 25(OH)D concentrations were not altered
in our participants), and results of this sub analysis were very similar to those obtained using the whole sample.
This one-month time window is in agreement with the serum half-life of 25(OH)D, estimated approximately
in 3 weeks [40]. Although prospective studies with serum 25(OH)D samples collected prior to diagnosis are
preferred, optimal timing of vitamin D assessment is uncertain. There is previous evidence that follow-up
periods after serum sampling should not be too long for breast cancer since it develops rapidly, concluding
ACCEPTED MANUSCRIPT
that case–control studies of breast cancer incidence provide reliable results and should be used rather than
nested case-control studies with samples taken many years before diagnosis [41, 42]. Another relevant issue is
that the pre-existing local inflammatory lesions involved in the onset of the disease could have contributed to
reducing serum 25(OH)D levels, mainly in the case of triple negative breast tumors [43]. However, there is
previous evidence that vitamin D inhibits inflammation, suggesting the reverse, that is, reduced vitamin D
levels might increase inflammation [3]. Another relevant issue in case-control studies is the potential of
selection bias. This study attempted to recruit all cases with a first diagnosis of breast cancer in the selected
health areas, ensuring that very few incident cases were missed, and general practitioner lists were used to
select controls. On the other hand, despite having adjusted for the most established risk factors, residual
confounding cannot be ruled out. However, those characteristics with a geographical distribution have been at
least partly accounted for through the random effect province term included in our statistical analyses. Finally,
we were limited by the small sample size when evaluating the association by stage at diagnosis and by
pathologic breast cancer subtype, mainly in the case of triple negative tumors whose frequency is very low in
our context [44]. Despite these limitations, to date, this is the largest epidemiological study conducted in Spain
that analyzes the association between serum 25(OH)D levels and breast cancer risk by pathological subtype or
stage at diagnosis. On the other hand, histologically confirmed cases and population controls were recruited in
12 Spanish regions located throughout the Spanish geography, which allowed us to have a broad representation
of the lifestyle and dietary habits that coexist in Spain. An important strength of our study is the use of BMI
as a matching factor, since BMI affects both vitamin D serum levels and breast cancer risk in postmenopausal
women. Finally, the LC-MS/MS method can be considered the gold standard for 25(OH)D determination,
demonstrating better performance than other automated methods [45].
5. Conclusions
Our results confirm an inverse association between 25(OH)D serum levels and breast cancer risk, which was
more pronounced in triple negative tumors. Public health and clinical strategies aimed at improving vitamin D
levels would be desirable, taking into account the high proportion of women with inadequate concentrations
of 25(OH)D.
CONFLICT OF INTEREST
The authors declare they have no actual or potential competing financial interests
ACKNOWLEDGMENTS
The study was funded by Carlos III Institute of Health grants (PI12/00488, PI12/00265, PI12/00715,
PI12/01270, PI09/00773 and PI08/1770), by the Spanish Ministry of Health (EC11-273), by the Spanish
Ministry of Economy and Competitiveness (IJCI-2014-20900) and by Consejería de Salud de la Junta de
Andalucía (PI-0571-2009) competitive calls including peer review for scientific quality. Additional funding
was provided by the Spanish Federation of Breast Cancer Patients (FECMA: EPY 1169-10), the Association
of Women with Breast Cancer from Elche (AMACMEC: EPY 1394/15), the Marqués de Valdecilla foundation
(grant API 10/09), and by Acción Transversal del Cancer, approved by the Spanish Ministry Council on
October 11, 2007. None of the funders played any role in conducting research or writing the paper.
This article presents independent research. The views expressed are those of the authors and not necessarily
those of the Carlos III Institute of Health.
REFERENCES
[1] IOM, Institute of Medicine. Dietary Reference Intakes for Calcium and Vitamin D, The National Academies Press, Washington, DC, 2011.
[2] SACN, Scientific Advisory Committee on Nutrition. Vitamin D and Health, London, 2016.
[3] D. Feldman, A.V. Krishnan, S. Swami, E. Giovannucci, B.J. Feldman, The role of vitamin D in reducing cancer risk and progression, Nat Rev Cancer, 14 (2014) 342-357.
[4] A.C. Ross, J.E. Manson, S.A. Abrams, J.F. Aloia, P.M. Brannon, S.K. Clinton, R.A. Durazo-Arvizu, J.C. Gallagher, R.L. Gallo, G. Jones, C.S. Kovacs, S.T. Mayne, C.J. Rosen, S.A. Shapses, The 2011 report on dietary reference intakes for calcium and vitamin D from the Institute of Medicine: what clinicians need to know, J Clin Endocrinol Metab, 96 (2011) 53-58.
[5] M.F. Holick, N.C. Binkley, H.A. Bischoff-Ferrari, C.M. Gordon, D.A. Hanley, R.P. Heaney, M.H. Murad, C.M. Weaver, S. Endocrine, Evaluation, treatment, and prevention of vitamin D deficiency: an Endocrine Society clinical practice guideline, J Clin Endocrinol Metab, 96 (2011) 1911-1930. [6] M.F. Holick, Vitamin D deficiency, N Engl J Med, 357 (2007) 266-281.
[7] A. Hossein-nezhad, M.F. Holick, Vitamin D for health: a global perspective, Mayo Clin Proc, 88 (2013) 720-755.
[8] C. Navarro-Valverde, J.M. Quesada-Gómez, Deficiencia de vitamina D en España. ¿Realidad o mito?, Rev Osteoporos Metab Miner, 6 (2014) S5-10.
[9] IARC, Vitamin D and Cancer. IARC Working Group Reports Vol.5, in: I.W.G.R. Vol.5 (Ed.)Lyon, 2008. [10] P. Chen, M. Li, X. Gu, Y. Liu, X. Li, C. Li, Y. Wang, D. Xie, F. Wang, C. Yu, J. Li, X. Chen, R. Chu, J. Zhu, Z. Ou, H. Wang, Higher blood 25(OH)D level may reduce the breast cancer risk: evidence from a Chinese population based case-control study and meta-analysis of the observational studies, PLoS One, 8 (2013) e49312.
[11] S. Gandini, M. Boniol, J. Haukka, G. Byrnes, B. Cox, M.J. Sneyd, P. Mullie, P. Autier, Meta-analysis of observational studies of serum 25-hydroxyvitamin D levels and colorectal, breast and prostate cancer and colorectal adenoma, Int J Cancer, 128 (2011) 1414-1424.
[12] Y. Kim, Y. Je, Vitamin D intake, blood 25(OH)D levels, and breast cancer risk or mortality: a meta-analysis, Br J Cancer, 110 (2014) 2772-2784.
[13] L. Yin, N. Grandi, E. Raum, U. Haug, V. Arndt, H. Brenner, Meta-analysis: serum vitamin D and breast cancer risk, Eur J Cancer, 46 (2010) 2196-2205.
[14] G. Castano-Vinyals, N. Aragones, B. Perez-Gomez, V. Martin, J. Llorca, V. Moreno, J.M. Altzibar, E. Ardanaz, S. de Sanjose, J.J. Jimenez-Moleon, A. Tardon, J. Alguacil, R. Peiro, R. Marcos-Gragera, C. Navarro, M. Pollan, M. Kogevinas, M.C.-S.S. Group, Population-based multicase-control study in common tumors in Spain (MCC-Spain): rationale and study design, Gac Sanit, 29 (2015) 308-315. [15] V. Lope, E. Garcia-Esquinas, B. Perez-Gomez, J.M. Altzibar, E. Gracia-Lavedan, M. Ederra, A.J.
Molina de la Torre, L.L. FJ, A. Tardon, V. Moreno, J. Bayo, D. Salas-Trejo, R. Marcos-Gragera, J. Pumarega, T. Dierssen-Sotos, J.P. Lera, M.A. de Miguel Medina, I. Tusquets, P. Amiano, E. Boldo, M. Kogevinas, N. Aragones, G. Castano-Vinyals, M. Pollan, Perinatal and childhood factors and risk of breast cancer subtypes in adulthood, Cancer Epidemiol, 40 (2016) 22-30.
[16] A. Goldhirsch, E.P. Winer, A.S. Coates, R.D. Gelber, M. Piccart-Gebhart, B. Thurlimann, H.J. Senn, m. Panel, Personalizing the treatment of women with early breast cancer: highlights of the St Gallen International Expert Consensus on the Primary Therapy of Early Breast Cancer 2013, Ann Oncol, 24 (2013) 2206-2223.
[17] A. Mena-Bravo, F. Priego-Capote, M.D. Luque de Castro, Two-dimensional liquid chromatography coupled to tandem mass spectrometry for vitamin D metabolite profiling including the C3-epimer-25-monohydroxyvitamin D3, J Chromatogr A, 1451 (2016) 50-57.
[18] K.D. Cashman, K.G. Dowling, Z. Skrabakova, M. Gonzalez-Gross, J. Valtuena, S. De Henauw, L. Moreno, C.T. Damsgaard, K.F. Michaelsen, C. Molgaard, R. Jorde, G. Grimnes, G. Moschonis, C. Mavrogianni, Y. Manios, M. Thamm, G.B. Mensink, M. Rabenberg, M.A. Busch, L. Cox, S. Meadows, G. Goldberg, A. Prentice, J.M. Dekker, G. Nijpels, S. Pilz, K.M. Swart, N.M. van Schoor, P. Lips, G. Eiriksdottir, V. Gudnason, M.F. Cotch, S. Koskinen, C. Lamberg-Allardt, R.A. Durazo-Arvizu, C.T. Sempos, M. Kiely, Vitamin D deficiency in Europe: pandemic?, Am J Clin Nutr, 103 (2016) 1033-1044.
[19] M.J. Gomez-de-Tejada Romero, M.D. Navarro Rodriguez, P. Saavedra Santana, J.M. Quesada Gomez, E. Jodar Gimeno, M. Sosa Henriquez, Prevalence of osteoporosis, vertebral fractures and hypovitaminosis D in postmenopausal women living in a rural environment, Maturitas, 77 (2014) 282-286.
[20] I. Gonzalez-Molero, S. Morcillo, S. Valdes, V. Perez-Valero, P. Botas, E. Delgado, D. Hernandez, G. Olveira, G. Rojo, C. Gutierrez-Repiso, E. Rubio-Martin, E. Menendez, F. Soriguer, Vitamin D deficiency in Spain: a population-based cohort study, Eur J Clin Nutr, 65 (2011) 321-328.
[21] J.M. Olmos, J.L. Hernandez, P. Garcia-Velasco, J. Martinez, J. Llorca, J. Gonzalez-Macias, Serum 25-hydroxyvitamin D, parathyroid hormone, calcium intake, and bone mineral density in Spanish adults, Osteoporos Int, 27 (2016) 105-113.
[22] V. Fedirko, G. Torres-Mejia, C. Ortega-Olvera, C. Biessy, A. Angeles-Llerenas, E. Lazcano-Ponce, V.A. Saldana-Quiroz, I. Romieu, Serum 25-hydroxyvitamin D and risk of breast cancer: results of a large population-based case-control study in Mexican women, Cancer Causes Control, 23 (2012) 1149-1162.
[23] J.M. Quesada-Gomez, M. Diaz-Curiel, M. Sosa-Henriquez, J. Malouf-Sierra, X. Nogues-Solan, C. Gomez-Alonso, L. Rodriguez-Manas, J.L. Neyro-Bilbao, X. Cortes, J. Delgadillo, Low calcium intake and inadequate vitamin D status in postmenopausal osteoporotic women, J Steroid Biochem Mol Biol, 136 (2013) 175-177.
[24] J. Almirall, M. Vaqueiro, M.L. Bare, E. Anton, Association of low serum 25-hydroxyvitamin D levels and high arterial blood pressure in the elderly, Nephrol Dial Transplant, 25 (2010) 503-509. [25] P. Aguado, M.T. del Campo, M.V. Garces, M.L. Gonzalez-Casaus, M. Bernad, J. Gijon-Banos, E.
Martin Mola, A. Torrijos, M.E. Martinez, Low vitamin D levels in outpatient postmenopausal women from a rheumatology clinic in Madrid, Spain: their relationship with bone mineral density, Osteoporos Int, 11 (2000) 739-744.
[26] S.R. Bauer, S.E. Hankinson, E.R. Bertone-Johnson, E.L. Ding, Plasma vitamin D levels, menopause, and risk of breast cancer: dose-response meta-analysis of prospective studies, Medicine (Baltimore), 92 (2013) 123-131.
[27] D. Wang, O.I. Velez de-la-Paz, J.X. Zhai, D.W. Liu, Serum 25-hydroxyvitamin D and breast cancer risk: a meta-analysis of prospective studies, Tumour Biol, 34 (2013) 3509-3517.
[28] L.J. Peppone, A.S. Rickles, M.C. Janelsins, M.R. Insalaco, K.A. Skinner, The association between breast cancer prognostic indicators and serum 25-OH vitamin D levels, Ann Surg Oncol, 19 (2012) 2590-2599.
[29] C. Rainville, Y. Khan, G. Tisman, Triple negative breast cancer patients presenting with low serum vitamin D levels: a case series, Cases J, 2 (2009) 8390.
[30] S. Yao, C.B. Ambrosone, Associations between vitamin D deficiency and risk of aggressive breast cancer in African-American women, J Steroid Biochem Mol Biol, 136 (2013) 337-341.
[31] S. Yao, M.L. Kwan, I.J. Ergas, J.M. Roh, T.D. Cheng, C.C. Hong, S.E. McCann, L. Tang, W. Davis, S. Liu, C.P. Quesenberry, Jr., M.M. Lee, C.B. Ambrosone, L.H. Kushi, Association of Serum Level of Vitamin D at Diagnosis With Breast Cancer Survival: A Case-Cohort Analysis in the Pathways Study, JAMA Oncol, 3 (2017) 351-357.
[32] O. Abulkhair, A. Saadeddin, O. Makram, A. Gasmelseed, T. Pasha, H. Shehata, H.M. Fakhoury, Vitamin D levels and breast cancer characteristics: Findings in patients from Saudi Arabia, J Steroid Biochem Mol Biol, 164 (2016) 106-109.
[33] S. Yao, L.E. Sucheston, A.E. Millen, C.S. Johnson, D.L. Trump, M.K. Nesline, W. Davis, C.C. Hong, S.E. McCann, H. Hwang, S. Kulkarni, S.B. Edge, T.L. O'Connor, C.B. Ambrosone, Pretreatment serum concentrations of 25-hydroxyvitamin D and breast cancer prognostic characteristics: a case-control and a case-series study, PLoS One, 6 (2011) e17251.
[34] A. Thakkar, B. Wang, M. Picon-Ruiz, P. Buchwald, T.A. Ince, Vitamin D and androgen receptor-targeted therapy for triple-negative breast cancer, Breast Cancer Res Treat, 157 (2016) 77-90. [35] N.L. Shan, J. Wahler, H.J. Lee, M.J. Bak, S.D. Gupta, H. Maehr, N. Suh, Vitamin D compounds inhibit
cancer stem-like cells and induce differentiation in triple negative breast cancer, J Steroid Biochem Mol Biol, 173 (2017) 122-129.
[36] X. Zhang, N. Harbeck, U. Jeschke, S. Doisneau-Sixou, Influence of vitamin D signaling on hormone receptor status and HER2 expression in breast cancer, J Cancer Res Clin Oncol, 143 (2017) 1107-1122.
[37] I. Gonzalez-Suarez, A.B. Redwood, D.A. Grotsky, M.A. Neumann, E.H. Cheng, C.L. Stewart, A. Dusso, S. Gonzalo, A new pathway that regulates 53BP1 stability implicates cathepsin L and vitamin D in DNA repair, EMBO J, 30 (2011) 3383-3396.
[38] S. Gonzalo, Novel roles of 1alpha,25(OH)2D3 on DNA repair provide new strategies for breast cancer treatment, J Steroid Biochem Mol Biol, 144 Pt A (2014) 59-64.
[39] N. Lopes, J. Carvalho, C. Duraes, B. Sousa, M. Gomes, J.L. Costa, C. Oliveira, J. Paredes, F. Schmitt, 1Alpha,25-dihydroxyvitamin D3 induces de novo E-cadherin expression in triple-negative breast cancer cells by CDH1-promoter demethylation, Anticancer Res, 32 (2012) 249-257.
[40] M.F. Holick, Vitamin D status: measurement, interpretation, and clinical application, Ann Epidemiol, 19 (2009) 73-78.
[41] W.B. Grant, Effect of interval between serum draw and follow-up period on relative risk of cancer incidence with respect to 25-hydroxyvitamin D level: Implications for meta-analyses and setting vitamin D guidelines, Dermatoendocrinol, 3 (2011) 199-204.
[42] W.B. Grant, 25-hydroxyvitamin D and breast cancer, colorectal cancer, and colorectal adenomas: case-control versus nested case-control studies, Anticancer Res, 35 (2015) 1153-1160.
[43] P. Autier, M. Boniol, C. Pizot, P. Mullie, Vitamin D status and ill health: a systematic review, Lancet Diabetes Endocrinol, 2 (2014) 76-89.
[44] M. Puig-Vives, M.J. Sanchez, J. Sanchez-Cantalejo, A. Torrella-Ramos, C. Martos, E. Ardanaz, M.D. Chirlaque, J. Perucha, J.M. Diaz, A. Mateos, M. Machon, R. Marcos-Gragera, Distribution and prognosis of molecular breast cancer subtypes defined by immunohistochemical biomarkers in a Spanish population-based study, Gynecol Oncol, 130 (2013) 609-614.
[45] C.J. Farrell, S. Martin, B. McWhinney, I. Straub, P. Williams, M. Herrmann, State-of-the-art vitamin D assays: a comparison of automated immunoassays with liquid chromatography-tandem mass spectrometry methods, Clin Chem, 58 (2012) 531-542.’
Figure 1. Dose-response relationship between 25-hydroxyvitamin D levels and breast cancer risk.
Abbreviations: BC. breast cancer; 25(OH)D, 25-hydroxyvitamin D.
Adjusted for age, body mass index, menopausal status, day of sample extraction, educational level, ethnicity, age at first full term delivery, family history of breast cancer, previous breast biopsies, hypercholesterolemia, hormone replacement therapy use, skin color, and physical activity in the last 5 years. Geographical area introduced as a random effect term.
Figure 2. Breast cancer risk for every 10 nmol/L increase in serum 25-hydroxyvitamin D concentration
according to women characteristics.
Abbreviations: OR(95%CI), odds ratio an 95% confidence interval; BMI, body mass index; HRT, hormone replacement therapy.
Adjusted for age, body mass index, menopausal status, day of sample extraction, educational level, ethnicity, age at first full term delivery, family history of breast cancer, previous breast biopsies, hypercholesterolemia, hormone replacement therapy use, skin color and physical activity in the last 5 years. Geographical area introduced as a random effect term.
Table 1. Descriptive characteristics of breast cancer cases and controls.
Controls Cases p-valuea
(n=558) (n=546) Geographical region [n (%)] 0.996 Madrid 115 (20.6) 113 (20.7) Barcelona 50 (9.0) 55 (10.1) Navarra 54 (9.7) 46 (8.4) Gipuzkoa 132 (23.7) 122 (22.3) Leon 89 (16.0) 88 (16.1) Asturias 40 (7.2) 44 (8.1) Huelva 4 (0.7) 3 (0.6) Cantabria 42 (7.5) 44 (8.1) Valencia 9 (1.6) 8 (1.5) Girona 23 (4.1) 23 (4.2)
Age (y) (mean±SD) 56 ±12.0 56 ±11.7 0.541
Ethnicity [n (%)] 0.745
Caucasian 543 (97.3) 533 (97.6)
Other 15 ( 2.7) 13 ( 2.4)
Educational level [n (%)] 0.076
Less than primary school 66 (11.8) 76 (13.9) Primary school completed 173 (31.0) 195 (35.7) Secondary school 192 (34.4) 180 (33.0) University graduate 127 (22.8) 95 (17.4) Body mass index (Kg/m2) (mean±SD)
Premenopausal women 23.7±3.4 23.6±3.5 0.829 Postmenopausal women 26.3±4.1 26.6±4.5 0.480
Age at menarche (y) [n (%)] 0.740
<12 115 (20.6) 109 (20.0) 12-13 260 (46.6) 267 (48.9) >=14 183 (32.8) 170 (31.1) Menopausal status [n (%)] 0.347 Postmenopausal 200 (35.8) 181 (33.2) Premenopausal 358 (64.2) 365 (66.8)
Age at first birth (y) [n (%)] 0.889
<20 21 /4.8) 24 (5.5) 20-24 126 (28.5) 130 (20.8) 25-29 179 (40.5) 168 (38.5) >=30 114 (25.8) 109 (25.0) Unknown 2 (0.5) 5 (1.2) Number of children [n (%)] 0.608 None 116 (20.8) 110 (20.1) 1-2 318 (57.0) 325 (59.5) 3-4 100 (17.9) 95 (17.4) >4 24 ( 4.3) 16 ( 2.9)
Family history of breast cancer [n (%)] <0.001
No 483 (86.6) 412 (75.5)
Second degree only 32 ( 5.7) 53 ( 9.7) 1 First degree 40 ( 7.2) 73 (13.4) > 1 First degree 3 ( 0.5) 8 ( 1.5)
Previous biopsies [n (%)] <0.001
No 547 (98.0) 511 (93.6)
Yes 11 ( 2.0) 35 ( 6.4)
Tobacco consumption [n (%)] 0.813
No 298 (53.4) 296 (54.2)
Exsmoker 116 (20.8) 118 (21.6)
Current smoker 144 (25.8) 132 (24.2)
Physical activity (MET-h/week) [n (%)] 0.201
No 214 (38.4) 237 (43.4) < 8 76 (13.6) 56 (10.3) 8-15.9 79 (14.2) 71 (13.0) >=16 189 (33.9) 182 (33.3) Skin color [n (%)] 0.094 Pale white 42 (7.5) 31 (5.7) White 240 /43.0) 239 (43.8) Light brown 189 (33.9) 208 (38.1) Dark brown 83 /14,9) 68 (12.5) Black 4 (0.2) 0 (0.0) Eye color [n (%)] 0.707 Dark brown 312 (55.9) 296 (54.2) Light brown or green 169 (30.3) 178 (32.6) Blue or gray 76 (13.6) 71 (13.0)
Unknown 1 (0.2) 1 (0.2)
Hipercolesterolemia [n (%)] 0.344
No 399 (71.5) 411 (75.3)
Yes, not treated 116 (20.8) 101 (18.5) Treated with statins 43 ( 7.7) 34 ( 6.2)
Use of corticoids [n (%)] 0.171
No 399 (71.5) 483 (88.5)
Yes 58 (10.4) 45 ( 8.2)
Unknown 32 ( 5.7) 18 ( 3.3)
Hormone replacement therapy use [n (%)] 0.892
Never 497 (89.1) 490 (89.7)
<= 5 years 43 ( 7.7) 28 (5.1)
> 5 years 11 (2.0) 10 (1.8)
Unknown 18 ( 3.2) 18 (3.3)
Alcohol consumption (g/day) [n (%)] 0.018
No 195 (34.9) 179 (32.8)
< 15 256 (45.9) 235 (43.0)
15-29.9 38 ( 6.8) 40 ( 7.3)
>=30 15 ( 2.7) 36 ( 6.6)
Unknown b 54 ( 9.7) 56 (10.3)
Total energy intake (kcals) (mean±SD) b 1766.9±552.0 1826.6±516.9 0.068
Total calcium intake (g/day) (mean±SD) b 922.7±303.3 930.5±328.5 0.698
Total vitamin D intake (µg/day) (mean±SD) b 2.5±1.2 2.6±1.4 0.045
Vitamin D (nmol/L) (mean±SD)
25-hydroxyvitamin D 48.2±19.9 43.6±22.3 <0.001 Season [n (%)] 0.010 Spring 217 (38.9) 174 (31.9) Summer 74 (13.3) 106 (19.4) Fall 109 (19.5) 120 (22.0) Winter 158 (28.3) 146 (26.7)
a p-values were computed with the chi-square test and t-test.
b Participants who did not answer the food frequency questionnaire (54 controls and 56 cases) do not
have information.
Table 2 shows the distribution of 25(OH)D levels according to socioeconomic, reproductive and life
style characteristics in the control group. Apart from seasonal and geographical variations, the
ACCEPTED MANUSCRIPT
concentration of 25(OH)D decreased with age and BMI. It was lower in non-Caucasians and higher in
women with hypercholesterolemia and in those who had used HRT.
Table 2. Variables influencing 25-hydroxyvitamin D levels. Mean levels according to baseline
characteristics in the control group.
25(OH)Da
Variable N Mean P25-P75 p-valueb
Geographical region 0.047 Madrid 115 52.48 40.90- 64.50 Barcelona 50 46.02 28.80- 57.20 Navarra 54 45.10 28.20- 61.00 Gipuzkoa 132 49.51 36.80- 59.75 Leon 89 43.27 31.30- 52.90 Asturias 40 49.24 34.25- 61.85 Huelva 4 57.05 41.80- 72.30 Cantabria 42 46.41 32.50- 57.60 Valencia 9 54.88 44.70- 69.10 Girona 23 43.31 27.10- 54.10 Age (y) 0.025 <40 35 53.86 31.10- 65.40 40-49 140 44.57 29.80- 55.35 50-59 164 49.43 36.70- 59.75 60-69 138 50.02 35.00- 63.70 >=70 81 45.20 29.60- 58.90 Ethnicity <0.001 Caucasian 543 48.60 34.40- 61.40 Other 15 26.89 20.70- 30.40 Educational level 0.882
Less than primary school 66 46.45 36.00- 58.60 Primary school completed 173 48.00 33.30- 60.00 Secondary school 192 47.99 31.30- 61.90 University graduate 127 48.90 34.50- 62.00
Body mass index (Kg/m2) 0.024
<25 295 49.39 34.00- 62.70 25-29.9 187 48.13 33.30- 59.70 >=30 76 42.44 27.15- 53.65
Age at menarche (y) 0.212
<12 115 45.35 29.30- 57.30 12-13 260 48.17 32.85- 61.00 >=14 183 49.49 34.40- 62.00 Menopausal status 0.093 Postmenopausal 358 49.08 36.50- 61.90 Premenopausal 200 46.13 29.80- 57.45
Age at first birth (y) 0.708
<20 21 44.07 25.80- 56.90 20-24 126 48.74 34.80- 60.60 25-29 179 47.70 31.90- 60.00 >=30 114 49.05 35.20- 61.90 Number of children 0.324 None 116 47.52 31.25- 62.15 1-2 318 48.56 34.00- 61.50 3-4 100 48.58 36.35- 60.70 >4 24 40.90 27.30- 54.40
Family history of breast cancer 0.742
No 483 48.26 32.80- 61.20
Second degree only 32 44.40 33.85- 56.30 1 First degree 40 48.28 30.50- 61.50 > 1 First degree 3 44.33 17.60- 63.70 Previous biopsies 0.137 No 547 47.84 32.50- 60.80 Yes 11 56.84 50.60- 73.80 Tobacco consumption 0.155 No 298 47.79 32.50- 60.60 Exsmoker 116 50.91 35.25- 63.55 Current smoker 144 46.18 32.00- 57.00
Physical activity (MET-h/week) 0.492
No 214 46.36 31.30- 58.60 < 8 76 49.08 34.60- 61.40 8-15.9 79 48.98 37.70- 61.10 >=16 189 49.06 31.90- 62.50 Skin color 0.087 Pale white 42 52.18 41.20- 61.50 White 240 46.41 31.65- 58.50 Light brown 189 48.61 34.00- 62.70 Dark brown 83 50.13 31.50- 62.50 Black 4 29.30 15.40- 43.20 Eye color 0.493 Dark brown 312 47.13 31.60- 59.75 Light brown or green 169 49.33 35.00- 61.90 Blue or gray 76 48.58 33.85- 61.20
Hipercolesterolemia 0.058
No 399 46.79 31.60- 58.70
Yes, not treated 116 51.66 37.55- 63.70 Treated with statins 43 49.55 36.80- 60.90
Use of corticoids 0.582
No 468 48.04 32.50- 61.05
Yes 58 49.57 34.50- 63.10
Hormone replacement therapy use 0.042
Never 497 47.19 31.70- 59.80
<= 5 years 32 52.27 39.15- 62.25 > 5 years 11 60.11 46.80- 70.30
Alcohol consumption (g/day) 0.407
No 195 47.63 33.20- 58.10
< 15 256 48.61 33.45- 61.20 15-29.9 38 50.84 38.90- 62.70 >=30 15 41.10 18.70- 54.50
Energy intake ( kcals) 0.263
<1385 126 48.11 30.40- 60.90 1385-1700 126 46.33 34.60- 56.60 1701-2070 126 51.00 37.60- 62.60 >2070 126 47.25 31.70- 61.00
Calcium intake (g/day) 0.080
<720 126 44.72 30.60- 57.10 720-895 126 47.55 31.80- 60.90 896-1126 126 49.91 36.50- 60.20 >1126 126 50.51 33.30- 64.70
Vitamin D intake (µg/day) 0.650
< 1.531 126 48.91 31.80- 62.70 1.531-2.420 126 47.10 31.60- 59.70 2.421-3.135 126 47.06 34.00- 58.90 > 3.135 126 49.63 35.80- 61.30 Season <0.001 Spring 217 44.48 30.00- 56.50 Summer 74 54.76 40.60- 67.30
ACCEPTED MANUSCRIPT
Fall 109 51.42 37.40- 64.20
Winter 158 47.38 31.90- 61.50
a 25(OH)D levels in nmol/L
b p-values were computed with t-test.
Table 3. Association between 25-hydroxyvitamin D levels and breast cancer risk.
Cont rols
Case
s MODEL 1 a MODEL 2 b MODEL 3a c MODEL 3b d
(n=5 58) (n=5 46) OR(95%CI ) p-valu e OR(95%CI ) p-valu e OR(95%CI ) p-valu e OR(95%CI ) p-valu e 25(OH)D (nmol/L) <=29.98 111 153 1.00 1.00 1.00 1.00 ]29.98-41.74] 112 149 0.97(0.68, 1.37) 0.76 8 0.90(0.63, 1.28) 0.56 2 0.96(0.66, 1.39) 0.81 7 0.96(0.64, 1.42) 0.82 3 ]41.74-52.70] 113 97 0.63(0.43, 0.90) 0.00 9 0.56(0.38, 0.81) 0.00 3 0.55(0.37, 0.82) 0.00 4 0.61(0.40, 0.93) 0.02 2 ]52.70-63.70] 112 68 0.44(0.30, 0.65) <0.0 01 0.39(0.26, 0.58) <0.0 01 0.40(0.26, 0.61) <0.0 01 0.41(0.26, 0.64) <0.0 01 >63.70 110 79 0.52(0.36, 0.77) 0.00 1 0.43(0.29, 0.64) <0.0 01 0.46(0.30, 0.70) <0.0 01 0.50(0.32, 0.79) 0.00 3 Trend per 10 nmol/L 0.90(0.85, 0.96) 0.00 1 0.88(0.83, 0.94) <0.0 01 0.88(0.82, 0.94) <0.0 01 0.89(0.83, 0.95) 0.00 1 Abbreviations: 25(OH)D, 25-hydroxyvitamin D; OR(95%CI), odds ratio an 95% confidence interval.
a Adjusted for age and body mass index. Geographical area introduced as a random effect term. b Additionally adjusted for menopausal status and day of sample extraction.
c Additionally adjusted for educational level, ethnicity, age at first full term delivery, family history of
breast cancer, previous breast biopsies, hypercholesterolemia, hormone replacement therapy use, skin color, and physical activity in the last 5 years.
d Additionally adjusted for total energy intake, calcium intake and alcohol intake (54 controls and 56
cases without information on diet are excluded).
Table 4. Association between 25-hydroxyvitamin D levels and breast cancer risk by menopausal status,
tumor subtype and stage at diagnosis.
MENOPAU SAL
STATUS OVERALL PREMENOPAUSAL POSTMENOPAUSAL
25(OH)D nmol/L Control s Cases OR (95% CI)a p-val ue Control s Cases OR (95% CI)a p-val ue Controls Cases OR (95% CI)a p-val ue p-int Mean (95% CI) 48.3 (45.9, 50.7) 43.2 (40.8, 45.6) 47.2 (43.6, 50.8) 42.2 (38.5, 46.0) 48.9 (46.2-51.5) 43.5 (40.9-46.1) <=37.65 184 260 1.00 80 83 1.00 104 177 1.00 ]37.65-55.2] 187 158 0.56 (0.41, 0.76) <0. 00 1 61 53 0.79 (0.46, 1.34) 0.3 74 126 105 0.44 (0.30, 0.65) <0. 00 1 >55.2 187 128 0.44 (0.31, 0.61) <0. 00 1 59 45 0.54 (0.30, 0.98) 0.0 43 128 83 0.36 (0.24, 0.54) <0. 00 1 trend per 10 nmol/L 0.88 (0.82, 0.94) <0. 00 1 0.85 (0.75, 0.97) 0.0 12 0.88 (0.80, 0.95) 0.0 01 0.5 97 TUMOR
SUBTYPEb ER+/PR+ & HER2- HER2+ TRIPLE NEGATIVE 25(OH)D nmol/L Control s Cases OR (95% CI)a p-val ue Cases OR (95% CI)a p-val ue Cases OR (95% CI)a p-val ue p-het Mean (95% CI) 48.3 (45.9, 50.7) 43.5 (40.9, 46.2) 43.2 (38.6, 47.9) 35.4 (28.6, 42.2) <=37.65 184 176 1.00 38 1.00 21 1.00 ]37.65-55.2] 187 104 0.57 (0.40, 0.80) 0.0 01 27 0.70 (0.39, 1.26) 0.2 31 11 0.46 (0.19, 1.08) 0.0 73 >55.2 187 85 0.43 (0.29, 0.63) <0. 00 1 19 0.49 (0.25, 0.97) 0.0 40 4 0.16 (0.05, 0.51) 0.0 02 trend per 10 nmol/L 0.89 (0.82, 0.96) 0.0 02 0.88 (0.77, 1.01) 0.0 71 0.64 (0.49, 0.82) <0. 00 1 0.0 38 STAGE AT
DIAGNOSISc Stage I Stage II Stage III-IV
25(OH)D nmol/L Control s Cases OR (95% CI)a p-val ue Cases OR (95% CI)a p-val ue Cases OR (95% CI)a p-val ue p-het Mean (95% CI) 48.3 (45.9, 50.7) 43.0 (39.8, 46.2) 42.5 (39.2, 45.8) 40.8 (35.2, 46.3) <=37.65 184 96 1.00 91 1.00 34 1.00 ]37.65-55.2] 187 62 0.55 (0.36, 0.84) 0.0 06 53 0.55 (0.36, 0.84) 0.0 06 10 0.31 (0.14, 0.68) 0.0 03 >55.2 187 58 0.43 (0.28, 0.68) <0. 00 1 40 0.37 (0.23, 0.59) <0. 00 1 12 0.31 (0.14, 0.89) 0.0 04 trend per 10 nmol/L 0.86 (0.78, 0.95) 0.0 02 0.85 (0.77, 0.93) 0.0 01 0.79 (0.66, 0.95) 0.0 11 0.7 06 Abbreviations: 25(OH)D, 25-hydroxyvitamin D; OR(95%CI), odds ratio an 95% confidence interval; p-int, p-value for interaction; p-het, p-value for heterogeneity; ER+/PR+ & HER2-, estrogen receptor positive and/or progesterone receptor positive tumors with human epidermal growth factor receptor 2 negative; HER2+, human epidermal growth factor receptor 2 positive tumors.
a Adjusted for age, body mass index, menopausal status, day of sample extraction, educational level,
ethnicity, age at first full term delivery, family history of breast cancer, previous breast biopsies, hypercholesterolemia, hormone replacement therapy use, skin color, and physical activity in the last 5 years. Geographical area introduced as a random effect term.
b Sixty-one breast cancer cases could not be classified. c Ninety breast cancer cases could not be classified.
Supplementary Material
Table S1. Association between 25-hydroxyvitamin D levels and breast cancer risk considering only
cases sampled in the first month after diagnosis.
MENOPAUSAL STATUS OVERALL PREMENOPAUSAL POSTMENOPAUSAL
25(OH)D nmol/L Controls Cases OR (95% CI)a p-value Controls Cases OR (95% CI)a p-value Controls Cases OR (95% CI)a p-value p-int
<=37.65 184 130 1.00 80 45 1.00 104 85 1.00
]37.65-55.2] 187 89 0.63 (0.44-0.92) 0.015 61 28 0.69 (0.36-1.31) 0.255 126 61 0.57 (0.36-0.90) 0.016 >55.2 187 79 0.49 (0.32-0.73) <0.001 59 31 0.60 (0.30-1.22) 0.156 128 48 0.41 (0.25-0.68) 0.001
trend per 10 nmol/L 0.92 (0.85-0.99) 0.034 0.89 (0.77-1.03) 0.117 0.92 (0.84-1.02) 0.107 0.597
TUMOR SUBTYPEb ER+/PR+ & HER2- HER2+ TRIPLE NEGATIVE
25(OH)D nmol/L Controls Cases OR (95% CI)a p-value Cases OR (95% CI)a p-value Cases OR (95% CI)a p-value p-het
<=37.65 184 88 1.00 17 1.00 15 1.00
]37.65-55.2] 187 63 0.68 (0.45-1.04) 0.073 12 0.70 (0.31-1.62) 0.407 5 0.23 (0.07-0.81) 0.023 >55.2 187 54 0.50 (0.31-0.79) 0.003 14 0.69 (0.29-1.65) 0.401 1 0.04 (0.00-0.36) 0.004
trend per 10 nmol/L 0.92 (0.84-1.01) 0.081 1.00 (0.85-1.17) 0.959 0.53 (0.36-0.78) 0.001 0.012 Abbreviations: 25(OH)D, 25-hydroxyvitamin D; OR(95%CI), odds ratio an 95% confidence interval;
p-int, p-value for interaction; p-het, p-value for heterogeneity; ER+/PR+ & HER2-, estrogen receptor positive and/or progesterone receptor positive tumors with human epidermal growth factor receptor 2 negative; HER2+, human epidermal growth factor receptor 2 positive tumors.
a Adjusted for age, body mass index, menopausal status, day of sample extraction, educational level,
ethnicity, age at first full term delivery, family history of breast cancer, previous breast biopsies, hypercholesterolemia, hormone replacement therapy use, skin color, and physical activity in the last 5 years. Geographical area introduced as a random effect term.
b Twenty nine breast cancer cases could not be classified.