Failure and impact behavior of facade panels made of glass fiber
reinforced cement(GRC)
A. Enfedaque , D. Cendón , F. Gálvez , V. Sánchez-Gálvez
Departamento de Ingeniería Civil: Construcción, ETSI Caminos, Canales y Puertos, Universidad Politécnica de Madrid, 28040 Madrid, Spain. Departamento de Ciencia de materiales, Universidad Politécnica de Madrid, Spain
A B S T R A C T
Keywords:
GRC
Impact behavior Gas gun
Numerical simulation
GRC is a cementitious composite material made up of a cement mortar matrix and chopped glass fibers. Due to its outstanding mechanical properties, GRC has been widely used to produce cladding panels and some civil engineering elements. Impact failure of cladding panels made of GRC may occur during production if some tool falls onto the panel, due to stone or other objects impacting at low velocities or caused by debris projected after a blast. Impact failure of a front panel of a building may have not only an important eco-nomic value but also human lives may be at risk if broken pieces of the panel fall from the building to the pavement. Therefore, knowing GRC impact strength is necessary to pre-vent economic costs and putting human lives at risk.
One-stage light gas gun is an impact test machine capable of testing different materials subjected to impact loads. An experimental program was carried out, testing GRC samples of five different formulations, commonly used in building industry. Steel spheres were shot at different velocities on square GRC samples. The residual velocity of the projectiles was obtained both using a high speed camera with multiframe exposure and measuring the projectile's penetration depth in molding clay blocks. Tests were performed on young and artificially aged GRC samples to compare GRC's behavior when subjected to high strain rates. Numerical simulations using a hydrocode were made to analyze which parameters are most important during an impact event.
GRC impact strength was obtained from test results. Also, GRC's embrittlement, caused by GRC aging, has no influence on GRC impact behavior due to the small size of the projectile. Also, glass fibers used inGRCproduction only maintain GRC panels' integrity but have no influence on GRC's impact strength. Numerical models have reproduced accurately impact tests.
1. Introduction
Glass fiber reinforced c e m e n t (GRC) is a composite material produced by mixing c e m e n t mortar and AR (Alkali Resistant) glass fibers. Cement mortar has good compressive strength, although it is a brittle material with very low tensile strength and ductility. Glass fibers enhance c e m e n t mortar's mechanical properties by improving its toughness and its flexural and tensile strength w i t h o u t decreasing its compressive strength [1].
load bearing elements, such as industrial roofs and telecommunications towers [4,5]. However, its main application has been in cladding panel production [6,7].
In modern construction industry buildings are conceived as a structure that withstand dead and live loads, and cover ele-ments that protect premises from noise, temperature and weather disturbances such as rain, snow and some others. Unfor-tunately, in the last decade impact and blast behavior of cladding panels have aroused as an essential characteristic due to the possibility of terrorist attacks, tornadoes and other high strain rate phenomena.
Concrete response to impact loading has been widely studied, both at low strain rates [8] and high strain rates [9]. How-ever, hardly any research has been carried out on cement mortar reinforced with short fibers other than steel fibers. Some work was carried out on cement mortar reinforced with natural fibers [10] and cement mortar reinforced with polyolefin fibers [11]. GRC response to dynamic loading conditions were studied using a drop impact test machine [12] and some re-search was done in Japan to find out the effect of earthquakes on GRC panels [13], but no conclusive results were found. Additionally, GRC behavior under high strain rates has never been studied before.
To investigate the performance of GRC panels subjected to ballistic impact a test program has been planned using a one-stage light gas gun. Samples were produced with five different cement mortar formulations and both young (cured in a cli-matic chamber) and aged GRC samples were tested.
2. GRC production and aging process
GRC test boards were produced by using a manual spray method which is the most widely commercial method for GRC industrial panel production. Glass fibers' volumetric fraction in panels was 5%. All test boards were storaged in a climatic chamber at 20 °C and 98% after hardening. It is widely known that GRC's mechanical properties deteriorate with time. This problem, known as material aging, leads to a reduction of tensile strength and failure strain and a dramatic decrease of mate-rial toughness. Aged GRC is a matemate-rial with very little ductility and with a tensile and flexural strength similar to cement mortar without fibers.
The embrittlement process has been studied thoroughly in the last three decades, looking for an improvement in GRC behavior although a full solution has not been found yet. Some researchers have tried to solve this problem by adding chem-ical additives to cement mortar. Silica fume [14], metakaolin [14,15], fly ash [16], and acrylic resins [17] have been the most used additions aimed to reduce the embrittlement process of GRC. Therefore, the most common additions were used in this testing program to analyze its influence on GRC performance under impact loading, especially on aged GRC. Metakaolin, sil-ica fume and acrylic resins were added to GRC while mixing cement mortar. Five different formulations of GRC were chosen GRC without additives, GRC with 10% of the cement weight of silica fume, GRC with 20% of the cement weight of silica fume, GRC with 4% of the cement weight of acrylic resins and GRC with a 10% of the cement weight of metakaolin. The components and contents used in test board production can be seen in Table 1.
To compare aged and young GRC behavior, an accelerated aging process was carried out on GRC samples. The most com-mon aging method used in GRC aging is immersion of samples in hot water. Litherland found a relation between the effect of immersion in hot water and natural exposure of GRC [18]. However, some researchers recently [19] pointed out that accel-eration factors obtained by Litherland were not correct in GRC with additions.
In any case, artificial aging by immersion in hot water at 50 °C is widely accepted as an accelerated method for reproduc-ing long-term material behavior. Previous results usreproduc-ing these formulations [20] showed that agreproduc-ing GRC for 40 days in water at 50 °C caused a major loss of GRC's mechanical properties in all GRC formulations. Also, microstructural observations using a scanning electronic microscope (SEM) have confirmed the deleterious effect of immersion in hot water in the five different GRC formulations used in this study [21]. Therefore comparison between impact test carried out in young and aged GRC samples can be considered valid.
3. Impact tests
3.1. Tests on GRC samples
Impact tests were performed on 50 x 50 mm GRC samples. Samples' thickness varied from point to point due to the man-ual production process of the test boards. Nominal thickness of samples was 10 mm, similar to that used in commercial GRC panels, although there were thickness differences between samples around 40% of their nominal thickness.
Table 1
GRC formulations. Quantities in kg.
Cement Sand Water Additions
-5 10 5 2
Plasticizer
0.5 0.5 0.5 0.5 0.5 Control
Silica fume 10% Silica fume 20% Metakaolin 10% Acrylic resins 4%
50 50 50 50 50
50 50 50 50 50
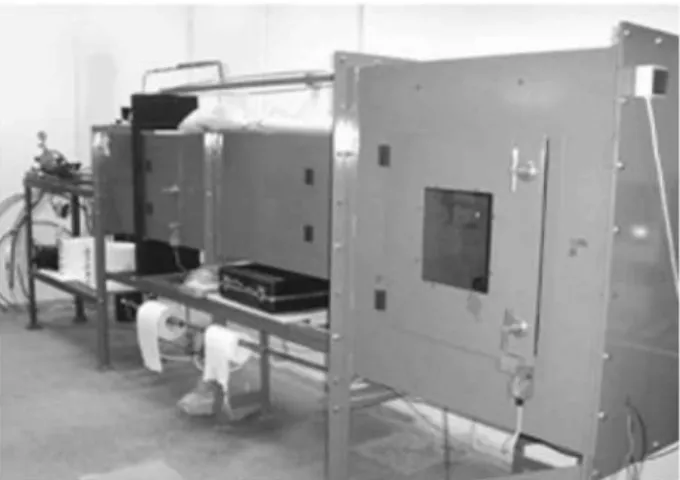
Fig. 1. One-stage light gas gun.
^elastic band
GRC sample
Projectile trajectory
Metal frame^
Support.
-GRC Sample
Side view Front view
Fig. 2. Schematic representation of GRC impact test configuration.
A picture of the one-stage light gas gun used to perform the impact tests can be seen in Fig. 1. The gas gun is divided into three different sections, the gun, the flying chamber and the test chamber. The gun is connected to a pair of bottles of dif-ferent gases at high pressure (helium and air). These gases were used to accelerate the projectile. Once the projectile has been shot, it moves through the flying chamber toward the test chamber. In the flying chamber, there is a pair of sensors, 2 m apart, connected to a computer that registers the time it takes the projectile to move between them. With the time reg-istered and the distance between the sensors, the projectile's impact velocity can be easily obtained.
Samples were placed in the test chamber on a steel support as can be seen in Fig. 2. GRC samples were placed in the sup-port frame using a pair of elastic rubber bands. These bands did not hamper GRC samples motion after the impact of the projectile.
The impact test facility is a 7.62 mm caliber gun. Five and a half mm diameter steel spheres were chosen as projectiles. Projectiles were placed in a sabot to accommodate to the barrel and increase acceleration.
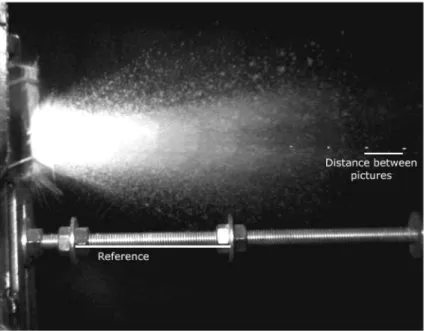
To measure the projectile's residual velocity after impact, a high speed camera with multiframe exposure system was used. An example of the pictures taken in the impact tests can be seen in Fig. 3. Using this method, residual velocities of impact events with a projectile impact speed faster than 400 m/s were obtained. However, as the projectile's impact velocity decreases, so does the projectile's residual velocity. For low impact velocities, debris from the broken samples was launched at velocities higher than the residual velocity of the sphere, and therefore it was not possible to ascertain the projectile's position after impact.
Fig. 3. High speed image of the impact event.
300
Penetration depth vs. Impact velocity
250
>
200O 3> 150
2.100
50
»
50 100 150 Penetration depth (mm)
200
Fig. 4. Penetration depth in gelatine vs. projectile impact velocity.
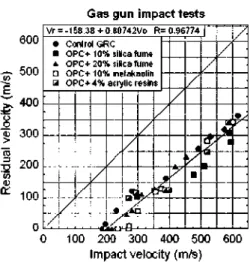
Using both methods previously described, tests on young GRC were carried out. The results obtained were plotted show-ing the relation between the impact velocity and the residual velocity of the projectile. As can be seen in Fig. 5 there are no great differences between all GRC formulations. Results obtained in these tests are scattered due to thickness differences in GRC samples. However, test results show a clear tendency towards gathering in a straight line parallel to the bisector of the figure axis.
After testing young GRC samples, artificially aged GRC samples were also tested. Samples were aged by immersion in water at 50 °C for 40 days. Sample dimensions were approximately 50 x 50 mm and 10 mm thick. Fig. 6 shows the results of impact tests.
Gas gun impact tests &
—
in bUU 500 400 inn ^nn inn nVr = -168.38+D.80742VO R= 096774 • Control GRC
• OPC+10% silica fume A OPC+20% silica fume • OPC+ 10% metakaolin B OPC+ 4% atrylic resins
| /\
¿*.J • sin '. I • I • . ¿ ¿ ^ a ^-*
*y
u/
t
• '
tt
• " >
-0 1-0-0 2-0-0 3-0-0 4-0-0 5-0-0 6-0-0 Impact velocity (m/s)
Fig. 5. Impact tests carried out on young GRC samples.
t>UU 500 400 100 200 100 0
Gas gun mpact tests
Vr=-167.63+0.B9178VO R=0.96981 • Aged Control GRC
• Aged OPC + 10% silica fume * Aged OPC+ 20% silica rume • Aged OPC+ 10% metakaolin a Aged OPC+4% acrylic resins
/ . —^
/
•¡m/
••'/
<¿iif
K*é
• *V
/ I
\J
i , ! . n • a.
-j z tV
,
/
•
• 0) tr0 100 200 300 400 500 600 Impact velocity (m/s)
Fig. 6. Impact tests carried out on aged GRC samples.
3.2. Tests on sandwich GRC samples
There are three different types of GRC panels: simple GRC panels (with joints directly placed in the panel), stud frame panels (with a metal structure attached to the GRC panel) and sandwich panels. The impact behavior of the first two types of panels has been studied in the previous section. It is interesting to fulfill the analysis by testing also sandwich samples. Sandwich panels of GRC have been widely used on building facades [7]. Sandwich panels are divided into three parts. There are two external sheets of GRC with a nominal thickness of 10 mm and between them, there is a plate of expanded polystyrene (EPS). This EPS has a variable thickness that depends on the building's requirements. To study the impact behav-ior of this type of panels, a test program was carried out on samples like the one shown in Fig. 7.
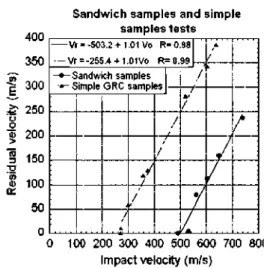
The systems described in the previous section were used to register the residual velocities. According to test results reg-istered in the previous section, tests were only carried out on GRC produced with a 10% metakaolin addition. Test results were compared with the simple panel tests obtained in the previous section. Results of both test programs can be seen in Fig. 8.
Fig. 8 clearly shows that GRC simple panels and GRC sandwich panels behave in a similar way. Test results obtained show that the ballistic limit for a sandwich panel is approximately twice that of a simple panel.
4. Discussion
GRC EPS
Dimensions on mm.
Fig. 7. Sandwich GRC samples.
400
350
300
250
200
150
100
50
0
Sandwich samples and si samples tests
mple
— Vr = -503.2 + 1.01 Vo R= 0.98 - V r = -2S54 + 1.01Vo R=0.99 - • - S a n d w i c h samples
- * - Simple GRC samples
/
y
/
/'
/
/
•/
fM.
/
r
.
/
100 200 300 400 500 600 700 300 Impact velocity (m/s)
Fig. 8. Comparison between sandwich sample and simple panel sample behavior.
Vr = V0 • K - (1)
where Vr is the residual velocity of the projectile after impact, V0 is the impact velocity of the projectile, K is the slope of
the straight line formed by the test results and a is a constant. In Figs. 5 and 6, test results showed a clear tendency to gather around a straight line parallel to the bisector of the figure axis. Therefore the slope of this line is one. Eq. (2) will be valid when K is one.
Vr = V0 - i
Thus, the amount of velocity that the target slows down is AV = V0 - Vr = V0 - {V0 - a) = a
(2)
(3)
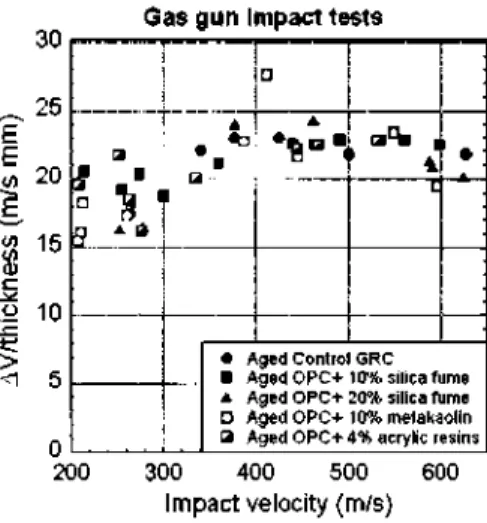
Eq. (3) shows that GRC samples always stops the projectile at a constant amount of velocity a equal to the ballistic limit of GRC samples. To compare test results a has been divided by the thickness of the sample tested. Figs. 9 and 10 show the val-ues of a/thickness for both young and aged GRC.
To obtain the failure energy of GRC samples, the kinetic energy lost by the projectile during the impact event was divided by the thickness of the tested sample and related to the impact velocity in Figs. 11 and 12.
30
Gas gun impact tests
E
i -m
•r-in
i | j
( v o r a > •n 25 20 15 1U ó Q •
; * • * A
• Control GRC • OPC+ 10% silica fqme * OPC+ 20% silica fume • OPC+10%metakaolin
a OPC+ 4% acrylic resins
200 300 400 500 600 Impact velocity (m/s)
Fig. 9. Impact tests carried out on young GRC samples.
30 « 20
1
S =-^
o 10>
<1Gas gun impact tests
p
n
s
a. : - " TÍ •
r> •
D
#
í"".
• • " • :r
.
• Aged Control GRC • Aaed OPC+ 10% silica fume
A A
• f
a f
ged OPC+ ged OPC+ ged OPC+
20% silica f 10% melaki 4% acrylic r
me olin esins
200 300 400 500 Impact velocity (m/s)
600
Fig. 10. Impact tests carried out on aged GRC samples.
14 12 E" 10 £ 3 8 </> •!••
Young GRC impact test interpretation
AE/Th = -3.5036 + 0.026572VO R= 0.99 [""
• Control GRC • OPC+10% silica fume * OPC+ 20% silica fume n OPC+10% metakaolin a OPC+4% acrylic resins
< oc is L « • A ]
«f
• . ; ;100 200 300 400 500 600 700 Impact velocity (m/s)
tí)
• • - ' •
<¡í
- 1
14
12
10
8
6
4
2
Aged GRC impact test interpretation
AE/Th = -2.8051 + 0.024911 Vo R= 0.99 • Aged Control GRC
• Aged GRC+10% silica fume A Aged QRC+ 20% silica fume • Aged GRC+10% metakaolin a Aged GRC+4% acrylic resins
s
&a ti
0 100 200 300 400 500 600 700 impact velocity (m/s)
Fig. 12. Impact tests carried out on aged GRC samples.
"¿projectile — "¿target + ¿6 ( 4 )
where A£pr0jectiie is the kinetic energy lost by the projectile, A£target is the energy that is absorbed by the target and Eb is
the energy absorbed by the support. No plastic strain was observed in the projectiles and therefore strain work in the spheres was neglected. It can be assumed that the amount of energy dissipated during the impact event by the elastic bands, the support and other elements, Eb can be neglected as compared to A£targer. in Eq. (4). Therefore, Eq. (4) can be expressed by
(5) "¿projectile — "¿target
and A£target can be split into two different parts, the energy absorbed in breaking the sample, Ef
-spent in accelerating the debris particles from the broken sample. The equation would be "¿projectile ~ "¿failure T ^^-kinetic
In Eq. (6), to determine the energy figure, it is necessary to know the energy spent in accelerating the debris. Thus Eq. (6) can be expressed as,
, and £kinetic, the energy
(6)
AE, projectile : AEh
Y.i
m'-^
(7)where Yy2m>' y2\ represents the sum of the kinetic energy of every particle of debris projected in the impact test.
How-ever, it is not feasible either to weigh every piece of debris mass, or obtain their speed after impact due to the large number of small broken particles of GRC projected.
Only when the sphere was stopped by the target can data be obtained directly from Figs. 11 and 12. When the projectile is stopped, the energy spent on projecting debris can be neglected. Eq. (7) in this case is reduced to
"¿projectile ~ "¿failure v ° /
Eq. (8) is valid for the ballistic limit in Figs. 11 and 12 for which the energy necessary to break the samples was 2J/mm. This failure energy is valid for both young and aged GRC.
To ascertain whether GRC failure energy depends on impact velocity a deeper analysis of the energy balance was needed. Eq. (7) shows the energy balance when the target does not stop the projectile. The first term of Eq. (7) can also be expressed as
AE, projectile = £o - Er (9)
where E0 is the kinetic energy of the projectile before the impact and Er is the kinetic energy of the projectile after the
impact. Eq. (9) can also be written as
AE, projectile 1 2 = 2m"vo
1
where mp is the mass of the projectile,
(10)
AE, projectile : 2mp ( ^ o " •{Vo- • a )2)
(10)
, is the impact velocity and vr is the residual velocity. If Eq. (3) is introduced into Eq.
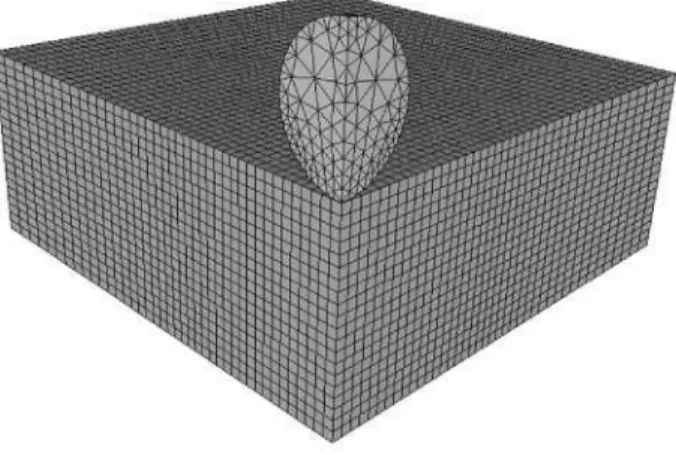
Fig. 13. Impact test numerical model.
AEprojectile = mp • (X ( V0 - - J = £faUure + ^ ^m> ' Vf 02)
And finally
¿"failure = mp • a(V0 - - ) - J ] - m ¡ • y? (13)
Eq. (13) shows that there is relation between the impact velocity and the energy absorbed by the sample. However, the energy absorbed by GRC samples cannot be determined due to the unfeasibility of measuring the mass and the velocity of every debris particle projected during the impact event.
5. Numerical simulations
A numerical simulation of impact tests was carried out to obtain the parameters that affect GRC's behavior. Numerical simulations were performed using Autodyn. Only a quarter of the samples and the steel sphere were modeled. Although thickness of GRC samples changed from one point to another, they were modeled as 10 mm thick perfect prismatic solids. Due to the large number of short fibers present in the material and their random geometrical disposition GRC was modeled by simplicity using a sandwich sketch. Layers of cement mortar were separated by glass fiber layers.
To reduce the computation time as much as possible a study was conducted on the influence of the number of elements. Model thickness was divided into 40,30,20,15 and 10 elements. These models were used in a test simulation with an impact velocity of 400 m/s. In the simulations with 40, 30 and 20 elements through thickness, similar results were obtained but with fewer elements, simulation results changed. Therefore, GRC samples were modeled with 20 solid elements in samples thick-ness. There were 20 layers of cement mortar and between each two, a layer of glass fibers. Cement mortar was represented with 8-node solid elements while glass fibers were simulated by 4-node shell elements. Shell element nodes and solid ele-ment nodes were joined to achieve a composite material behavior. The projectile was meshed using Ansys software and ex-ported to Autodyn. A sketch of the model is shown in Fig. 13. The sides of the model had no boundary conditions imposed due to the low forces applied to the samples by the elastic bands.
5.1. Material modeling
No plastic strains were observed in projectiles after the tests. Accordingly, projectiles were simulated as a rigid material with the same density as steel. Another advantage of this procedure is that the calculation time was reduced. Cement mortar was simulated using a material from Autodyn's material library called concrete-L. This is a porous material, and its behavior is determined by a density-pressure curve. A user material was implemented to simulate the glass fiber behavior. This mate-rial is linear elastic up to failure and its tensile strength has been obtained from literature [1]. The parameters used in this user material can be seen in Table 2.
In using this combination of materials there was no accurate correlation between tests results and simulations. Pressure-yield strength curves were modified to fit a 400 m/s impact test. Fig. 14 shows these variations. Good correlation between tests and simulations was found when concrete-L strength was increased by 30% from the figure in Autodyn's library.
Some other cement mortar's parameters were studied. The influence of mortar's tensile strength, fracture energy and fric-tion was studied using this model. Results obtained are shown in Figs. 15-17.
Table 2
Glass fiber user material properties.
Equation of state Linear
Reference density (kg/m3)
Bulk modulus (GPa) Strength
Failure
Principal tensile failure stress (MPa) Crack softening
Erosion Erosion strain
2680 70 Elastic Principal stress 1450 No
Geometric strain 2
Drucker-Prager Plasticity
250
£ 200
I
10050
0
#
^
< ^
>
^
""
_---
H- • - 1 0 0 % — 110% - • - 1 2 0 % - a - 1 4 0 % -fc-150 % 0.05 0.1 0.15
Pressure (GPa.)
Fig. 14. Concrete-L strength tune. 0.2
300
Influence of Concrete-L tensile strength
=5 200 > g 150
•g
05
tu
or 100
50
" <> o • II
3 3.5 4 4.5 5 5,5 6 6.5 7
Tensile strength (MPa.)
Fig. 15. Influence of cement mortar's tensile strength in a test carried out at 400 m/s.
5.2. Relation between impact tests and numerical simulations
35
34
&
< 1o ni
>
"S
=J
u m ni i r
33
3?
31
30
Influence of Concrete-L fracture energy
• • • • •
8 10 12 14 16
Fracture energy (J/m )
Fig. 16. Influence of cement mortar's fracture energy in a test carried out at 270 m/s.
32
30 f=
s-u
n
(1)
>
<T3
• a ifl (1)
ir 2Ü
2b
24
22
Influence of friction between target and projectile
i ,
— < i —
n
" « .
i i
20
0.2 0,4 0.6 0,8 1 1.2 1.4 1.6 1.8
Friction
Fig. 17. Influence of friction between target and projectile a in test carried out at 270 m/s.
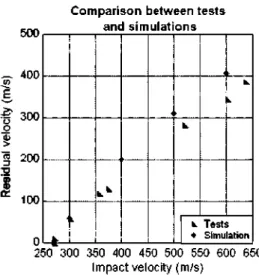
Test and simulation results were in good agreement. Numerical simulations were able to predict the projectile's residual velocity after the impact event. Some small differences were found between simulations and tests although these differences were probably caused by the differences in thickness between the actual samples and the sample modeled. These differences ranged from tenths to a few millimeters. Projectiles shot at higher velocities impacted on thinner GRC samples than those shot at velocities near the ballistic limit.
6. Conclusions
The main conclusions that can be derived from this research are:
There were no behavior differences between all GRC formulations. Impact tests showed that all GRC formulations had a similar ballistic limit. Thickness differences between samples prevent direct comparison between tests.
GRC's embrittlement had no influence on GRC impact behavior. This probably happened due to the low caliber of the pro-jectile used. The sphere's diameter was too small to break the glass fibers. A further study with higher caliber propro-jectiles should be done to confirm this hypothesis.
Comparison between tesis and simulations
- É - ^
*>
• k.
L_
1
t Tests * Simulation
500
400
|
30
°
§ 200
a)
* 100
250 300 350 400 450 500 550 600 650 Impact velocity (m/s)
Fig. 18. Comparison between tests and simulations in young GRC produced with a 10% of metakaolin addition.
Both young and aged GRC samples seem to slow down the projectile the same amount of velocity for any impact velocity. This velocity is equal to the ballistic limit. GRC samples slow down projectiles about 22 m/s per millimeter of sample thickness.
GRC samples absorb about 2J/mm when the projectile is stopped. For higher velocities GRC's failure energy might be less than 2J/mm.
A simple GRC model has been used to perform the numerical simulations. GRC has been modeled as a sandwich with glass fiber layers between layers of cement mortar. This numerical model has shown itself to be consistent with test simulations.
Acknowledgments
The authors wish to express their gratitude to SIKA S.A, to MCYT for financial support. Project BIA 2004-07336 and CON-SOLIDER INGENIO 2010.
References
[10 in [12 [13 [14 [15 [16 [17 [18 [19 [20 [21 [22
Majumdar A, Laws V. Glass fibre reinforced cement. BSP Professional Books; 1991.
Kim GB, Pilakoutas K, Waldron P. Development of thin FRP reinforced GFRC permanent form work systems. Construction and Building Materials. Kim G, Pilakoutas K, Waldron P. Thin FRP/GFRC structural elements. Cem Concr Compos 2008;30(2):122-37.
Delia Bella M, Cian D. Extra light.In: GRC sandwich elements for roofing in industrial buildings. GRC Proceedings 2003, Barcelona, Spain, 2003. Ferreira JG, Branco FA. Structural application of GRC in telecommunication towers. Constr Build Mater 2007;21(l):19-28.
Shah S, Ludirdja D, Daniel JI, Mobasher B. Toughness-durability of glass fiber reinforced concrete systems. ACI Mater J 1988;85:352-60. Correia JR Ferreira JB, Fernando A. A rehabilitation study of sandwich GRC facade panels. Constr Build Mater 2006;20(8):554-61.
Ong KCG, Basheerkhan M, Paramasivam P. Resistance of fiber concrete slabs to low velocity projectile impact. Cem Concr Compos
1999;21(5-6):391-401.
Weerheijm J, Van Doormaal JA. Tensile failure of concrete at high loading rates: new test data on strength and fracture energy from instrumented spalling tests. IntJ Impact Eng 2007;34(3):609-26.
Ramakrishna G, Sundararajan T. Impact strength of a few natural fiber reinforced cement mortar slabs: a comparative study. Cem Concr Compos 2005;27(5):547-53.
Mindess S, Wang N, Rich LD, Morgan DR. Impact resistance of polyolefin fibre reinforced precast units. Cem Concr Compos 1998;20(5):387-92. Glinicki MA, Vautrin A, Soukatchoff P, Francois-Brazier J. Plate impact testing method for GRC materials. Cem Concr Compos 1994;16(4):241-51. Fujita N, Okada H, Kobayashi T, Shiomi K. Investigation of GRC panels which were suffered from the great Hanshin earthquake. In: GRC Proceedings 1995, Dublin, Ireland, 1995.
Marikunte S, Aldea C, Shah SP. Durability of glass fiber reinforced cement composites: effect of silica fume and metakaolin. Adv Cem Based Mater
1997;5(3-4):100-8.
PurnellP, Short NR, Page CL, Majumdar AJ, Walton PL Durability of GRC made with new cementitious matrices. In: GRC Proceedings 1998, Cambridge, United Kingdom, 1998.
Zhang Y, Sun W, Shang L, Pan G. The effect of high content of fly ash on the properties of glass fiber reinforced cementitious composites. Constr Build Mater 1997;27(12):1885-91.
Ball H, Wackers M. Long term durability of naturally aged GFRC mixes containing Forton polymer. In: GRC Proceedings 2001, Dublin, Ireland, 2001. Litherland KL, Oakley DR Proctor BA. The use of accelerated ageing procedures to predict the long-term strength of GRC composites. Constr Build Mater 1981;11:455-66.
Purnell P, Beddows J. Durability and simulated ageing of new matrix glass fiber reinforced concrete. Constr Build Mater 2005;27(9-10):875-84. Enfedaque A. Resistencia a impacto de morteros de cemento reforzados con fibra de vidrio (GRC), Ph.D. Thesis, E.T.S.I. Ingenieros de Caminos, Canales y Puertos, Universidad Politécnica de Madrid, 2009.
Enfedaque A, Cendón D, Calvez F, Sánchez-Gálvez V. Analysis of glass fiber reinforced cement (GRC) fracture surfaces. Constr Build Mater
2010;24:1302-8.