The use of accessibility measures to assess efficiency and equity
effects of high speed rail projects. Application to the case of Spain
Elena López *, Andrés Monzón, Emilio Ortega, Santiago Mancebo
Abstract
The construction of a high speed rail project may both contribute to strategic transport policy goals, and at the same time it may result in negative impacts. Among them, this paper addresses the issue of the conflict between efficiency (economic) vs. equity (social) effects of high speed rail projects. If the only objective was the maximization of economic growth, the best solution would attempt to improve rail connections between major activity centres. However, this strategy would have a negative impact on equity, as it would lead to more polarized spatial development patterns.
Current transport assessment methodologies lack a common procedure to deal with this trade-off. In this context, the paper develops a spatial analysis procedure, based in the use of accessibility measures, to address these conflicting effects. On the one hand, efficiency effects are measured in terms of accessibility improvements. On the other hand, changes in the distribution of regional accessibility values are used to assess equity implications, via the calculation of a set of inequality indices.
The proposed procedure is intended to support transport planners when confronted with the task to optimize efficiency and equity objectives. The validity of the methodology is tested with its application to alternative corridor developments of the Spanish high speed network based on the 2020 scenario included in the Spanish Strategic Transport and Infrastructure Plan 2005-2020 (PEIT).
Keywords: regional cohesion, accessibility indicators, transport infrastructure planning
1. Introduction
Transport planning involves making optimal decisions on the improvement and expansion of a network system. Transport assessment methodologies have traditionally focused in the measurement and monetization of reductions in cost or travel time, which are usually dealt with in cost-benefit or multicriteria analysis. However, other objectives, such as equity, are increasingly relevant for transport planners and policy makers, encouraged by the concern to include the three objectives of transport sustainability -economic, social and environmental- in transport assessment methodologies.
Among these concerns, of particular importance is the inability of assessment methodologies to deal with the conflict of efficiency (economic) vs. equity (social) objectives. If the only objective was the maximization of economic growth, the best solution would attempt to concentrate the economic activity in several strong regional centres and interconnect them with a high quality transport network. However, this strategy would have a negative impact on equity, as it would lead to more polarized spatial development patterns (EC, 1999): richer regions would gain more and lagging regions would result in a comparative worse situation. How can assessment methodologies solve this conflict? Although this question is still on the research agenda, it is widely agreed that the design of transport strategies may need to be modified to ensure that both an acceptable degree of equity is retained, while economic growth is maximised (Button, 1993).
In this context, accessibility analysis has particular strengths as a support tool for assessment methodologies. On the one hand, accessibility measures are capable to measure the achievement of efficiency objectives, as they allow assessing network efficiency improvements (Gutiérrez and Monzón, 1998). On the other, accessibility analysis allows defining how transport and development impacts are distributed across geographical areas (Martín et al, 2004, López et al, 2008) or population groups (Talen, 1998), therefore including compatibility with equity objectives. In other words, if we translate the efficiency vs. equity conflict in terms of accessibility improvements, the conclusion is that transport planners should simultaneously combine the maximization of two objectives: the improvement of accessibility and the achievement of an equal distribution of accessibility.
Despite the above mentioned advantages of accessibility analyses, it is widely claimed that the potential of accessibility analysis for transport planning purposes such as the assessment of equity effects is not fully exploited (Halden, 2003; Geurs and Ritsema van Eck, 2003). Indeed, although the concept of accessibility has been widely reported in geographical studies, it has rarely been used for policy evaluation. Moreover, accessibility analysis has major presentational advantages by describing the impacts of transport investment in terms that people can easily understand, which is an added value given the increasing influence of public opinion on these issues. This lack of practical applications of accessibility analysis in transport appraisal methodologies is mainly due to concerns about double counting of effects, the perceived complexity of their formulations and their resulting difficulty of interpretation (Geurs and Ritsema van Eck, 2001, 2003).
proposed methodology, which is subsequently applied in section 4 to a case study: a set of 10 scenarios designed from the Spanish Strategic Transport and Infrastructure Plan 2005-2020 (PEIT). Finally, a discussion and future research directions are included in section 5.
2. Efficiency, equity and accessibility analysis
2.1. The inclusion of equity in transport assessment methodologies
Improvement of transport infrastructure leads both to a reduction of transport costs and substantial redistribution effects among social groups and region. This issue is linked with the trade-off between ‘generative vs. distributive growth’ (Rietveld and Nijkamp, 1993), ‘efficiency vs. equity’ (Bröcker et al., 2004), or ‘competitiveness vs. cohesion’ (EC, 2004) effects of transport infrastructure. The three terms distributive, equity and cohesion impacts are used as almost synonyms in the literature.
Equity motivations have provided the main justification for financing infrastructure investments in peripheral and/or landlocked regions at the EU level, as stated in different EU policy documents (see e.g. EC, 1999; EC, 2004). However, their inclusion in appraisal methodologies is uneven and scarce, as most CBA studies concentrate on efficiency considerations. However, it has been suggested that some allowance for distributional impacts should be incorporated in CBA studies (Button, 1993), or in a MCA framework complementing the CBA (Banister and Berechman, 2003).
The first difficulty in measuring equity stems from the vagueness of the definition of the term. Not even in official European Community documentation is there a precise description of what is behind equity. Moreover, it is frequent to find other related terms, such as ‘cohesion’ or ‘convergence’ in EU policy documents, which aims at the gradual reduction of regional differences (EC, 2004). This vagueness frequently gives rise to methodological problems in the evaluation stage. In broad terms, improved equity means a reduction of disparities or differences of economic and social welfare between regions (i.e. spatial equity) or groups (i.e. social equity). Effects on equity are thus distributional effects of transport policies related with the social dimension of sustainability.
In spatial policy terms, the objective is to avoid territorial imbalances by making both sector policies which have a spatial impact and regional policy more coherent (EC, 1999). The concern is also to improve ‘territorial integration’ and encourage cooperation between regions or countries. In the social equity arena, policy objectives are mostly focusing on social exclusion issues and most empirical studies have been applied at urban scales. At the project level, the social dimension generally refers to objectives such as accident reduction, noise abatement, or local emissions reduction. This approach is rather limited at the level of transport policies/plans. In general, impacts on social equity will depend on the distribution of costs and benefits between different groups of individuals (Alsnih and Hensher; 2003). The distribution among regions is usually analyzed under the ‘cohesion’ term (López et al., 2008).
proposal and therefore it is claimed that it should become an integral part of all evaluations at strategic levels (Banister and Berechman, 2003). Furthermore, it is argued that this more complex type of analysis seems to be increasingly important where there is already a high quality transport network, as the ‘conventional benefits’ may be providing an ever decreasing proportion of the total returns (Rietveld and Nijkamp, 1993). According to a proposal by Banister and Berechman (2003) this complementary analysis would include the assessment of distributional impacts: analysis of the distribution of impacts among regions and/or social groups.
2.2. The relationship between accessibility and equity
There is a wide variety of existing approaches to the concept and measurement of accessibility. Morris et al., (1979) define accessibility as “some measure of spatial separation of human activities, which denotes the ease with which activities may be reached using a particular transportation system”.
Accessibility can be seen as a proxy for measuring welfare, if we accept that the welfare of individuals is related with the ease which they can access essential services (Hay, 1993). An improved accessibility provides the individual with a wider set of opportunities in order to select that which best matches their needs and preferences. Following this rationale, accessibility can be considered an added value of a location and an important factor of quality of life (Schürmann et al., 1997), while lack of accessibility is undesirable because it is considered partly responsible for lagging economic development.
Since the first definitions of accessibility were developed in the early 50’s, there has been a continuous evolution of the theoretical foundations of accessibility indicators, resulting in a wide range of available formulations (Morris et al., 1979; Bruinsma and Rietveld, 1998; Reggiani, 1998; Geurs and van Wee, 2004). However, although the concept of accessibility has been widely reported in geographical studies, it has rarely been used for policy evaluation, and thus it has had little practical impact on policies (Handy and Niemeier, 1997). This is mainly due to concerns about double counting of effects (Beuthe, 2002), the perceived complexity of their formulations and their resulting difficulty of interpretation (Geurs and Ritsema van Eck, 2003).
Recent research has identified the role and application of robust quantitative approaches, allowing accessibility measures to take a more central role within transport appraisal (Halden, 2003; Geurs and van Wee, 2004).
In land-use/transport planning, accessibility is often considered as a means to economic activity and social cohesion, rather than a desirable good by itself (Vickerman et al., 1999). Traditionally, regional development studies have been based on the assumption that the uneven spread of development is a function of spatial inequalities in accessibility (CEC, 1996). However, the regional economic development implications of transportation improvements are highly complex and difficult to determine methodologically.
cohesion (CEC, 2004). Special interest is placed in regions with geographical handicaps characterized by problems of accessibility and integration with the rest of the EU. Infrastructure investment is thus considered a key factor in order to provide a fair distribution of accessibility to all its regions and to reduce existing disparities in accessibility between them (Schürmann et al., 1997). However, transport investment and increased cohesion do not follow a casualty relationship. Some scientists even argue, that better transport links between strong and competitive centres and economically weak peripheries may increase polarisation instead of cohesion (Hey et al., 2002; Peters, 2003; Vickerman, 1995).
2.3 The use of accessibility analysis for equity measurement
Regional development studies have traditionally been based on the assumption that the uneven spread of development is a function of spatial inequalities in accessibility (EC, 1996). Accessibility is therefore seen as an added value of a location and an important factor of quality of life (Schürmann et al., 1997), and in a sense a proxy for measuring welfare, if we accept that the welfare of individuals is related with the ease which they can access essential services (Hay, 1995). Hence, the assessment of the distributive impacts described above may be carried out using accessibility as the variable that should be equally distributed.
Early examples of the use of accessibility to assess equity impacts date back to late 1970s, such as the study by Domanski (1979), who relates the increase of accessibility to spatial concentration. This author uses accessibility as a measure to represent spatial equity, essentially by applying the potential formula to a hypothetical spatial system. Under this general approach, accessibility is often considered in regional planning as a means to economic activity and cohesion, rather than a desirable good by itself (Vickerman et al., 1999). However, the conclusions are sensitive to the conceptualization and measurement of accessibility and equity used in the analysis (Bruinsma & Rietveld, 1998; Talen, 1998).
Recent research approaches suggest analyzing distributive impacts in terms of spatial equity impacts via changes in the spatial distribution of accessibility among regions (Schürmann et al., 1997; Martín et al., 2004; Bröcker et al., 2004; López et al., 2008). Results obtained from these studies show that certain investments may lead to increasing rather than reducing regional disparities in accessibility, i.e. to a more polarized distribution of accessibility.
1998), distribution of job accessibility ( Geurs and Ritsema van Eck, 2003), or social changes (Halden, 2002; Bröcker et al., 2004).
3. Methodological approach
3.1. Structure of the methodology
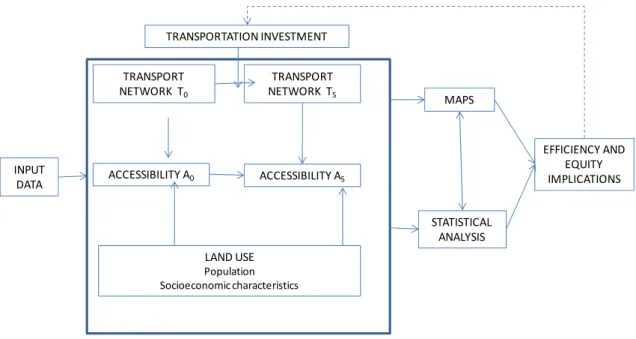
An outline of the proposed approach is included in Figure 1. The whole procedure is supported by a Geographical Information System (GIS). The starting point is the creation of the input data geodatabase, which includes both land use and transportation data. Equity effects are assessed analyzing the distribution of accessibility changes of a given transportation investment (s), when compared with that of the ‘do-nothing’ situation (0). The implementation of the transportation investment modifies the characteristics of the transport network, from T0 to Ts in the Figure. The corresponding
changes in accessibility (A) have been represented as A0 and As. Land use characteristics
are remained identical between the ‘do-nothing’ and the investment alternatives, in order to isolate the effects of the transportation investment under consideration form those derived from changes in the spatial system.
Figure 1: Outline of the methodology
Equity effects are consequently assessed from the combination of graphical and statistical analyses. First, maps are built showing the spatial distribution of accessibility benefits. Second, a set of statistical measures –inequality measures- are computed.
Maps are included in the methodology to give indications of the spatial imbalances in accessibility and the changes introduced by each infrastructure investment. Moreover, they are also included to support the interpretability of results for the non technical audience, as they constitute a useful planning tool as a starting point for discussion among planners, policy makers and potential stakeholders involved in the planning process.
Finally, and as represented by the dotted line in Figure 1, the methodology constitutes an interactive and iterative process. These conclusions in terms of efficiency and equity implications may constitute a feedback for the definition of new alternatives for the transportation investment under consideration.
3.2. The accessibility analysis
There is a wide spectrum of existing formulations which attempt to measure the concept of accessibility. Extensive reviews and existing classifications of accessibility indicators/measures can be found in Baradaran and Ramjerdi, 2001; Bruinsma and Rietveld, 1998; Gutiérrez, 2001; Handy and Niemeier, 1997; Reggiani, 1998; Geurs and Ritsema van Eck, 2001 and Geurs and van Wee, 2004).
added value is that they provide complementary information for more comprehensive analyses, as they allow testing the efficiency of both land-use patterns and transport network configurations and their interdependencies.
Each indicator has specific advantages and drawbacks, although a general observation is that there seems to be a trade-off between ‘soundness’, i.e. theoretical and empirical insights, and ‘plainness’, i.e. ease of understanding of existing formulations (Bertolini et al., 2005). Furthermore, potential improvements in the theoretical foundations of most popular indicators may imply a loss of their interpretability and therefore they are not being implemented in most practical accessibility studies (Geurs and Ritsema van Eck, 2001).
Hence, the selection of the appropriate indicator for a particular case is a complex task. Moreover, there is evidence that the formulation chosen, mainly the choice of the distance decay function, has a strong influence in the results obtained (Baradaran and Ramjerdi, 2001). In general there is no single best ‘ideal’ indicator, but it is argued that the analysis is enriched if a set of indicators is computed and their results analyzed in a complementary way (see e.g. Gutiérrez, 2001; Martín et al., 2004; Schürmann et al., 1997).
When planning infrastructure extensions to achieve improved equity, the implications of the selection of the accessibility indicator need to be discussed and consequently chosen from an agreement between planners and decision-makers. The enhanced interpretability of results deriving from equity mapping constitutes a valuable tool in order to reach this consensus.
The methodology suggests three different accessibility formulations, chosen for their proved consistency and applicability in transport planning studies at strategic levels (Schürman et al, 1997; Martín et al, 2004; López et al, 2008): the location, the potential and the network efficiency accessibility indicators. Their formulation is included below.
Location indicator
The location accessibility indicator falls under the category of ‘travel cost indicators’. The location indicator (Li) is computed as the average travel time (Iij) to the set j of destinations, using the population of each destination (Pj) as the weighting variable. The
formulation is included in Equation 1.
∑ ∑
⋅ = j j j j ij i P P I L (1)Economic potential indicator
The potential indicator falls under the category of gravity indicators. From the many formulations of potential indicators available, the one described in Equation 2 has been selected for its adequate balance between complexity and interpretability, as well as for its proven validity (Martín et al., 2004; López et al., 2008).
Network efficiency indicator
The network efficiency accessibility indicator (E) (Gutiérrez and Monzón, 1998; Gutiérrez, 2001), is computed using Equation 3.
∑ ∑
⋅ = j j j j ij ij i P P II IE (3 )
This indicator is used to calculate, for each i-j pair, a weighted mean of ratios between travel time using the network (Iij) and an ‘ideal’1 travel time (IIij). The population of each destination (Pj) has been selected as the weighting factor.
There is a wide consensus in the significant influence of how accessibility is measured on the results obtained (see e.g. Talen, 1998; Martín et al., 2004; López et al, 2008). In terms of the three indicators described above, the following remarks apply. If our purpose is to analyze equity among socioeconomic groups in the travel times they employ to reach large populations, a travel cost indicator should be used. If we want to assess the degree of equity in the distribution of the access to opportunities, accessibility should be measured with a potential indicator. If we want to eliminate the effect of the geographical location and achieve equity in the efficiency of the transport network, a network efficiency indicator is an appropriate measure.
4. Case study: High speed rail corridors in Spain
4.1. Introduction
The study is aimed at validating the methodology described in the previous section for the assessment of efficiency vs. regional equity effects of high speed rail corridors. For this purpose, a planning exercise has been carried out, in which a set of 10 possible scenarios of rail corridors has been designed. These scenarios have been designed based in the rail network infrastructure extension included in the Spanish Strategic Transport and Infrastructure Plan (PEIT) 2005-2020. Table 1 includes the set of 10 scenarios that will be assessed.
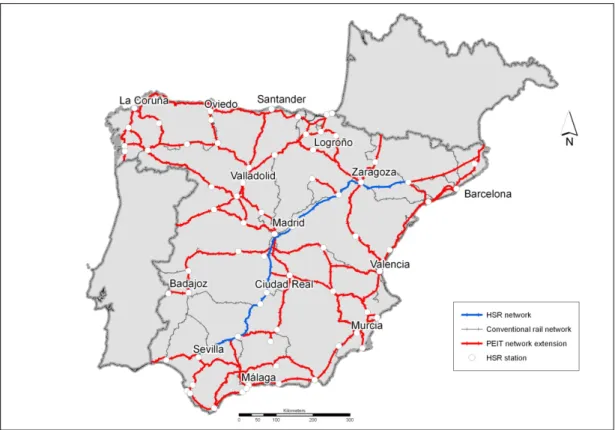
The scenarios basically include different combinations of the existence or not of two corridors: the Mediterranean corridor and the Galician corridor. They have been mapped in Figure 2. If an * is included, the corresponding corridor has a 300 km/h commercial speed, otherwise, it corresponds to a 220 km/h speed. The plus and minus signs correspond to an addition or a removal of the corresponding corridor to the do-nothing (#1) or PEIT (#10) scenarios. The PEIT scenario has been represented in Figure 3.
The rationale behind this scenario design is the assessment of the contribution that specific corridor developments has in the overall country accessibility and the equity in the resulting accessibility distribution. Additionally, the inclusion of “* scenarios” enables the measurement of the sensitivity of the results to changes in commercial speed.
1
Table 1: Definition of assessment scenarios
The assessment is carried out for the PEIT time planning horizon (2020). Following the outline included in Figure 1, this means that the rail networks of the ‘do-nothing’ alternative (0) and each of the nine ‘investment alternatives’ (s) correspond with the 2005 and each of nine (9) scenarios networks, respectively, whereas the land use characteristics of all the alternatives are identical and correspond to a prognosis for the 2020 situation.
Spain was selected as a case study for many reasons. The first is that in the Spanish mainland there exists significant disparities in the spatial distribution of accessibility and socioeconomic variables. The reduction of these differences has been in the agenda of the Spanish Ministry of Public Works in the last decades, in particular when planning the extension of the high capacity transport networks. The second is that, in order to achieve equity goals, Spain has received substantial support from European Funds for its infrastructure development in the last two decades. The result has been a progressive convergence of disparities in Spanish network endowment and of GDP per capita values with the rest of the EU.
4.2. Application of the methodology
The study area and the level of zonification for the analysis basically comprises the Spanish mainland at the NUTS-5 level and its corresponding cross-border regions in neighboring countries, which include Portugal and the three southern French NUTS-2 regions.
Accessibility values are obtained for each node of the network, which coincide with the nodes of the road network, which are nearly 12,000. The accessibility calculations were made using a network accessibility analysis GIS toolbox (Mancebo, 2006). In order to calculate accessibility values, a dense intermodal (road and rail) network was modeled with the support of a GIS; in this case the ArcGis software was used.
Accessibility values are obtained for each node of the network, which coincide with the nodes of the road network, which is nearly 12,000 km. Using interpolation techniques, aggregated NUTS-5 values in Spain, and NUTS-3 values in Portugal and France, are derived from node values.
A vectorial GIS was used, in which the network is modeled as a graph with a set of nodes and arcs. For each arc on the road network, the length, estimated speed according to the type of road (following López et al, 2008; Martín et al, 2004; Gutiérrez, 2001 and Holl, 2007 these speeds were 120 km/h for highways, 110 for expressways, 90 for interregional roads, and 80 for other roads) and resulting travel time were also recorded.
For the rail mode, each arc is given a commercial speed according to both infrastructure and quality of service characteristics. Rail network modeling tasks are significantly more complex than those of the road mode, as it is necessary to include track gauge (Iberian/UIC) data, the location of the stations and frequency of service information in order to calculate travel times, as described in López (2007).
period 2005-2020. In the accessibility calculations with origins in Spain, populations in France and Portugal have been reduced by a factor of 0.25, to take into account that destinations in neighbouring countries are visited less than national ones. The value for this reduction factor is the one used in similar studies (Gutiérrez and Monzón, 1998; Martín et al, 2004; López et al., 2008; Holl, 2007).
The population is the selected variable to measure each destination’s attractiveness in the accessibility model. The accessibility values of each origin centroid i are computed, using Equations 1, 2 and 3. Intermediate calculations include the measurement of each i-j travel time, using minimum-path algorithms embedded in the GIS.
4.3. Accessibility results
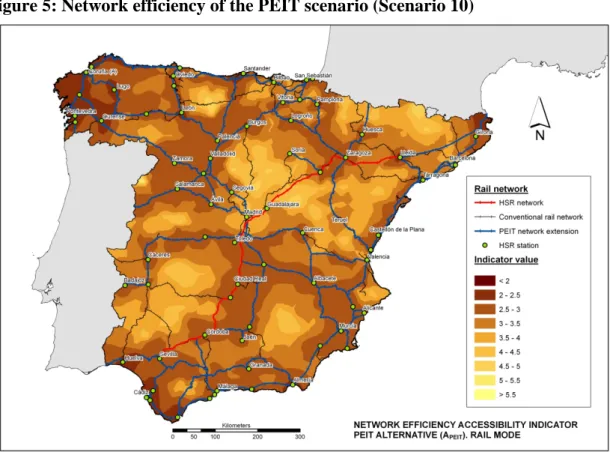
Due to lack of space reasons, the network efficiency indicator has been selected as the formulation to be represented in the accessibility maps, from the three accessibility indicators computed. In order to give an overall view of the starting situation (Scenario 1) and the PEIT Scenario (Scenario 10) in terms of network efficiency, the corresponding values have been mapped in Figure 4 and Figure 5, respectively.
Figure 4: Network efficiency of the do-nothing scenario (# 1)
It can be observed in Figure 4 that the values of the accessibility indicator a large range of variation: HSR Madrid-Sevilla and Madrid-Lleida corridors (along with those areas indirectly served by them) appear highlighted as zones with significantly higher accessibility levels than the rest of the territory. Furthermore, the good results obtained in the Mediterranean and Madrid-Valencia corridors, which enjoy efficient train services, are also highlighted. As happened with the road mode, given that the network efficiency accessibility indicator eliminates the influence of the geographic location, more accessible regions do not necessarily coincide with centraly located ones. This is the case, for example, of western Andalucía or eastern Cataluña, which despite of being located in the geographic periphery of the Iberian Peninsula, enjoy good accessibility levels.
It can also be observed that the location of the stations has a strong influence in the resulting spatial patterns of rail accessibility. On the one hand, the spatial distribution of train stations, mainly those of the HSR network, determine the presence of ‘islands’ and ‘corridors’ with better accessibility than their surroundings. On the other hand, interstitial areas within corridors suffer from the ‘tunnel effect’ (point accessibility) (Plassard, 1991; Plassard, 1992), characteristic of HSR lines, as higher accessibility points (stations) alternate with lower accessibility areas in the stretches between stations. This tunnel effect can be observed in Figure 4 in the HSR corridor Madrid-Sevilla.
Figure 5: Network efficiency of the PEIT scenario (# 10)
Aragón still appear as landlocked areas. They correspond mainly to areas which are not crossed by HSR infrastructure.
Table 2 includes the accessibility results obtained in each scenario, for each of the three accessibility formulations chosen. The accessibility value is included both in absolute terms (mean column), and in relative terms (compared with the do-nothing scenario). The inclusion of both values enables an easier comparison of the results obtained in each scenario, and the comparison of percentage change values among different accessibility indicators.
The values included in Table 2 show, as expected, that Scenarios 5 and 9 obtain the best accessibility scores, whereas the do-nothing scenario (# 1) is the one with worse accessibility performance. As expected, differences in the percentage change vary among indicators, given the different approach that each formulation has in its measurement of accessibility, as concluded in similar studies (Martín et al, 2004; López et al, 2008).
Table 2: Accessibility results by scenario
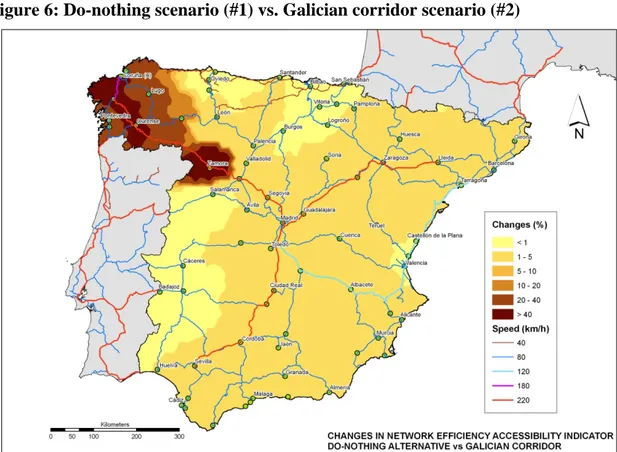
It is also interesting to analyze the results in terms of the percentage change in accessibility of each scenario, as well as the distribution of these changes. An example of this type of analysis can be made from the observation of Figures 6 to 9. They represent percentage change improvements in network efficiency between scenarios, when compared with the do-nothing scenario (# 1).
For example, the analysis of Figure 6 enables to draw conclusions on the spatial distribution of the improvements that the construction of the Galician corridor produces in terms of network efficiency. These are not homogeneusly distributed along the HSR corridor, but unevenly spread, mainly due to the also uneven distribution of the HSR stations, but also due to the existing rail connections between the Galician corridor and the other HSR links. This effect is easily shown by some examples, such as e.g. that the northern corridor or western Extremadura, which are situated relatively near the Galician corridor, receive lower accessibility improvements than other areas located further away, such as Cataluña or Andalucía.
Additionally, the differential changes produced by an increase in the Galician corridor speed-from 220 km/h to 300 km/h- can be analysed if Figure 7 and Figure 6 are compared. It can be seen how the darker areas are extended to other regions, such as e.g. the surroundings of the Segovia HSR station. Again, this extension does not follow a pattern of proximity to the HSR corridor. The above are specific characteristics of HSR links, which do not appear when High Capacity Road corridors are analyzed (López et al, 2008).
Similar analyses can be made for the Mediterranean corridor, from the values mapped in Figures 8 and 9. In this case, the comparatively better situation of the Mediterranean area enables that changes are extended to larger areas than in the Galician case. Another interesting planning exercise can be made if the difference between the PEIT and the “PEIT except” scenarios (#4 and #8) are mapped.
4.4. Analysis of equity effects
Equity effects are frequently measured in terms a set of statistical indices2 of the spatial distribution of accessibility values. (Martín et al., 2004; Bröcker et al., 2004;
2
López et al, 2008; Schürmann et al., 1997). These authors agree that there is no “ideal” inequality index and therefore suggest computing a set of them in order to analyze their results in a complementary way.
The inequality indices are computed over the sample containing the accessibility results. The sample contains near 8,000 records of accessibility values, one for each of the municipalities (NUTS-5 aggregation level) exisiting in Spain. The population of each municipality has been used as the weighting variable for the calculation of the indices. As this paper deals with the trade-off between efficiency and equity, the presentation of the results of different inequality indices would require excessive space. For this reason, from the set of indices, the coefficient of variation has been selected for the discussion in this paper. The values of the coefficient of variation of each scenario have been included in Table 3.
The choice of the accessibility indicator is foreseeable to have a strong influence on the coefficient of variation results (López et al, 2008; Martín et al, 2004). Gravity-based and cumulative opportunity indicators have been proven to result in more polarized distributions than weighted distance and network efficiency indicators (Schürmann et al., 1997; Baradaran and Ramjerdi, 2001; Martín et al., 2004). The values in Table 3 confirm this point. The different nature of the accessibility indicators is responsible for these differences: potential indicators express their results in population/income units, whereas location and efficiency indicators provide their results in terms of transport costs, introducing population/income only as a weighting factor.
In order to correctly interpret these changes, it is important to bear in mind that each of the selected accessibility indicators provide different and complementary information; therefore each one shows different spatial accessibility contrasts:
- The location indicator mainly results in marked core-periphery patterns (distorted by both the alignment of higher quality infrastructure and the location of major economic activity centers).
- The potential indicator particularly highlights contrasts between large urban agglomerations with a HSR station and remote rural areas.
- The network efficiency indicator emphasizes contrasts between major transport infrastructure corridors (HSR links) and the areas located between them (“shadow areas”).
The values of the coefficient of variation included in Table 3 confirm this point: it may happen that a reduction in accessibility differences between core and periphery areas (location indicator) correspond to an increase in differences between HSR corridors and shadow areas (network efficiency indicator), or to a more balanced distribution of accessibility between large urban agglomerations with a HSR station and remote rural areas (potential indicator).
5. Concluding remarks
The trade-off between equity and efficiency objectives is far from been translated into assessment methodologies. This paper introduces a procedure to take into account these two objectives via the calculation of a set of accessibility and equity indicators. The underlying assumption is twofold. First, that an increase in accessibility would imply a positive effect on efficiency, in the broadest meaning of the term. Second, that a convergence in accessibility levels implies an improved equity, i.e. an increase or reduction of spatial disparities in accessibility will result in a negative or a positive equity effect, respectively.
The paper has proven the importance of finding appropriate measurement tools depending on the planning objective under consideration. Accessibility indicators may have an important role to play as useful tools for this task, but significant research is still to be done before a consensus can be reached on which indicator should be used for each purpose. The case study included in this study constitutes an example of the ample variety of perspectives under which efficiency and equity effects of rail infrastructure investments can be assessed. The translation of the trade-off between both effects into the planning process requires the collaboration between decision makers and transport planners. This collaboration would extend to the remaining strategic impacts present in the evaluation of large scale transport infrastructure investments, such as Transport Master Plans (López et al, 2008; López, 2007).
The application of the suggested procedure to a set of 10 scenarios of rail network extension provides evidence from the Spanish case study, and has made it possible to identify the role played by the different factors involved in the proposed approach. One of the main conclusions obtained is that results are strongly influenced by the formulation of the accessibility indicator chosen for the analysis.
The location indicator may be very useful for policy evaluation at national or supranational levels, as it does not include a gravitational component in its formulation; therefore the relevance of long distance/strategic links is not underestimated. The potential indicator is more suited for studies with an economic orientation, although special attention has to be given to the treatment of the self-potential, which may exacerbate agglomeration effects, mainly in large cities. Results obtained with the network efficiency indicator highlight the influence of the performance of transport system, reducing the effects derived from the geographical position.
Hence, the selection of the most appropriate indicator depends on the approach of the study. If the analysis is more focused on the economic implications of equity effects, one should choose an indicator with an economic foundation, such as the potential indicator. If our interest is more inclined towards an equalisation of the transport network quality, we should choose a more infrastructure-oriented indicator, such as the network efficiency indicator.
References
Alsnih, R. and Hensher, D. A. (2003). The mobility and accessibility expectations of seniors in an aging population.
Transportation Research A, 37, 903-916.
Banister, D. and Berechman, Y. (2003). The economic development effects of transport investments. In Transport Projects, Programmes and Policies: Evaluation needs and capabilities, A. Pearman, P. Mackie, and J. Nellthorp, (Eds.), Ashgate, Aldershot.
Banister, D., Stead, D., Steen, P., Akerman, J., Dreborg, K., Nijkamp, P., and Scheicher-Tappeser, R. (2000). Targets for sustainable mobility. In European Transport Policy and Sustainable Mobility, Spon Press, London.
Baradaran, S. and Ramjerdi, F. (2001). Performance of accessibility measures in Europe. Journal of Transportation and Statistics, 4(2/3), 31-48.
Bertolini, L., le Clercq, F., and Kapoen, L. (2005). Sustainable accessibility: a conceptual framework to integrate transport and land use plan-making. Two test-applications in the Netherlands and a reflection on the way forward.
Transport Policy, 12(3), 207-220.
Beuthe, M. (2002). Transport Evaluation Methods: from Cost-benefit Analysis to Multicriteria Analysis and the Decision Framework. In Project and Policy Evaluation in Transport, L. Giorgi and A. Pearman, (Eds.), Ashgate, Aldershot.
Bröcker, J., Capello, R., Lundqvist, L., Meyer, J., Rouwendal, J., Schneekloth, N., Spairani, A., Spangenberg, M., Spiekermann, K., van Vuuren, D., Vickerman, R., and Wegener, M. (2004). Final Report of Action 2.1.1. of the European Spatial Planning Observatory Network (ESPON) 2000-2006. Christian-Albreschts-Universität Kiel, Kiel.
Bruinsma, F. R. and Rietveld, P. (1993). Urban agglomerations in European infrastructure networks. Urban Studies, 30(6), pp. 919-934.
Bruinsma, F. R. and Rietveld, P. (1998). The accessibility of European cities: theoretical framework and comparison of approaches. Environment and Planning A, 30, 499-521.
Button, K. J. (1993). Transport Economics, University Press, Cambridge.
Colorni, A., Laniado, E., and Muratori, S. (1999). Decision support systems for environmental impact assessment of transport infrastructures. Transportation Research D, 4, 1-11.
Commission of the European Communities (CEC) (1998). Communication from the Commission: Cohesion and Transport COM (1998) 806 final.
Commission of the European Communities (CEC) (2001). Unity, solidarity, diversity for Europe, its people and its territory. Second report on economic and social cohesion. Luxembourg: Office for Official Publications of the European Communities.
Commission of the European Communities (CEC) (2004). A new partnership for cohesion: convergence, competitiveness, cooperation: Third Report on Economic and Social Cohesion. Luxembourg, Office for Official Publications of the European Communities.
Cowell, F. A. (1995). Measuring inequality, Prentice-Hall, London.
Domanski, R. (1979). Accessibility, efficiency and spatial organization. Environment and Planning, 11, 1189-1206.
EC (1999). European Spatial Development Perspective (ESDP): Towards balanced and sustainable development of the territory of the European Union. Committee of Spatial Development, Luxembourg.
Faludi, A. (2002). Positioning European Spatial Planning. European Planning Studies, 10(7), pp. 897-909.
Geurs, K. and Ritsema van Eck, J. R. (2003). Evaluation of accessibility impacts of land-use scenarios: the implications of job competition, land-use, and infrastructure developments for the Netherlands. Environment and Planning B: Planning and Design, 30, 69-87.
Geurs, K. T. and van Wee, B. (2004). Accessibility evaluation of land-use and transport strategies: review and research directions. Journal of Transport Geography, 12(2), 127-140 .
Grant-Muller, S., Mackie, P., Nellthorp, J., and Pearman, A. (2001). Economic appraisal of European transport projects: the state-of-the-art revisited. Transport Reviews, 21(2), 237-261.
Gutiérrez, J. (2001). Location, economic potential and daily accessibility: an analysis of the accessibility impact of the high-speed line Madrid-Barcelona-French border. Journal of Transport Geography, 9(4), 229-242.
Gutiérrez, J. and Monzón, A. (1998). Accessibility, network efficiency, and transport infrastructure planning.
Environment and Planning A, 30, 1337-1350.
Halden, D. (2002). Using accessibility measures to integrate land use and transport policy in Edinburgh and the Lothians. Transport Policy, 9(4), 313-324.
Halden, D. (2003). Accessibility analysis: concepts and their application to transport policy, programme and project evaluation. In Transport Projects, Programmes and Policies: Evaluation needs and capabilities, A. Pearman, P. Mackie, and J. Nellthorp, (Eds.), Ashgate, Aldershot.
Handy, S. L. and Niemeier, D. A. (1997). Measuring accessibility: an exploration of issues and alternatives.
Environment and Planning A, 29, 1175-1194.
HANSEN, W. G. (1959). How accessibility shapes land use. Journal of the American Institute of Planners, 25, pp. 73-76.
HAY, A. (1993). Equity and welfare in the geography of public transport provision. Journal of Transport Geography, 1(2), pp. 95-101.
HAY, A. (1995). Concepts of equity, fairness and justice in geographical studies. Transactions of the Institute of British Geographers, New Series, 20(4), pp. 500-508.
HAYASHI, Y. and MORISUGI, H. (2000). International comparison of background concept and methodology of transportation project appraisal. Transport Policy, 7(1), pp. 73-88.
HEY, C., NIJKAMP, P., RIENSTRA, S., and ROTHENBERGER, D. (2002). Assessing Scenarios on European Transport Policies by Means of Multicriteria Analysis. In Project and Policy Evaluation in Transport, L. Giorgi and A. Pearman, (Eds.), Ashgate, Aldershot.
Liu, S. and Zhu, X. (2004). An Integrated GIS Approach to Accessibility Analysis. Transactions in GIS, 8(1), 45-62.
López, E., Gutiérrez, J. and Gómez, G. (2008): Measuring regional cohesion effects of large-scale transport infrastructure investments: an accessibility approach, European Planning Studies. Volume 16 (2), 277 – 301.
Lucas, K. (2006). Providing transport for social inclusion within a framework for environmental justice in the UK.
Transportation Research A, 40, 801-809.
MACKIE, P. and NELLTHORP, J. (2003). Transport Appraisal in a Policy Context. In Transport Projects, Programmes and Policies. Evalaution Needs and Capabilities, A. Pearman, P. Mackie, and J. Nellthorp, (Eds.), Ashgate.
Malczewski, J. (1999). GIS and multicriteria decision analysis, Wiley, New York.
Mancebo, S. (2006) AccesstUls.aml (2006-10-26)® Network accessibility analysis toolbox. Available at http://topografia.montes.upm.es/accesstuls.html.
Miller, H. J. (1999b). Potential contributions of spatial analysis to geographic information systems for transportation (GIS-T). Geographical Analysis, 31, 373-399.
MONZÓN, A., GUTIÉRREZ, J., LÓPEZ, E., MADRIGAL, E., and GÓMEZ, G. (2005). Infraestructuras de transporte terrestre y su influencia en los niveles de accesibilidad de la España peninsular. Estudios de Construcción y Transportes, 103, pp. 97-112.
MORRIS, J. M., DUMBLE, P. L., and WIGAN, M. R. (1979). Accessibiklity indicators for transport planning. Transportation Research A, 13A, pp. 91-109.
NIJKAMP, P., RIETVELD, P., and VOOGD, H. (1990). Multicriteria Evaluation in Physical Planning, North Holland, Amsterdam.
Nutley, S. (2003). Indicators of transport and accessibility problems in rural Australia . Journal of Transport Geography, 11, 55-71.
PETERS, D. (2003). Cohesion, policentricity, missing links and bottlenecks: conflicting spatial storylines for Pan-European transport investments. Pan-European Planning Studies, 11(3), pp. 317-339.
PLASSARD, F. (1991): Le train à grande vitesse et le réseau des villes. Transports, 345, pp.14-22.
PLASSARD, F. (1992): L'impact territorial des transports a grande vitesse. In Espace et dinamiques territoriales, P.-H.Derycke (Ed.), Economica, Paris, pp.243-261.
Preston, J. and Rajé, F. (in press). Accessibility, mobility and transport-related social exclusion . Journal of Transport Geography.
Reggiani, A. (1998). Accessibility, trade and location behaviour, Aldershot, Ashgate.
Rietveld, P. and Nijkamp, P. (1993). Transport and Regional Development. In European Transport Economics, J. Polak and A. Heertje, (Eds.), European Conference of Ministers of Transport (ECMT). Blackwell Publishers, Oxford.
Schürmann, C., Spiekermann, K., and Wegener, M. (1997). Accessibility indicators.Berichte aus dem Institüt for Raumplanung 39, IRPUD, Dortmund.
Talen, E. (1998). Visualizing fairness: Equity maps for planners. Journal of the American Planning Association, 64(1), 22-49.
Talen, E. and Anselin, L. (1996). Assessing spatial equity: an evaluation of measures of accessibility to public playgrounds. Environment and Planning A, 30, 595-613.
VICKERMAN, R. (1995). Location, accessibility and regional development: the appraisal of trans-European networks. Transport Policy, 2(4), pp. 225-234.
Vickerman, R., Spiekermann, K., and Wegener, M. (1999). Accessibility and Economic Development in Europe.
Figure 1: Outline of the methodology
Figure 2: Mediterranean (upper Figure) and Galician (lower Figure) corridors INPUT
DATA
MAPS
STATISTICAL
ANALYSIS
EFFICIENCY AND
EQUITY
IMPLICATIONS
LAND USE
Population Socioeconomic characteristics TRANSPORT
NETWORK T0
ACCESSIBILITY A0
TRANSPORTATION INVESTMENT
TRANSPORT
NETWORK TS
Figure 3: PEIT HSR network extension
Figure 6: Do-nothing scenario (#1) vs. Galician corridor scenario (#2)
Figure 8: Do-nothing scenario (#1) vs. Mediterranean scenario (#6)
Table 1: Definition of assessment scenarios
Scenario Short name Number
Do-nothing 000 1
Do-nothing + Galicia 0+Gal 2
Do-nothing+ Galicia* 0+Gal* 3
PEIT -Galicia PEIT-Gal 4
PEIT +Galicia* PEIT+Gal* 5
Do-nothing + Mediterranean 0+Med 6
Do-nothing+Mediterranean* 0+Med* 7
PEIT -Mediterranean PEIT-Med 8
PEIT +Mediterranean* PEIT+Med* 9
Table 2: Accessibility results by scenario
Scenario Accessibility indicator
Potential Location Network efficiency
Short name Number Mean Relative Mean Relative Mean Relative
000 1 187,601.12 100.00 324.33 100.00 7.15 100.00
0+Gal 2 192,958.23 102.86 311.03 95.90 6.94 96.97 0+Gal* 3 194,978.82 103.93 307.28 94.74 6.87 96.06 PEIT-Gal 4 258,768.59 137.94 220.51 67.99 5.13 71.76 PEIT+Gal* 5 269,263.98 143.53 209.42 64.57 4.94 69.00 0+Med 6 199,423.09 106.30 302.87 93.38 6.75 94.33 0+Med* 7 208,750.41 111.27 290.92 89.70 6.48 90.56 PEIT-Med 8 250,212.80 133.37 227.37 70.10 5.31 74.21 PEIT+Med* 9 278,961.35 148.70 202.80 62.53 4.76 66.56 PEIT 10 265,289.54 141.41 213.03 65.68 5.00 69.94
Table 3: Coefficient of variation. Results by scenario
Coefficient of variation
Scenario Potential Location Network efficiency
Short name Number Mean Relative Mean Relative Mean Relative