Efficiency and spatial equity impacts of high-speed rail extensions in urban areas
Andres Monzon *, Emilio Ortega, Elena Lopez
A B S T R A C T
Urban areas benefit from significant improvements in accessibility when a new high speed rail (HSR) pro-ject is built. These improvements, which are due mainly to a rise in efficiency, produce locational advan-tages and increase the attractiveness of these cities, thereby possibly enhancing their competitiveness and economic growth. However, there may be equity issues at stake, as the main accessibility benefits are primarily concentrated in urban areas with a HSR station, whereas other locations obtain only limited benefits.
HSR extensions may contribute to an increase in spatial imbalance and lead to more polarized patterns of spatial development. Procedures for assessing the spatial impacts of HSR must therefore follow a two-fold approach which addresses issues of both efficiency and equity. This analysis can be made by jointly assessing both the magnitude and distribution of the accessibility improvements deriving from a HSR project.
This paper describes an assessment methodology for HSR projects which follows this twofold approach. The procedure uses spatial impact analysis techniques and is based on the computation of accessibility indicators, supported by a Geographical Information System (GIS). Efficiency impacts are assessed in terms of the improvements in accessibility resulting from the HSR project, with a focus on major urban areas; and spatial equity implications are derived from changes in the distribution of accessibility values among these urban agglomerations.
Introduction
The opening of a HSR station brings enhanced accessibility and fosters changes in the configuration of the land-use system of the urban area near the station and its immediate surroundings (Blum, Haynes, & Karlsson, 1997; Urena, Menerault, & Garmendia, 2009; van den Berg & Pol, 1998). The spatial organization changes to take advantage of the increased attractiveness of the newly-connected location, in a dynamic process where involving simultaneous and multilevel impacts in the economic, social and environmental spheres (Banister & Berechman, 2003; Vickerman & Ulied, 2009).
The motivation for the implementation of a new HSR service in a city strongly influences the impacts it has (Campos & de Rus, 2009; Garmendia, Urena, & Coronado, in press). These motivations, if con-sidered in terms of the accessibility problem the HSR is intended to solve, can be broadly classified into two categories (Blum et al., 1997). On the one hand, the HSR service may be intended primarily to improve long distance and international connections, thus acting as a substitute for, or in combination with, air travel (Givoni, 2006; Roman, Espino, & Martin, 2010). On the other hand, the HSR may be designed to promote high interregional accessibility by linking
together cities in an "integrated corridor economy" (Blum et al., 1997; Martinez & Givoni, 2009; Urena, Garmendia, Coronado, Vickerman, & Romero, 2010; Urena et al., 2009). These two catego-ries are derived from the work of Blum et al. (1997), in which HSR stations which provide good connexion with airports are differenti-ated from those which are primarily designed to improve regional travel (train/car).
Furthermore, travel patterns in cities outside the HSR corridor may also change in response to the new HSR service (Garmendia et al., in press; Lopez, Gutierrez, & Gomez, 2008; Urena et al., 2009, 2010). For these cities, the nearest HSR station may function as an interchange node to connect to the HSR network. Hence cities located outside the HSR corridor may also obtain accessibility benefits, whereas cities with their own HSR station may be transformed into new regional "core locations".
Monzon, 2010; Martinez & Givoni, 2009). Efficiency objectives in isolation would lead to a HSR network whose aim is to provide an efficient link between major economic activity centres. However, this strategy would have a negative impact on equity, as it would lead to more polarized patterns of spatial development: richer cities are likely to gain more, while disadvantaged cities would end up in a comparatively worse situation (Martin, 1997; Martinez & Givoni, 2009; Puga, 2002).
These equity considerations, related with concepts such as cohesion, polycentricity and peripherality, are gaining ground in European transport and regional policy documents (Brocker et al., 2010; EC, 1999; Peters, 2003; Vickerman, Spiekermann, & Wegener, 1999). It is therefore increasingly being claimed that the design of a HSR network may need to be modified to ensure that both an acceptable degree of equity is retained, while maxi-mizing economic growth (Brocker et al., 2010; Button, 1993; Lopez & Monzon, 2010). This design will require changes in local and re-gional secondary transport networks in order to improve the con-nection of cities without a HSR station to the HSR service (EC, 1999).
Accessibility analysis is increasingly being used as a support tool when planning HSR extensions (Brocker et al., 2010; Gutierrez, 2001; Gutierrez, Gonzalez, & Gomez, 1996), given its proven capacity to address both efficiency and equity issues (Lopez et al., 2008; Martin, Gutierrez, & Roman, 2004). Accessibil-ity measures are capable of gauging the achievement of efficiency objectives, as they make it possible to assess improvements in network efficiency (Gutierrez et al., 1998). They can also deter-mine how transport and development impacts are distributed across geographical areas and population groups, thus combining the objectives of compatibility and equity (Talen, 1998; Talen & Anselin, 1996).
In this context, the present paper contributes to the existing lit-erature by proposing a methodology to assess both the equity and efficiency implications of HSR projects. The structure of the paper is as follows: the section after this introduction defines various general concepts of efficiency and equity, and outlines current at-tempts to measure equity impacts through accessibility analysis. The third section describes the proposed methodology, which is subsequently applied in a fourth section to a case study of a HSR extension in Spain. The fifth and final section contains the discus-sion and recommendations for future research directions.
Efficiency, equity and accessibility analysis
From a wider perspective, the implications of the accessibility benefits brought by HSR have been comprehensively addressed in the transport planning literature. When HSR first arrives in an urban area it triggers a dynamic process which transforms the land-use and economic activity patterns of the core city and its sur-roundings. However, the conclusions of recent studies show that support for investment in HSR infrastructure cannot be based only on expectations of benefits to economic development (Givoni, 2006). Other considerations apply if HSR impacts are approached solely from the standpoint of regional development (see e.g.; Kobayashi & Okumura, 1997; Martin, 1997; Martinez & Givoni, 2009; Vickerman & Ulied, 2009; Vickerman et al., 1999).
Although this issue is subject to debate (Givoni, 2006; Pol, 2003; Puga, 2002; Vickerman & Ulied, 2009), it has been argued that this improved connectivity may be transformed into increased compet-itiveness for firms located in these core cities connected to the HSR network. These cities can benefit from the effects of agglomeration to attract economic activity, enlarge their market areas and help accelerate the growth and development of regional economies (Martin, 1997). It has been suggested that these effects depend predominantly on the manner in which the urban actors react to the new opportunities offered by improved accessibility (Kobay-ashi & Okumura, 1997; Pol, 2003). It is therefore necessary to de-sign a strategy for integrating HSR into the city (van den Berg & Pol, 1998) which takes into account the effects on the quality of the living environment.
Despite the complexity of the relationship between improved connectivity and economic growth, good accessibility is deemed to be a necessary condition in order to improve a city's competi-tiveness (van Winden, van der Berg, & Pol, 2007). In a context of transition to the information society, core cities face the challenge of becoming the nodal points of worldwide networks. Thus "HSR can be a great opportunity to renew and/or strengthen the urban economy, to change the modal split in favour of the more environmen-tally-friendly modalities, and to improve the image of the inner city and its urban region" (Pol, 2003). International transport tions - in terms of access to international airports and HSR connec-tions - are therefore a key element in this shift, as they provide city economies with expanded opportunities for "face-to-face commu-nication for knowledge production" (Kobayashi & Okumura, 1997).
The above considerations apply mainly to major core cities con-nected to the HSR network. The picture is different for intermedi-ate cities and low-density regions without a HSR station, but geographically located near a HSR corridor. The debate as to the
Efficiency impacts of HSR
From the perspective of a transport system, the opening of a HSR section obviously leads to an improvement in accessibility, -i.e. improved efficiency in the global network (Brocker et al., 2010; Gutierrez et al., 1998). In addition, at a strategic level, the opening of a new HSR link can significantly affect demand on com-petitive and complementary links and transport modes, thereby changing interconnections and the resulting patterns of network usage and performance (Adler, Pels, & Nash, 2010; Campos & de Rus, 2009; Givoni, 2006; Martin, 1997; Roman et al., 2010).
These effects on the performance of the transport network as a whole are termed "network effects" (Laird, Nellthorp, & Mackie, 2005), and are thus related to issues such as "network efficiency", (Gutierrez et al., 1998; Lopez & Monzon, 2010). We will use the term "efficiency" in this research work to describe the accessibility benefits conferred by a new transport infrastructure. This is a com-monly accepted approach in accessibility papers (see e.g. Brocker et al., 2010; Gutierrez et al., 1998; Lopez & Monzon, 2010), and was first used in the early work of Domanski (1979).
STAGE 1:
G IS database implementation and accessibility calculation
Land use system
Do-nothing transport network
T„
Project transport network
T5
Accessibility
A0
Accessibility
STAGE 2: Efficiency
analysis
Improvement of accessibility
STAGE 3: Equity analysis
Spatial distribution of
accessibility
effects of HSR on the urban structure and mobility of these sparsely populated regions and intermediate cities is still on the research agenda (Garmendia et al., in press; Martinez & Givoni, 2009; Urefia et al., 2010). Cities which are not connected to the HSR are at risk of suffering competitive disadvantage (Martinez & Givoni, 2009; Puga, 2002).
However, it has also been argued that the scientific literature to date has underestimated the transportation changes that a connec-tion to a HSR network may bring to large intermediate cities (Urefia et al., 2009). Recent studies state that HSR stations located in subur-ban areas or small cities within 100 km of a metropolitan area with a HSR station may contribute to transforming these agglomerations into metropolitan sub-centres (Urefia et al., 2010), thereby encour-aging their incorporation intro metropolitan or national corridors.
Equity impacts of HSR
The concept of equity concerns the distribution of a given effect. In transport literature it is often also found variously termed as "justice", "fairness" or "cohesion" (Brocker et al., 2010; Lopez et al., 2008; Peters, 2003). Equity assessment is frequently carried out using spatial impact models, and subsequently included as a complementary analysis to other appraisal methods such as cost-benefit analysis (CBA) or multicriteria analysis (MCA) (Lopez & Monzon, 2010). This more complex type of analysis has been shown to be increasingly important in areas which already have a high-quality transport network (Banister & Berechman, 2003; EC, 1999; Rietveld & Nijkamp, 1993).
Spatial equity impacts of HSR projects are currently the subject of debate for several reasons. First, the choice of the level of
analysis - international, national, regional or local - has significant and obvious consequences on the conclusions to be drawn with re-gard to HSR impacts (Lopez et al., 2008; Urefia et al., 2009). Second, some studies suggest that a new HSR link is likely to reinforce the privileged situation of cities located at the main nodes of the net-work, in detriment of other locations outside the HSR corridor (Martinez & Givoni, 2009; Puga, 2002; Vickerman et al., 1999). There is a risk that the greatest gains accrue to the core cities with a HSR station, whereas other cities may be adversely affected by the reallocation of economic activity to these major access points (Lopez et al., 2008). Cities which fail to connect to the HSR network may therefore experience backwash-effects; namely "companies moving from their region to other regions that offer better access" (Pol, 2003).
This uneven allocation of growth will reinforce the pattern of polarization mentioned earlier (Pol, 2003; Puga, 2002) and there-fore lead to additional negative impacts on equity. In addition, the operation of the new HSR link may result in the closure of cer-tain conventional rail services which will cease to be competitive (Garmendia et al., in press; Martinez & Givoni, 2009), thus increas-ing these disparities. In other words, there is a risk that HSR con-tributes to the increased concentration of most of the economic activity in already developed cities (Gutierrez, 2001; Lopez et al., 2008; van den Berg & Pol, 1998).
Equity impacts of transport infrastructure investments can be as-sessed in terms of the corresponding changes in the distribution of accessibility (Brocker et al., 2010; Lopez & Monzon, 2010; Lopez et al., 2008). Accessibility analysis is a useful planning tool, although some researchers consider that its potential has not yet been fully exploited (Bruinsma & Rietveld, 1993; Geurs & Ritsema van Eck,
.SJT^*! jAviles
La Corunafrg »'•-_'»' t » j
Oviedo-' - -"v
Santiago cle Compostela'
Santander
(•Bilbao San Sebastian FRANCE
Burgos'
Vitoria Pamplona
Logroiio
,Valladolid jZaragoza
N
"'Barcelona
Salamanca
.Madrid
Cuenca Castellon de la Plana
,o*
(S*
. 6 ^
^Valencia
, Tomelloso
• **\. Albacete
f Huelvai jSevilla
Cordoba i
Malaga
Alicante
Murcia
Almeria Conventional network (km/h)
- — - 40 - 65
— — 66-100
- — - 101-150
2003; Halden, 2003). Early examples of the use of accessibility to as-sess equity impacts date from the late 1970s, such as the study by Domanski (1979) which relates the increase in accessibility to spa-tial concentration. Recent approaches in the research have analysed equity impacts via changes in the distribution of accessibility among regions or population groups (Brocker et al., 2004,2010; Lopez et al., 2008; Martinez & Givoni, 2009; Talen, 1998; Talen & Anselin, 1996). The methodology proposed in this paper uses the capabilities of accessibility measures to address both efficiency and equity issues. This approach is explained below.
Methodological approach
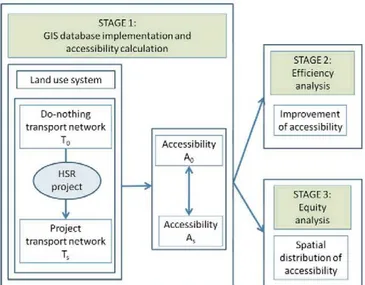
Fig. 1 shows an outline of the proposed approach. The whole procedure is supported by CIS software.
Stage 1 involves the implementation of the input data geodatabase and the accessibility calculations. Stage 2 comprises the efficiency analysis, based on the assessment of accessibility improvements; and Stage 3 is the equity analysis based on the study of changes in the spa-tial distribution of accessibility between scenarios. This methodology is valid for all levels of analysis: corridor, regional and national.
investments modifies the characteristics of the transportation net-work (I) from I0 ('do-nothing' netnet-work) to Ts ('project' network). Land-use characteristics remain identical between both scenarios in order to isolate the effects of the transportation investment from the effects caused by changes in the land-use system. The corre-sponding changes in accessibility (A) have been represented as A0 and As.
Extensive reviews and existing classifications of accessibility indicators/measures can be found in Baradaran and Ramjerdi (2001), Bruinsma and Rietveld (1998), Gutierrez (2001), Reggiani (1998), Geurs and Ritsema van Eck (2001) and Geurs and van Wee (2004).
The potential indicator (Martin et al., 2004) is selected. The po-tential indicator falls under the category of gravity indicators. From the many formulations available, the potential indicator described in Eq. (1) was selected for offering the appropriate balance be-tween complexity and interpretability, as well as for its proven validity (Lopez et al., 2008; Martin et al., 2004). The formulation is as follows:
Pj
(1)
Stage 1: Implementation of the GIS database and accessibility calculation
Stage 1 comprises the implementation of the land use and transport network geodatabases. The assessment is made by comparing two scenarios: the 'do-nothing' scenario (0), and the project scenario (s). The implementation of certain transportation
For each origin i, its accessibility (At) to destinations j is calculated.
Pj is a variable referring to the size of each destination - usually population or gross domestic product (GDP) - and (J,-,-) is the gener-alized travel time using the network. The formulation for the travel time is as follows:
/„ = TTR{i,Et) + nV(E,,Ej) + TTR(Ej,j) + 0F (2)
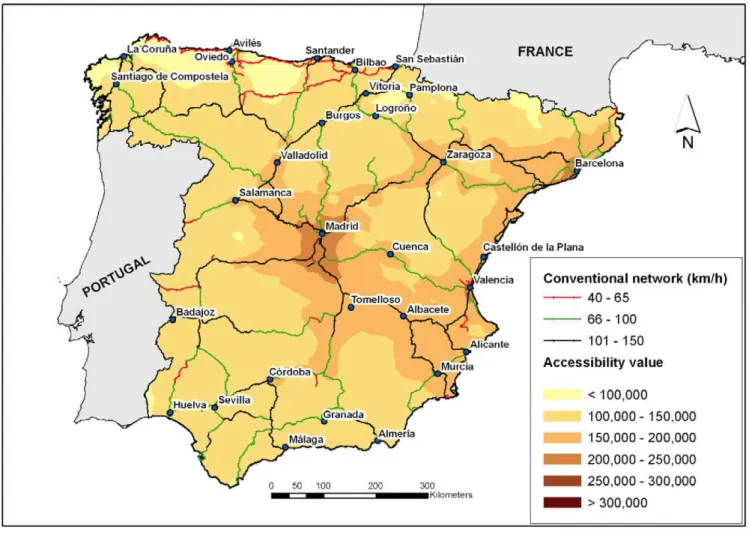
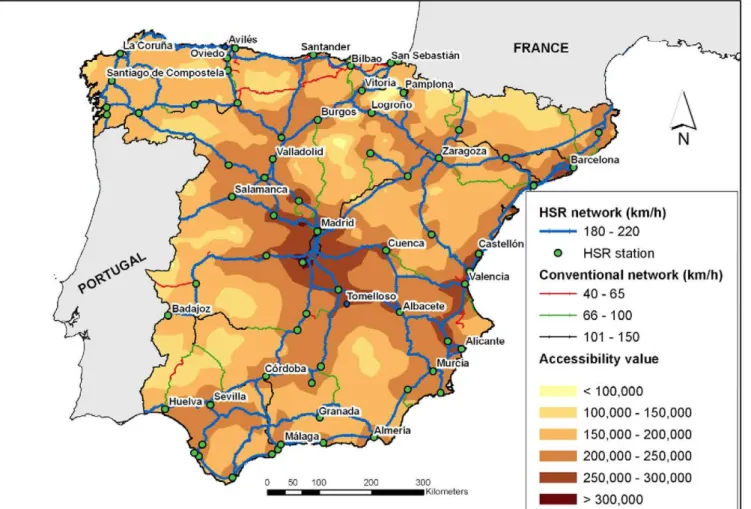
Fig. 4. Accessibility map: do-nothing scenario.
The equation takes into account the travel time by road from the origin to the nearest station (7Tc(!,£j)), the travel time by railway (TTf (y)) and the travel time by road from the station nearest the desti-nation to the destidesti-nation itself (TTeiEjj)), and the penalties (8F) caused by: changing from road to railway mode, frequency of ser-vice, line changes and impediments for gauge changes, as used in Lopez, Monzon, Ortega, and Mancebo (2009) and Lopez and Monzon (2010). In addition to the numerical results, the whole procedure is supported by graphic information - maps - using the potential of GIS environments.
Maps efficiently provide intuitive information on the spatial distribution of accessibility changes between scenarios. Moreover, maps improve the interpretation of numerical results, thereby en-abling informed discussion among the planners, policy makers and potential stakeholders commonly involved in the planning process.
Stage 2: Efficiency analysis
The accessibility values and maps obtained in Stage 1 allow the effects of transport infrastructures to be analyzed in terms of effi-ciency. The efficiency effects are obtained from the values of the indicator in the do-nothing scenario and the project scenario, and from the difference in accessibility between these two scenarios as a percentage.
The comparison of the indicator values in the two scenarios al-lows the effects of a given transport project to be assessed. These differences can be shown in absolute and relative terms, and both offer complementary results. The relative change in accessibility indicator is expressed as follows:
AC, = 100 (3)
For each origin i, its accessibility change in percentage (AC,) is calcu-lated. Ai0 is the indicator value in the do-nothing scenario, and Ai{ is the indicator in the project scenario.
Stage 3: Equity analysis
Equity effects are frequently measured in terms of a set of sta-tistical indices of the spatial distribution of accessibility values. The selection process for these equity indices is based on their proven efficiency in previous studies (Brocker et al., 2004; Lopez et al., 2008; Martin et al., 2004; Schurmann, Spiekermann, & Wegener, 1997). These authors agree that there is no "ideal" equity index, and therefore suggest computing a set of indices in order to ana-lyze their results in a complementary manner. Based on their find-ings, we have selected two different methods for evaluating the equity effect.
In the first analysis, the coefficient of variation (CV) is com-puted, using the population as the weight variable. The formula-tion for the CV is:
CV* = (4)
This index has been previously used for this purpose in similar studies (see e.g. Lopez et al., 2008; Martin et al., 2004). An in-creased CV value means a decrease in equity, - i.e. a negative equi-ty effect - whereas a reduction in the CV value means a positive equity effect, i.e. a more balanced spatial distribution of accessibility.
Second, focusing on the situation in each city, a normalized va-lue of the relative and absolute improvement in accessibility is cal-culated for each city. These two values are complementary due to the fact that a city can have a high absolute improvement but a low relative improvement if its initial accessibility value is low. A value of 1 is assigned as the average value. If the improvement in acces-sibility is below average, it will have a corresponding value equal to less than 1; and if the improvement is above average, it will be greater than 1.
This normalized value makes it possible to analyze how accessi-bility improvements are distributed between cities. It reveals which cities obtain more benefit than others, and whether the improve-ments are uniformly distributed (approximate average values), or whether they increase the differences between them. The enhanced interpretability of results deriving from equity mapping constitutes a valuable tool for designing good regional policies.
Case study: Urban impacts of HSR extensions
To validate the methodology, the new HSR lines proposed in the Spanish Strategic Transport and Infrastructure Plan of 2005-2020 (PEIT) have been selected as the case study. The PEIT is designed to link all major Spanish cities by means of HSR, and entails an
investment of €83,450 M (Ministerio de Fomento, 2005). Accessi-bility values have been calculated for all Spanish cities, while the analysis of efficiency and equity effects has focused on 30 cities which comprise regional economic centres.
Stage 1: Implementation of the GIS database and accessibility calculation
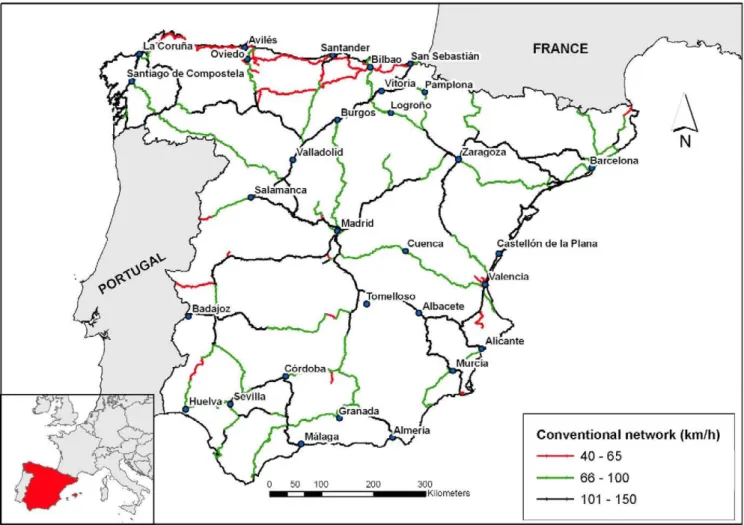
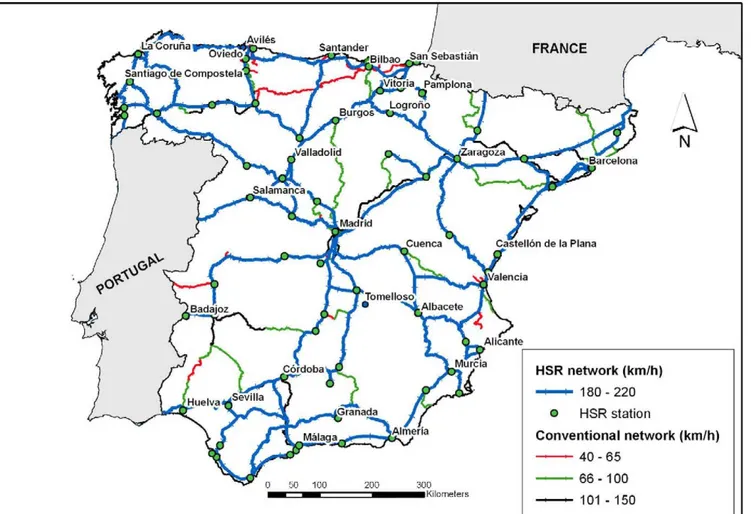
The infrastructure network under consideration (the HSR pro-ject in Fig. 1) is the 9600 km of planned HSR lines in Spain in 2020, with a commercial speed of 180-220 km/h. Fig. 3 shows the project scenario - renamed the HSR scenario for this case study - with the location of the HSR stations. It includes both the current HSR lines and the HSR lines included in the PEIT. According to the terms shown in Fig. 1, the network of the do-nothing scenario (I0) (Fig. 2) corresponds to the situation in 1990 (there were no HSR lines in Spain). The land-use characteristics of both network situa-tions are identical and correspond to the forecast for the 2020 sit-uation, i.e. the planning time horizon of the PEIT.
The study area and the zoning level for the analysis basically comprise the Spanish mainland at the level of municipalities, which include a total of 8100 cities.
A vectorial GIS was used, in which the road and railway net-works are modelled as a graph with approximately 100,000 arcs. Each of the origins i and destinations j of the study area defined above is characterized in terms of its transport and socio-economic data.
The road network is necessary as a complement to the rail net-work in order to obtain a denser distribution of results than can be derived from the accessibility values at the railway stations. The
Table 1
Accessibility values and improvements in the do-nothing and HSR scenarios.
City HSR station Population3 Accessibility values
Do-nothing scenario3 HSR scenario3 Accessibility changes
274.2 249.4 239.1 159.9 192.4 361.3 252.7 263.3 290.2 288.6 293.0 240.2 214.7 193.8 252.9 485.2 272.2 288.6 224.5 247.7 257.1 241.9 235.5 200.9 265.4 244.8 334.8 301.1 257.5 314.3 258.9 214.4
Absolute (As-Aoa)
72.8 46.3 109.4 63.5 51.8 70.0 95.7 95.1 77.9 114.7 119.4 98.2 86.6 77.3 95.1 97.0 124.2 88.8 101.1 89.8 88.9 102.7 117.1 81.6 93.0 64.3 88.8 118.8 92.9 111.1 92.8 78.1 Relative (%) 36.1 22.8 84.4 65.8 37.1 24.0 61.0 56.5 36.7 65.0 68.8 69.1 67.6 66.3 60.3 24.0 83.9 44.5 82.0 56.9 52.8 73.8 98.9 68.4 54.0 35.6 36.1 65.1 56.4 54.6 53.5 42.4 Albacete Alicante Almerfa Aviles Badajoz Barcelona Bilbao Burgos
Castellon de la Plana Cordoba Cuenca Granada Huelva La Corufia Logrofio Madrid Malaga Murcia Oviedo Pamplona Salamanca San Sebastian Santander
Santiago de Compostela Seville Tomelloso Valencia Valladolid Vitoria Zaragoza
Average accessibility values for selected cities National average of accessibility values
Yes Yes Yes No Yes Yes Yes Yes Yes Yes Yes Yes Yes Yes Yes Yes Yes Yes Yes Yes Yes Yes Yes Yes Yes No Yes Yes Yes Yes 185.4 402.1 200.6 80.7 167.5 1754.5 340.0 189.5 226.5 346.2 58.5 222.6 153.8 242.2 183.2 3691.2 577.1 522.9 232.1 244.4 160.4 194.0 182.8 90.2 719.4 39.3 890.8 323.4 246.1 722.1 201.4 203.1 129.7 96.4 140.6 291.3 157.0 168.2 212.3 173.9 173.6 142.0 128.1 116.5 157.8 388.2 148.0 199.8 123.4 157.9 168.2 139.2 118.4 119.3 172.4 180.5 246.0 182.3 164.6 203.2 166.1 136.3
a In thousands.
length and speed of each arc on the rail and road network enable the travel time to be calculated, which is the variable included in the accessibility indicator (for more details, see Gutierrez, 2001; Holl, 2007; Lopez et al., 2008; Martin et al., 2004).
In the case of the railway, each arc is given a commercial speed according to both the characteristics of the infrastructure and qual-ity of service. The tasks involved in modelling the rail network are significantly more complex than for the road mode, as it is neces-sary to include information on track gauge (Iberian/UIC) data, the location of the stations and frequency of service in order to calcu-late travel times, as described in Lopez et al. (2009) and Lopez and Monzon (2010).
For this application, the variable selected from the geodatabase to characterize the size of each destination was population (P in Eq. (1)), as in previous studies (Lopez et al., 2008; Martin et al., 2004). After the input database has been stored in the CIS, the next step involves calculating the travel time between each i and j pair. These travel times, along with the destination population data, are subsequently introduced in Eq. (1) to obtain the accessibility value of each origin. Accessibility values are thus obtained for the 8100 Spanish cities, and calculated for the centroid of each city. The accessibility calculations were made using a GIS-based network accessibility analysis toolbox named Accesstool1 which follows the methodology described. The accessibility maps for the whole territory are drawn using interpolation techniques from the cities' values.
1 AccesstUls.aml: Network Accessibility Analysis Toolbox, developed by Santiago Mancebo in 2007.
Stage 2: Efficiency analysis
In order to provide an overall view of the do-nothing and HSR scenarios in terms of network efficiency, the corresponding acces-sibility values have been mapped in Figs. 4 and 5 respectively. Ta-ble 1 shows the accessibility values of a selection of 30 cities which are regional economic centres. The accessibility value is shown both in absolute and relative terms (compared with the do-nothing scenario). The inclusion of both values enables easier comparison of the results obtained in each scenario, and of the percentage change values among different accessibility indicators.
Fig. 4 shows that in the do-nothing scenario, the cities with higher levels of accessibility are located in connected areas with good-quality conventional rail lines. The cities in various corridors radiating from Madrid are highlighted, as in the case of Zaragoza, Albacete and Valladolid and the intermediate cities between Ma-drid. Also highlighted is the Mediterranean corridor which runs parallel to the coast, connecting cities with large populations such as Barcelona, Valencia and Alicante. All these cities have accessibil-ity values in the do-nothing scenario which are above the national average value (see Table 1). The cities with the lowest levels of accessibility are located in the north. These cities have a very poor rail infrastructure and are extremely distant from the main eco-nomic centres of the country, as shown in Table 1.
reached with a short travel time. The presence of "islands" with en-hanced levels of accessibility is common in the vicinity of these stations, which offer virtually direct access to the most important and/or nearby cities such as Cuenca or Cordoba. Low accessibility levels correspond to small cities located in areas where there is a low population density, such as the cities bounded by Badajoz-Cordoba and Seville.
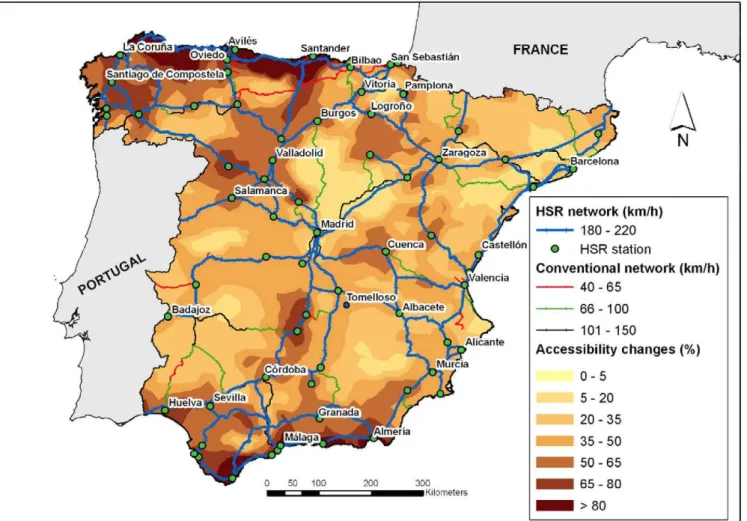
Fig. 6 shows the percentage of changes in the level of accessibil-ity between the do-nothing and HSR scenarios. The mean value of improvement is 42.4% (Table 1). This clearly highlights the trans-formation that would occur in the northwest and southeast quad-rants, as their accessibility values in the do-nothing scenario are very low. The cities with a HSR station see high improvements, but the value depends on their initial accessibility values, and is lower when their values are high in the do-nothing scenario. The improvement in cities without a HSR station depends on the qual-ity of the transport network from these cities to the HSR station (see Tomelloso and Aviles in Table 1).
Table 1 shows that the greatest improvements are found in the cities in the north (Santander, Oviedo and San Sebastian) and south (Malaga, Almeria, Granada and Huelva) of Spain. These cit-ies gain in both absolute and relative values, due to the improved links created among them by the HSR lines. These provide quick and high-quality access to destinations with major socio-eco-nomic potential, including Spain's most populated cities - Madrid, Barcelona and Valencia - which have a very high attractor weight in the relationships of Spanish cities.
The lowest percentages of improvement (it is important to note that despite being lower than in the rest of the cities, the
rate is still over 20%) occur in large cities which had high levels of accessibility in the do-nothing scenario such as Madrid (24.0%) and the Mediterranean corridor cities (Barcelona (24.0%, Valencia (36.1%) and Alicante (22.8%)). These cities are connected by means of good-quality railway lines. Furthermore, they have a greater weight in the territory and therefore benefit less than the rest, as the other cities are less attractive.
There is a group of cities in the metropolitan area of Madrid and Barcelona with a very high population which have not been included in the table. These cities obtained an improvement value of less than 20% due to their intense relationship with Madrid and Barcelona, as a result of which they are unaffected by the HSR lines. It is also worth noting that these cities have public trans-port services such as underground railway systems, meaning that they are virtually a part of these large neighbouring cities.
We then examine in greater detail the situation of three repre-sentative cities in order to study the effects of the new HSR lines. The selected cities are: Alicante, Santander and Burgos. Alicante has good rail connections in the do-nothing scenario, as it lies in important corridors which connect it to major cities. Santander has very poor rail infrastructures, although the new HSR lines connect it to the nearest major cities and to the rest of Spain. Fi-nally, Burgos is well connected with its nearest cities but has poor-quality infrastructures in the do-nothing scenario.
Alicante has a good level of rail connections in the do-nothing scenario. It is part of the Mediterranean corridor, and although it is served by a conventional railway, it has a commercial speed of 120km/h and connects the city with Barcelona, Valencia and Murcia. The same is true of its connection with Madrid. These
two features give it above-average access levels. HSR lines provide better accessibility only thanks to the reduced travel time, as although they connect Alicante with the rest of the country, the accessibility level with its main destinations was already high. The result is an improvement of 22.8%. This is high but far from the improvements reached in other cities.
In the do-nothing scenario, Santander's railway connections with the rest of the Spanish territory are very poor. The new lines change this situation. HSR connects Santander with the nearest major cities (Bilbao, Oviedo, La Corufia) and with the rest of Spain (Valladolid or Madrid). This produces a very significant improve-ment in absolute terms. The accessibility improveimprove-ment is 98.9%.
Burgos is well connected with the north and centre of the coun-try in the do-nothing scenario. As in the case of Alicante, HSR lines provide better accessibility only due to the reduction in travel time, as the initial connections are already good. The most distinc-tive feature of Burgos is that it remains in the same situation com-pared to other cities. Its accessibility level has obviously greatly increased (56.5%), but these improvements correspond to average values, and it therefore maintains its situation in relation to the other cities.
Stage 3: Equity analysis
Taking into account the 8100 cities, the CV value for each sce-nario is 0.39 and 0.30 respectively. This corresponds to a decrease of 23.1%. This value indicates a significant increase in territorial
equity due to the reduction of differences in accessibility. For the group of 30 cities shown in Tables 1 and 2, the CV values in the do-nothing and HSR scenarios are 0.39 and 0.28 respectively, rep-resenting an improvement of 28.2%. The CV value in the do-noth-ing scenario is the same selectdo-noth-ing either these 30 cities or the total Spanish cities, although the improvement is greater when only these 30 cities are taken into account. This indicates that ter-ritorial equity is higher between the largest Spanish cities (repre-senting 28.6% of the total population).
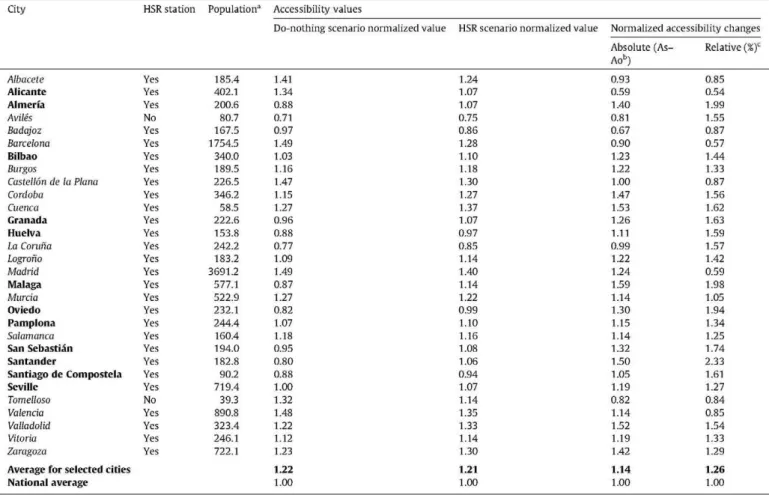
Table 2 shows the normalized accessibility values (mean = 1) of these 30 cities. According to these values, most of the cities obtain an above-average percentage of improvement, both in relative and absolute terms. Cities in bold indicate that their accessibility gains contribute to increasing global equity, while cities in italics show that their accessibility gains lead to a decrease in global equity.
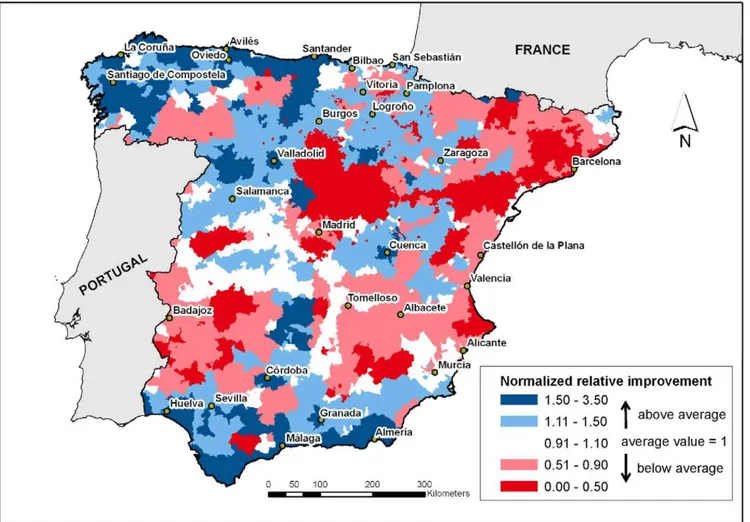
Fig. 7 shows the normalized value of the percentage of relative accessibility improvement in the 8100 Spanish cities. The blue areas indicate that the improvements are above average and the red areas that they are below average.
Fig. 7 shows that municipalities with values greater than 1 are mainly distributed in areas where accessibility improvements are more pronounced, as in the case of the southern and northern Ibe-rian Peninsula. This is confirmed by the values for cities shown in Table 2.
There are some cities in the centre and northeast of the penin-sula with a below-average percentage of improvement. This may be due to two reasons. On the one hand, they may have previously
Table 2
Normalized accessibility values and improvements in the do-nothing and HSR scenarios.
City HSR station Population3 Accessibility values
Do-nothing scenario normalized value HSR scenario normalized value Normalized accessibility changes Absolute
(As-Aob) 0.93 0.59 1.40 0.81 0.67 0.90 1.23 1.22 1.00 1.47 1.53 1.26 1.11 0.99 1.22 1.24 1.59 1.14 1.30 1.15 1.14 1.32 1.50 1.05 1.19 0.82 1.14 1.52 1.19 1.42 1.14 1.00
Relative (%)c
0.85 0.54 1.99 1.55 0.87 0.57 1.44 1.33 0.87 1.56 1.62 1.63 1.59 1.57 1.42 0.59 1.98 1.05 1.94 1.34 1.25 1.74 2.33 1.61 1.27 0.84 0.85 1.54 1.33 1.29 1.26 1.00 Albacete Alicante Almeria Aviles Badajoz Barcelona Bilbao Burgos
Castellon de la Plana Cordoba Cuenca Granada Huelva La Corufia Logrono Madrid Malaga Murcia Oviedo Pamplona Salamanca San Sebastian Santander
Santiago de Compostela Seville Tomelloso Valencia Valladolid Vitoria Zaragoza
Average for selected cities National average Yes Yes Yes No Yes Yes Yes Yes Yes Yes Yes Yes Yes Yes Yes Yes Yes Yes Yes Yes Yes Yes Yes Yes Yes No Yes Yes Yes Yes 185.4 402.1 200.6 80.7 167.5 1754.5 340.0 189.5 226.5 346.2 58.5 222.6 153.8 242.2 183.2 3691.2 577.1 522.9 232.1 244.4 160.4 194.0 182.8 90.2 719.4 39.3 890.8 323.4 246.1 722.1 1.41 1.34 0.88 0.71 0.97 1.49 1.03 1.16 1.47 1.15 1.27 0.96 0.88 0.77 1.09 1.49 0.87 1.27 0.82 1.07 1.18 0.95 0.80 0.88 1.00 1.32 1.48 1.22 1.12 1.23 1.22 1.00 1.24 1.07 1.07 0.75 0.86 1.28 1.10 1.18 1.30 1.27 1.37 1.07 0.97 0.85 1.14 1.40 1.14 1.22 0.99 1.10 1.16 1.08 1.06 0.94 1.07 1.14 1.35 1.33 1.14 1.30 1.21 1.00 In thousands.
Normalized relative improvement
1.50-3.50 »
1 11 -1 50 T
a b o v e a v e r a9
e0.91-1.10 average value = 1
0.51 - 0.90
0.00-0.50
below average
Fig. 7. Normalized value of the relative improvement of accessibility.
had high accessibility levels which are not affected by the improve-ments. This is the case of the cities located in both the northeast and in the Madrid-Albacete-Alicante corridor. This is a satisfactory outcome, as the differences are not increased. The other situation is that areas with low levels of accessibility in the do-nothing sce-nario obtain a lower-than-average benefit. These cities are located in areas without new HSR lines. This situation decreases territorial equity and occurs in the cities bounded by Badajoz-Cordoba and Seville, and in the north of Madrid.
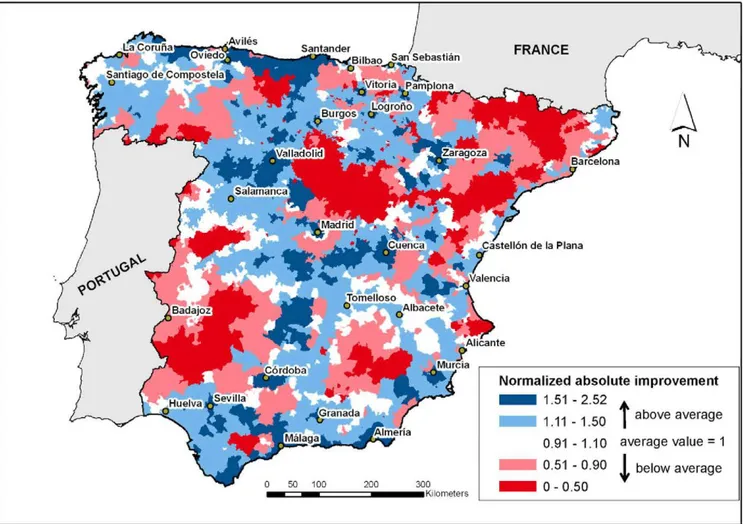
Fig. 8 completes the analysis. The map shows the normalized percentage of absolute improvement. There are various differences in relation with the results shown in Fig. 7. For example, the cities in the Madrid-Albacete-Alicante corridor show an above-average absolute improvement; however their relative improvement is be-low average (see Table 2). This situation is due to the fact that these cities have high accessibility values in the do-nothing sce-nario, as they already have good railway connections. The same sit-uation occurs in the Mediterranean corridor. The cities bounded by Badajoz-Cordoba and Seville, the north of Madrid and the Pyrenees are confirmed as obtaining little benefit from the new HSR lines.
Table 2 shows various situations which contribute to increasing equity (the corresponding cities are shown in bold in Table 2). They are grouped below:
- Cities with very high accessibility values in the do-nothing sce-nario whose improvements are very low. The new HSR lines maintain them at the average. This situation occurs in Alicante. - Cities in an average position in the do-nothing scenario. These obtain a considerable improvement, but remain at the average in the HSR scenario, such as Seville.
- Cities that are in a disadvantaged position in the do-nothing scenario. The new HSR lines maintain them at the average or slightly above. This occurs in Malaga, Almeria and Santander. Due to their poor initial position, both their improvement rates and absolute improvement are very high.
- In contrast, the situation in other cities with the new HSR leads to an increase in inequity (cities in italics in Table 2):
- Cities that are above average in the do-nothing scenario and maintain this situation in the HSR scenario, such as Barcelona, Madrid and Albacete. These have a below-average percentage of relative improvement, but their good initial situation allows them to maintain a privileged position.
- Cities such as Badajoz. Their position relative to the mean is worse, with very low absolute improvements.
- Cities whose absolute and relative improvements are greater and approaching the average value in the HSR scenario, but which remain at a disadvantage compared to others. This is the case of La Corufia.
- Cities with an above-average initial situation but which are moving slightly further away. Their improvements in percent-age and absolute terms are above averpercent-age. This is the case of Vitoria, Burgos and Logrono.
Normalized absolute improvement
1.51-2.52 .
1 11 -1 50 T
a b o v e a v e r a9
e0.91-1.10 average value = 1
0.51 - 0.90
0-0.50
below average
Fig. 8. Normalized value of the absolute improvement of accessibility.
accessibility compared to the rest of the country is very poor, but the new HSR leads to various major improvements above the average. This is the opposite to Alicante's situation, but also leads to territo-rial equity. Finally, Burgos' improvement in accessibility produces a greater difference between Burgos and other Spanish cities, which does not lead to equity.
Conclusions
The planning process for HSR extensions must include - as cru-cial elements of the decision-making process - consideration of both network efficiency and spatial equity issues (Brocker et al., 2010; Puga, 2002). If HSR extensions are prioritized solely accord-ing to network efficiency objectives, their design will strongly de-pend on the extent to which HSR efficiently links major urban agglomerations. This approach implies a serious risk of creating the effect of spatial polarization, i.e. a negative impact on spatial equity (Lopez et al., 2008). The spatial equity approach involves adopting a more strategic view, which addresses both the possible benefits and their spatial distribution. This requires an assessment of the effects not only on the cities in the HSR corridors with a HSR station, but also on other cities outside the corridor, regardless of whether or not they have a HSR station.
This paper presents a methodology designed to fill this research gap, based on an accessibility analysis approach. The application of the procedure to the case study of the extension of the Spanish HSR network has provided evidence of both efficiency and spatial equi-ty impacts. The analysis is based on the comparison of the ranking of Spanish cities before and after the extension of the HSR network. I
The risk of spatial polarization posed by HSR can clearly be seen in the Spanish case study. After the HSR extension, higher accessibil-ity values are concentrated in the surroundings of HSR stations such as Madrid, Valencia and Barcelona (see Fig. 5). The presence of HSR stations causes the existence of "islands" with enhanced levels of accessibility, and shadow areas in isolated locations -i.e. the "tunnel effect" (Plassard, 1991). The size of these "islands" depends on the quality of the transport network from the sur-rounding cities to the nearest HSR station.
In addition, the research reveals that both the accessibility of each city in the initial situation and its geographical position are two important drivers of their potential to gain relative accessibil-ity benefits. On the one hand, the Spanish results show that cities with a poorer initial situation concentrate the highest percentage of accessibility improvements, as is the case of the peripheral cities in the north and south of the peninsula which obtain percentage improvements considerably in excess of 60%, such as Santander (99%), Oviedo (82%), Almeria (84%) and Malaga (84%). On the other hand, cities with good railway connections in their initial situation and which are near large population centres obtain limited bene-fits. This is the case of cities such as Madrid (24%), Valencia (36%) and Alicante (23%), located in corridors connecting large Spanish cities and whose accessibility levels are already acceptable before the HSR extension. Globally, the final situation is ultimately more equitable than before.
causes a global rise in territorial equity; the CV value decreases by 23.1%. However, it should be noted that specific inequity effects ap-pear with the HSR extension. This is the case of cities where the dif-ference in their accessibility values increases with regard to the average value, such as Badajoz and Cuenca; or cities whose accessi-bility value does not come near the average values, such as Madrid.
Some of these conclusions are relevant for application to HSR planning procedures. This research work highlights various impor-tant factors that must be considered in the planning process, includ-ing: the level of accessibility of the city in the initial situation as regards the quality of its railway infrastructures; its geographical position in terms of proximity to major population centres; the exis-tence of a HSR station; and the quality of the transport network from the cities to the nearest HSR station. These factors need to be ad-dressed at the planning stage in order to obtain maximum positive spatial equity impacts. The Spanish HSR Masterplan will unques-tionably bring significant benefits to areas all over the Spanish mainland. However its radial structure design does not allow any changes to the accessibility map in relative terms (see Figs. 4 and 5). If equity had been the main driver of this plan, more transversal connections should have been included. In summary, it is clearly an improvement over the previous situation, but does not alter the existing differences and the dominant positions of certain cities.
This paper contributes to this field of research by proposing a methodology that addresses issues of both efficiency and spatial equity using an accessibility approach. We believe the method pro-posed in this paper represents a valuable instrument for the deci-sion-making process at strategic levels. It is precisely in these large-scale transport projects where the inclusion of efficiency and equity effects are increasingly in demand by policy makers (Brocker et al., 2010; Lopez & Monzon, 2010). Finally, an interest-ing research avenue stemminterest-ing from this paper is the definition of a procedure to integrate these results into a CBA or MCA frame-work. This could be done by monetarising efficiency and equity ef-fects, or by defining their weight when compared to other criteria.
Acknowledgments
The authors would like to thank the Interministerial Commis-sion of Science and Technology (CICYT) for the financing provided through research Project TRA2007-63564 and the anonymous comments of the reviewers for the improvement of this work.
References
Adler, N., Pels, E., & Nash, C. (2010). High-speed rail & air transport competition: Game engineering as tool for cost-benefit analysis. Transportation Research Part
B, 44(7), 812-833.
Banister, D., & Berechman, Y. (2003). The economic development effects of transport investments. In A. Pearman, P. Mackie, & J. Nellthorp (Eds.), Transport projects
programmes, and policies: Evaluation needs and capabilities. Aldershot: Ashgate.
Baradaran, S., & Ramjerdi, F. (2001). Performance of accessibility measures in Europe. Journal of Transportation and Statistics, 4(2/3), 31-48. Special issue on Methodological issue in accessibility.
Blum, U., Haynes, K. E., & Karlsson, C. (1997). Introduction to the special issue: The regional and urban effects of high-speed trains. The annals of regional science, 31(1), 1-20.
Brocker, J., Capello, R, Lundqvist, L., Meyer, J., Rouwendal, J., Schneekloth, N., et al. (2004). Final report of action 2.1.1. of the European spatial planning observatory network (ESPON) 2000-2006. Christian-Albreschts-Universitat Kiel, Kiel. Brocker, J., Korzhenevych, A., & Schiirmann, C. (2010). Assessing spatial equity and
efficiency impacts of transport infrastructure projects. Transportation Research
Part B, 44, 795-811.
Bruinsma, F. R., & Rietveld, P. (1993). Urban agglomerations in European infrastructure networks. Urban Studies, 30(6), 919-934.
Bruinsma, F. R, & Rietveld, P. (1998). The accessibility of European cities: Theoretical framework and comparison of approaches. Environment and
Planning A, 30, 499-521.
Button, K. J. (1993). Transport economics. Cambridge: University Press.
Campos, J., & de Rus, G. (2009). Some stylized facts about high-speed rail: A review of HSR experiences around the world. Transport Policy, 16,19-28.
Domanski, R. (1979). Accessibility, efficiency and spatial organization. Environment
and Planning, 11,1189-1206.
EC (1999). European spatial development perspective (ESDP): Towards balanced and sustainable development of the territory of the European Union. Committee of Spatial Development, Luxembourg.
Garmendia, M., Urefia, J. M., & Coronado, J. M. (in press). Long-distance trips in a sparsely populated region: The impact of high-speed infrastructures. Journal of Transport Geography. doi:10.1016/j.jtrangeo.2010.06.002.
Geurs, K., & Ritsema van Eck, J. R. (2001). Accessibility measures: Review and applications. Evaluation of accessibility impacts of land-use transportation scenarios, and related social and economic impacts. RIVM Rapport 408505006, RIVM. Bilthoven, The Netherlands.
Geurs, K., & Ritsema van Eck, J. R. (2003). Evaluation of accessibility impacts of land-use scenarios: The implications of job competition, land-land-use, and infrastructure developments for the Netherlands. Environment and Planning B: Planning and
Design, 30, 69-87.
Geurs, K. T., & van Wee, B. (2004). Accessibility evaluation of land-use and transport strategies: Review and research directions. Journal of Transport Geography, 12(2), 127-140.
Givoni, M. (2006). Development and impact of the modern high-speed train: A review. Transport Reviews, 26(5), 593-611.
Gutierrez, J. (2001). Location, economic potential and daily accessibility: An analysis of the accessibility impact of the high-speed line Madrid-Barcelona-French border. Journal of Transport Geography, 9(4), 229-242.
Gutierrez, J., Gonzalez, R., & Gomez, G. (1996). The European high-speed train network: Predicted effects on accessibility patterns. Journal of Transport
Geography, 4(4), 227-238.
Gutierrez, J., Monzon, A., & Pinero, J. M. (1998). Accessibility, network efficiency, and transport infrastructure planning. Environment and Planning A, 30, 1337-1350.
Halden, D. (2003). Accessibility analysis: concepts and their application to transport policy, programme and project evaluation. In A. Pearman, P. Mackie, & J. Nellthorp (Eds.), Transport projects programmes and policies: Evaluation needs
and capabilities. Aldershot: Ashgate.
Hay, A. (1993). Equity and welfare in the geography of public transport provision.
Journal of Transport Geography, 1(2), 95-101.
Holl, A (2007). Twenty years of accessibility improvements: The case of the Spanish motorway building programme. Journal of Transport Geography, 15(4), 286-297.
Kobayashi, K., & Okumura, M. (1997). The growth of city systems with high-speed railway systems. Annals of Regional Science, 31(1), 39-56.
Laird, J. J., Nellthorp, J., & Mackie, P. (2005). Network effects and total economic impact in transport appraisal. Transport Policy, 12, 537-544.
Lopez, E., Gutierrez, J., & Gomez, G. (2008). Measuring regional cohesion effects of large-scale transport infrastructure investments: An accessibility approach.
European Planning Studies, 16(2), 277-301.
Lopez, E., & Monzon, A. (2010). Integration of sustainability issues in strategic transportation planning: A multi-criteria model for the assessment of transport infrastructure plans. Computer Aided and Civil Infrastructure Engineering, 25, 440-451.
Lopez, E., Monzon, A., Ortega, E., & Mancebo, S. (2009). Assessment of cross-border spillover effects of national transport infrastructure plans: An accessibility approach. Transport Reviews, 29(4), 515-536.
Martin, F. (1997). Justifying a high-speed rail project: Social value vs. regional growth. The Annals of Regional Science, 31,155-174.
Martin, J. C, Gutierrez, J., & Roman, C. (2004). Data envelopment analysis (DEA) Index to measure the accessibility impacts of new infrastructure investments: The case of the high-speed train Corridor Madrid-Barcelona-French Border.
Regional Studies, 38(6), 697-712.
Martinez, H., & Givoni, M. (2009). The accessibility impact of a new High-speed Rail line in the UK - A preliminary analysis of winners and losers working paper N° 1041, Transport studies unit. School of Geography and the Environment, University of Oxford.
Ministerio de Fomento (2005). Plan estrategico de infraestructuras y transporte 2005-2020 (PEIT). Secretaria de Estado de Infraestructuras y Planificacion, Direction General de Planificacion y Coordination Territorial, Madrid. Peters, D. (2003). Cohesion, policentricity, missing links and bottlenecks: Conflicting
spatial storylines for Pan-European transport investments. European Planning
Studies, 11(3),
317-339.
Plassard, E. (1991). Le train a grande Vitesse et le reseau des villes. Transports, 345, 14-22.
Pol, P. M. J. (2003). The economic impact of the high-speed train on urban regions. European regional science association econpapers. <http://www.ersa.org> (Retrieved 06.12.09).
Puga, D. (2002). European regional policy in light of recent location theories. Journal
of Economic Geography, 2(4), 372-406.
Reggiani, A. (1998). Accessibility, trade and location behaviour. Aldershot: Ashgate. Rietveld, P., & Nijkamp, P. (1993). Transport and regional development. In J. Polak &
A. Heertje (Eds.), European transport economics, European conference of ministers
of transport (ECMT). Oxford: Blackwell Publishers.
Roman, C, Espino, R., & Martin, J. C. (2010). Analyzing competition between the high speed train and alternative modes: The case of the Madrid-Zaragoza-Barcelona Corridor. Journal of Choice Modelling, 3(1), 84-108.
Talen, E. (1998). Visualizing fairness: Equity maps for planners, journal of the
American Planning Association, 64(1), 22-49.
Talen, E., & Anselin, L. (1996). Assessing spatial equity: An evaluation of measures of accessibility to public playgrounds. Environment and Planning A, 30, 595-613. Urena, J. M., Garmendia, M., Coronado, J. M., Vickerman, R., & Romero, V., (2010).
New metropolitan processes encouraged by high-speed rail: The cases of London and Madrid. In 12th WCTR, Lisbon-Portugal proceedings.
Urena, J. M., Menerault, P., & Garmendia, M. (2009). The high-speed rail challenge for big intermediate cities: A national, regional and local perspective. Cities, 26(5), 266-279.
van den Berg, L., & Pol, P. M. J. (1998). The urban implications of the developing European high-speed-train network. Environment and Planning C: Government
and Policy, 16(4), 483-497.
van Winden, W., van der Berg, L., & Pol, P. (2007). European cities in the knowledge economy: Towards a typology. Urban Studies, 44(3), 525-549.
Vickerman, R, Spiekermann, K., & Wegener, M. (1999). Accessibility and economic development in Europe. Regional Studies, 33(1), 1-15.