and education use, including for instruction at the authors institution
and sharing with colleagues.
Other uses, including reproduction and distribution, or selling or
licensing copies, or posting to personal, institutional or third party
websites are prohibited.
In most cases authors are permitted to post their version of the
article (e.g. in Word or Tex form) to their personal website or
institutional repository. Authors requiring further information
regarding Elsevier’s archiving and manuscript policies are
encouraged to visit:
ContentslistsavailableatSciVerseScienceDirect
Ecological
Modelling
j ou rna l h o m e pa ge :w w w . e l s e v i e r . c o m / l o c a t e / e c o l m o d e l
Modelling
the
spatio-temporal
pattern
of
primary
dispersal
in
stone
pine
(
Pinus
pinea
L.)
stands
in
the
Northern
Plateau
(Spain)
Rubén
Manso
a,∗,
Marta
Pardos
a,
Christopher
R.
Keyes
b,
Rafael
Calama
a aDpto.SelviculturayGestiónForestal,CIFOR-INIA,Ctra.LaCoru˜nakm7.5,28040Madrid,SpainbDepartmentofForestManagement,CollegeofForestry&Conservation,UniversityofMontana,Missoula,MT59812,USA
a
r
t
i
c
l
e
i
n
f
o
Articlehistory: Received19April2011 Receivedinrevisedform 21November2011 Accepted25November2011
Keywords: Inversemodelling Fecundity Crowneffect Seedlimitationindexes Climatecontrol Regenerationfellings
a
b
s
t
r
a
c
t
Naturalregenerationinstonepine(PinuspineaL.)managedforestsintheSpanishNorthernPlateauis notachievedsuccessfullyundercurrentsilviculturepractices,constitutingamainconcernforforest managers.Wemodelledspatio-temporalfeaturesofprimarydispersaltotestwhether(a)presentlow standdensitiesconstrainnaturalregenerationsuccessand(b)seedreleaseisaclimate-controlledprocess. Thepresentstudyisbasedondatacollectedfroma6yearsseedtrapexperimentconsideringdifferent regenerationfellingintensities.Fromaspatialperspective,weattemptedalternateestablishedkernels underdifferentdatadistributionassumptionstofitaspatialmodelabletopredictP.pineaseedrain.Due toP.pineaumbrella-likecrown,modelswereadaptedtoaccountforcrowneffectthroughcorrectionof distancesbetweenpotentialseedarrivallocationsandseedsources.Inaddition,individualtreefecundity wasassessedindependentlyfromexistingmodels,improvingparameterestimationstability.Seedrain simulationenabledtocalculateseeddispersalindexesfordiversesilviculturalregenerationtreatments. Theselectedspatialmodelofbestfit(Weibull,Poissonassumption)predictedahighlyclumpeddispersal patternthatresultedinaproportionofgapswherenoseedarrivalisexpected(dispersallimitation) between0.25and0.30forintermediateintensityregenerationfellingsandover0.50forintensefellings. Todescribethetemporalpattern,theproportionofseedsreleasedduringmonthlyintervalswasmodelled asafunctionofclimatevariables–rainfallevents–throughalinearmodelthatconsideredtemporal autocorrelation,whereasconeopeningtookplaceoveratemperaturethreshold.Ourfindingssuggest theapplicationoflessintensiveregenerationfellings,tobecarriedoutafteryearsofsuccessfulseedling establishmentand,seasonally,subsequenttothemainrainfallperiod(latefall).Thisschedulewould avoiddispersallimitationandwouldallowforacompleteseedrelease.Thesemodificationsinpresent silviculturepracticeswouldproduceamoreefficientseedshadowinmanagedstands.
© 2011 Elsevier B.V. All rights reserved.
1. Introduction
Pinuspinea is an essential species of Mediterranean
ecosys-temsthatprovidesimportanteconomicbenefitstolocalpopulation fromitsedibleseedproductionandtimberproduction.Inaddition, thespeciesplaysavaluableecologicalroleasitsnatural distribu-tionoccupieschallengingsitesthatexhibitgeneralMediterranean weatherconditions,continental wintersand highly sandysoils, wherefewarborealspeciespersist.Suchanenvironmentcanbe oftenfoundthroughouttheSpanishNorthernPlateau(Pradaetal.,
1997), which accounts for more than 50,000ha of indigenous
∗Correspondingauthor.Tel.:+34913471461;fax:+34913476767. E-mailaddresses:[email protected],[email protected]
(R.Manso),[email protected](M.Pardos),[email protected](C.R.Keyes), [email protected](R.Calama).
P.pineaforests.Thesestandshavebeenmanagedforoveracentury
throughmodernsilviculturetechniques.
P.pineanaturalregenerationhasbecomeaprimaryconcernfor
forestmanagement.LikeotherMediterraneanspecies(e.g.species ofgenusQuercus),naturalregenerationiscommonlyunsuccessful undercurrentlyappliedsilviculturalsystems(seedtreemethod, and,increasingly,shelterwoodmethod),whichleadtolow den-sitiestooptimizeconeproductionpertree.Regenerationfellings derivedfromthesetreatmentsproduceeven-agednon-coetaneous standsastheyintendtoimitatenaturalforestdecayleading gen-erallytothesestructures(Schütz,2002).Severalfactorshavebeen notedasdeterminantsofthisregenerationfailure,including: cli-mate,andspecificallyseveresummerdroughtsandhighsummer temperaturesthatleadtoestablishmentfailure;mastinghabitand lackofsynchronywithregenerationfellingsandadequateyears forseedlingestablishment;intensiveconeharvesting,resultingin depauperateseedbanksprior toregenerationfelling;long rota-tions,inducingpoorseedcropsduringtheregenerationperioddue
totreevigourdecline;thespecies’ gravity-basedseed dispersal strategy,resultinginpatchyseeddistribution;andpost-dispersal seedpredation(CalamaandMontero,2007;Barbeitoetal.,2008;
Mansoetal.,2010).
The study of primary seed dispersal spatial patterns has focused on understanding the general mechanisms that con-trolfundamentalpopulationdynamics(Clarketal.,1998,1999b;
Nathan et al., 2002; Levin et al., 2003; Muller-Landau et al.,
2008; Martínezand González-Taboada, 2009),or their
ecologi-cal consequencesin localcircumstances (Ordó ˜nez et al., 2006;
Santoset al., 2006; Debain et al., 2007; Gómez-Aparicio et al.,
2007;Sagnard et al., 2007). Similarly, moststudies aboutcone
openingprocesseshavemainlyaimedtotesttherelative impor-tanceofpyriscenceandxeriscence strategiesfromanecological perspective (Nathan et al., 1999, 2000), evolutionary perspec-tive(Tapiasetal.,2001)andstructuralperspective(Nathanand
Ne’eman,2004).Withfewexceptions(suchasTsakaldimi etal.
(2004)or Ganatsas and Thanasis (2010)),little effort hasbeen
undertaken to apply the valuable information generated from ecologicalstudiestoinformpracticesofpromotingnatural regen-eration.
Thedensityofseedsdepositedinaparticularlocationwithina standisafunctionofstandstockingandthespatialarrangement oftrees(source),andofseedproductionandthecapacityforseed dispersaloverlongdistances(Clarketal.,1998).Providedthatthe latterisaseriousconstraintforcolonizationinP.pinea,duetothe species’largewinglessseed(Magini,1955),adeeperknowledge ofseeddispersalspatialtraitscanofferessentialinformationwith referencetothesuitabilityofcurrentdensitiesinstandsafterseed fellingsfornaturalregeneration.Lowstockingspromoteahigher coneproductionpertree(Calamaetal.,2008)butmayresultin aseedarrivallimitation(dispersallimitation).Ontheotherhand, densestandslargelyfavoranevendistributionofseedsbutmay contributetoinsufficientseedproduction(seedlimitation). Opti-maldensitieswouldleadtoacompromisebetweenbothsituations, withacceptabletrade-offsinbothseedproductionandseed disper-sal.Becauseconeopeningisrelatedtophysicalvariables(Dawson etal.,1997),accuratepredictionsofseedreleaseratesbasedon cli-matevariableswouldallowforoptimizedtemporalregeneration fellingschedules.
In thepresentstudy,anestablishedmethodology toanalyze thespatialpatternofseeddispersalwasused.Themethodology, introducedbyRibbensetal.(1994)tostudythespatialdistribution ofseedlingsfromseedsourcelocations,utilizesinversemodelling proceduresinordertoestimatethesummedseedshadowfrom datacollectedinaseedtrapexperiment.Althoughbroadlyapplied (Clarketal.,1998,1999b;Uriarteetal.,2005;Debainetal.,2007;
Sagnardetal.,2007;Nanosetal.,2010),theapproachisnot
with-outcontroversy,especiallywithregardtotheexperimentaldesign (Clarketal.,1999a).Recently,comparisonscarriedoutwithseed dispersalkernelsattainedfromgeneticanalysisdemonstratedthat traplocationcandramaticallybiasparameterestimation
(Robledo-ArnuncioandGarcía,2007).Furthermore,amorestableandreliable
estimationisachievedifthefittingprocessisindependentofthe fecundityparameter.Ithasalsobeenarguedthatother consider-ations,suchasthebiasintroducedbyimmigrantseeds(i.e.from nomapped sources), should be taken into account (Jones and
Muller-Landau,2008).ForP.pinea,however,therelativelyshort
dispersaldistance(Rodrigoetal.,2007)andtheavailabilityof exist-ingmodelstoindependently estimateseed production(Calama
etal.,2008)severelyreduceparameterizationstabilityproblems,
andimmigrantseedsoccurrencecanbesafelyconsidered negligi-ble.Inaddition,potentialbiasderivedfromtraplocationcanbe minimizedwithasensibletrapdeploymentinordertoobtaina largerrepresentationofcritical(andmorerelevant)dispersal dis-tances.
Alternativekernelsestimatedbyinversemodellinghavebeen recentlyproposedbasedondifferentassumptionsthatdeal bet-terwithspeciesspecificdispersalfeatures.Mechanisticapproaches (GreeneandJohnson,1989;StoyanandWagner,2001;Wrightetal.,
2008)werespecificallydevelopedtomodelwinddispersedspecies
kernels. From a non-mechanistic perspective, different variants of the Weibull distribution have been assessed (Ribbens et al.,
1994; Clark et al., 1998),while improvementson those
meth-ods were attained to manage its specific rigid behavior (Clark
etal.,1999b;BullockandClarke,2000).Eventually,otherempirical
approachescomprisinggeneticprocedureshavebeendevelopedto obtainmoreaccuratepredictions(González-Martínezetal.,2006;
Robledo-ArnuncioandGarcía,2007).Forourstudy,wetestedand
compared theperformance of alternative models,sensu Debain
etal.(2007),selectedaccordingtoP.pineaspecificdispersal
syn-drome,asausefulprotocoltoachievethebestfitand,consequently, acorrectinterpretationofthephenomena.Additionally,from sim-ulationsassessedthroughthemodelofbestfit,wecalculatedand comparedsourceabundanceanddispersallimitationindexvalues (Clarketal.,1998;Muller-Landauetal.,2002)underP.pinea’stwo mostcommonregenerationfellingsystemsandacontrolstand(i.e. priorfellings).
Themainaimsofthepresentworkweretounderstand,model andpredictthespatio-temporalpatternsoftheprimarydispersal
inP.pineamanagedstandsintheSpanishNorthernPlateau.The
purposewastoidentifythelikelybottlenecksoccurringduringthe firststepofthenaturalregenerationprocess.Ourhypotheseswere (a)thatcurrentstanddensitiesatrotationageinmanagedP.pinea forestsconditionnaturalregenerationsuccess,and(b)thereexists a climatecontrolonthetemporal patternof primarydispersal, similartothephenomenondrivingconeproduction(Mutkeetal.,
2005a;Calamaetal.,2011).Ourfindingswillserveasanessential
toolforforestmanagersattemptingtoachievesatisfactorynatural regenerationofP.pinea.
2. Materialsandmethods
2.1. Studysite
The study site is located at 700m a.s.l. in a representative
P. pinea stand onthe flat sandy soils of the Northern Plateau,
Spain.Thestudywasperformedina120-year-oldeven-agedpure standin CorbejónyQuemadospublicforest(41◦28N,4◦43W). Site location was selected and regeneration felling treatments designedtorepresenttypicalconditionsinamaturemanaged for-est,whenrestrictionsonconecollectionforcommercialpurposes arecommonlyimposedtoallowforseedrainandregeneration. Regenerationfellingscommencedduring2002–2003followingthe highly intensive seed tree method(ST) and the more progres-siveshelterwoodmethod(SW).Bothsystemshavebeenbroadly applied as regeneration treatments for the species. Pre-felling and post-felling standdensities are shown in Table1. Climate iscontinental-Mediterranean.Meanmonthlytemperaturesrange from4.0◦C inJanuaryto21.7◦CinJuly.Meanannual precipita-tionis435mm,withaperiodofsummerdrought(July–September meanprecipitationof66mm).Siteindexis15–16mat100years, characteristicofaIIclassquality(Calamaetal.,2003).Thisindex definesthequalityofastandasafunctionofitsdominantheight ataparticularage.Theconsidereddominantheightcriterionwas theheightofthosetreeswhosediameteratbreastheight(1.3m; “dbh”)wasincludedamongthe20%ofthethickesttreesofthestand (Weise,1880).
Table1
Summaryofstanddensities.
Plot Treatment Nb/fc(ha−1) Nd(ha−1) BAe(m2/ha) Dgf(cm) Hg(m) FCCh(%)
1 STa 144 46 8.17 47.6 13.6 19
2 ST 115 48 9.37 49.9 15.5 22
3 ST 156 46 6.99 44.1 12.6 14
4 SWb 192 73 10.82 43.4 14.1 31
5 SW 233 75 9.70 40.6 12.9 30
6 SW 169 75 12.26 45.6 15.8 34
7 Control 149 149 18.42 40.1 13.8 70
aST—seedtreemethod. b SW—shelterwoodmethod.
c Nb/f—densitypriorfellings.Afterfellings. d N—remainingdensity.
eBA—basalarea.
f Dg—quadraticmeandiameter. gH—averageheight.
h FCC—forestcanopycover.
2.2. Experimentaldesign
Theprimarydispersaltrialwasinstalledin2005,toallowfor astandresponsetofellingsinconeproduction.Itconsistedofsix 60m×80m(0.48ha)sampleplotsthatwereestablishedunder dif-ferentstanddensitiesproducedbyregenerationfellings.Densities inplots1–3wererepresentativeoftheSTmethod,whereasthose inplots4–6weredistinctiveoftheSWmethod.Ontheonehand, thesetreatmentsprovidedaconvenientrangeofstanddensities, essentialformodellingpurposes.Ontheotherhand,theyofferan excellentframeworkforfurthermodelsimulation.A7.5mbuffer areawasincludedaroundeachplot,increasingtheoverallplot sur-faceupto0.7ha.Anavailablecontrolplot(nofellings)ofidentical dimensionswasusedexclusivelyforsimulationpurposes.Graphic informationaboutplotscanbefoundinFig.A.1inAppendixA.
Alltreeswithinplotswerestemmappedandmeasured.Tree measurements included dbh, total height, and 4 perpendicular crownradiiincardinaldirections.
InMay2005,asystematicgrid(17.7m×17.7m)often circu-larseedtrapsof0.25m2 wasestablishedwithineach ofthesix plots(controlexcluded).Twotrapsinplot1weredestroyedatthe beginningoftheexperimentandwerediscardedfromthe analy-sis.Theshortestdistancefromatraptoplotboundarywas12m. Thetrapdesignwasabagmadeoftextilefinemeshstapledon threewoodensticksat1mabovetheground(topreventrodent predation).Trappedseedswerecollectedon60occasionsfromtrap deploymenttoJanuary2011atintervalsaveraging34.6days(range from19to70,standarderror1.26),withlongestintervals corre-spondingtolowintensityseedrainmonthsordifficultaccessto plots(winter).
2.3. Modellingthespatialpattern
2.3.1. Theinversemodellingapproach
In order to determine the spatial pattern of dispersal, an approach based on non-mechanistic models involving inverse modellingprocedureswasattempted(sensuRibbensetal.,1994). Withthistypeofmodel,theseedshadowiscalculatedasthe prod-uctoftwofactors:thekernelandsourcefertility.Thefirstfactor, thekernel(kij),representstheprobabilitythataseedisprimary dispersedtolocationi,givenasourcejandtravelling,isotropically, adistancerij(m).Thekernelimpliesparameterstobeestimated whichcontroltheshapeofthecurveasafunctionofdistance.The secondfactoris thefertilityofthesource.Inourapproach, the modeldevelopedbyCalamaetal.(2008)isusedtoestimateaverage coneweight(wcj)duringthestudiedperiod(2005–2010)foreach individualtreej.Ratherthanestimateaparametertoobtainthe numberofseedsfromtheresponsevariableoftheaforementioned
model,weusedthemodeldevelopedbyMorales(2009)topredict thenumberofseedsperkgofcones(P).Pwascalculated consider-ingaconstantfractionofconeweightattributabletoseeds(0.259) andassuminganaverageseedweightof0.615g.Consequently,the valueNij(seeds/m2)ofthegenericseedshadowforasingletreej atalocationiisdefinedas:
Nij=P·wcj·k(rij) (1)
Inthecaseofnon-discretesources(e.g.astand),thenumberof seedsreachingalocationiiscomputedasthesumoftheexpected numberofseedsdispersedtothislocationfromtheTtrees con-sidered.Inthatcase,thesummedseedshadowcanbeexpressed as:
Ni=P· T
j=1
wcj·k(rij) (2)
Notethatdefinitionofthesummedseedshadowleadsto indi-vidualtreekernelparameterization.
2.3.2. Sourcedetermination
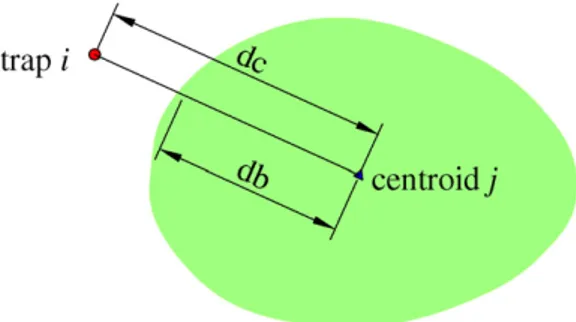
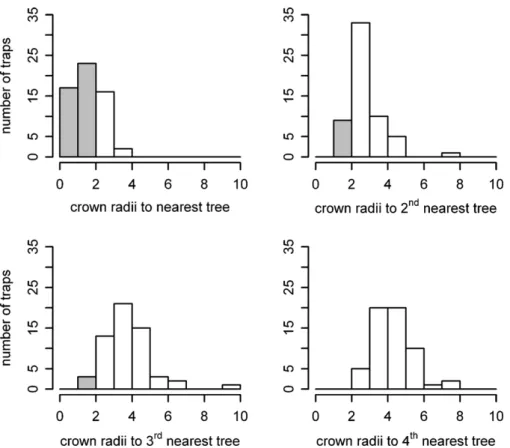
Formodellingpurposes,weoptimizedthenumberofsources T tocontribute tothesummedseed shadowata specific loca-tion.Therefore,weinitiallyplottedtheinversecumulativerateof seedarrivaltoeachtrapalongnormalizeddistances(totaldistance betweenatrapiandatreej(dc)/crownradiusdimension(db))to thenearesttree.Crownradiiwerecalculatedasthedistancefrom thecrowncentroidjtodriplineinthedirectionofthetrapi(Fig.1). Suchsimplificationindicatesboththedegreeofclumpingofdata andtherelativedistanceoftrapsnoreceivingseedstotheclosest tree.Thelatterdefinesthemaximumrelativedispersaldistance foundfromthedataavailable(2crownradii).Thus,theprocedure tooptimizetheTcontributorseedsourceswastoexcludefrom analysistreeslocatedoveradistanceof2crownradiifromtraps.
Fig.2.Histogramsoffrequencyforrelativedistancesfromtrapitotheclosest1st,2nd,3rdand4thtreej.Distancesbelow2crownradiiaregreycolouredforclarity.Note thatthe4thnearesttreewasalwaysfurtherthan2crownradii.Meancrownradiuswas3.5m.
Todoit,wecalculatedtheempiricaldistributionofdistancesin crownradiifromeachtraptothestemofthenearest1sttoTth tree.Then, Twasconsideredoptimumwhenthedistributionof distancesbetweentrapsandtheTth+1nearesttreeonlyincluded figuresover2crownradii,resultinginT=3(Fig.2).
2.3.3. Distancedefinition
Inordertoaccountforcrowneffectinthekernelvalue assign-ment, we computed standardized distances between traps and sources,normalizingthebeneath-crownsegmentdbtoan aver-agecrownradius(R),leavingtherest(beyondcrown)unaltered. Whenatrapwaslocatedbeneathacrownshadow,itsdistanceto sourcewasassessedasthecorrespondingproportionofR.Inturn, beneath-crowndistancesareslightlyrescaled,whereastwopoints locatedatthesamedistancetodriplineofequallyproductivetrees ofdifferentcrownsizesareconsideredtobereachedbythesame numberofseeds.Correcteddistancerij(m)analyticdefinitionis then:
(dc−db)+R¯ (dc/db)·R¯
ifthetrapisbeyondcrown
ifthetrapisbeneathcrown (3)
wheredbistherealcrownradiuslength;dcisthedistancebetween thecentroidoftreejandthetrapi.
2.3.4. Kernelformulation
Inordertoestimatetheseedshadowthatbestfitthedata,two kernelsweretested:theWeibull(Clarketal.,1998),andthe2Dt model(Clarketal.,1999b).Parameterestimationwasperformed throughthe optimizationof the log-likelihood functionfor the assumedtheoreticaldistributionofdata,throughavariantofthe simulatedannealingalgorithm(Belisle,1992).
TheWeibullkernelcanbere-formulatedas:
kij= 1 nexp
−
rij ˛
c(4)
where˛isthedispersalparameter,cistheshapeparameter,nis thenormalizer:
n=2··˛2·(2/c) c
with(·),thegammadistribution.
Shape parameter c is assessed together with ˛ in the log-likelihood maximization. Nevertheless, whenever optimization becomesunstableweassumed,likeClarketal.(1998),aGaussian curve(c=2).
Ontheotherhand,the2Dtkernelconsistsofareformulationof theWeibullcurvewithc=2,allowing˛tovaryalongrij:
kij= u
·p·(1+(r2ij/p))(u+1)
(5)
whereuisthescaleparameter,pistheshapeparameter.
2.3.5. Likelihoodfunctions
Parameters involvedin both kij formulations were achieved throughlog-likelihoodmaximizationofEq.(2),undertwo alter-nativehypotheses(Poissonandnegativebinomial)withrespectto thestochasticprocessofseedarrival.Inthecaseofthe2Dtmodel, onlythePoissonhypothesiswasused.Poissonandnegative bino-miallog-likelihoodsadaptedbyRibbensetal.(1994)andClarketal.
(1998),respectively,areexpressedas:
log=
i
log=
i
(log(yi+)−log(yi+1)−log()+yi·logNi
+·log−(yi−)·log(Ni+)) (7)
whereisthelikelihoodfunctiontomaximize,yiistheobserved numberofseedscollectedfromthetrapi,Niistheexpected num-berof seedsin trapi, is theclumping parameter,(·)is the gammadistribution.Maximizationofthelog-likelihoodfunctions wasassessedusingthedatafromalltrapssimultaneously.
2.3.6. Modelevaluation
Comparisons between models were performed through the AkaikeInformationCriterion(AIC)totestmodelaccuracyandselect thatonewhichbestfittedthedata.Wealsocomputeda regres-sionbetweenobservedandexpectedseeddensityvalues,testing whethertheinterceptandslopedifferedsignificantlyfrom0and1, respectively(H0:intercept=0,slope=1),asameasureofthelevelof concordancebetweendataandmodel.Inaddition,thecoefficient ofdeterminationforthisregressionwascalculated,assuggested byClarketal.(1998).
2.3.7. Seedlimitation
Forthetwoproposedregenerationfellingtreatmentsand con-trol,wetestedwhetherchangesindensity(post-harvestingbasal area)couldleadtoseverevariationsinseedavailability(inregard toboth abundance and occurrence).Thiswas accomplishedby computingthesourcelimitationindex,orSL,andthedispersal lim-itationindex,orDL(Clarketal.,1998;Muller-Landauetal.,2002). SLisexpressedastheproportionofsiteswherenoseedsarrive assumingthatthetotalamountofseedsisdistributeduniformly:
SL=1−Pr
ˆ
Ni>0|Poisson Nˆi
⁄
l=e− Nˆi
⁄
l(8)
with ˆNi,theexpectednumberofseedsreachingthelocationi,andl, thenumberoflocationstakenintoconsideration.DLcanbedefined asthecomparisonbetweentheproportionofsitesactuallyreached bydispersedseedsandtheproportionoflocationswhereseeds wouldarriveifdispersalwereuniform,whereaisthenumberof pointsreachedbyatleastoneseed:
DL=1−
a/l 1−SL
(9)
Usingthebestmodel,weassessedasimulatedseedrainat1m2 scalethroughout2501points(l)locatedin aregulargridinthe central41m×61mrectangleofeachplot.Regardingmodel con-sistence,distancesbetweensimulationpointsandtreesmustbe modifiedsimilarlytoEq.(2).ThesesimulationsallowedforSLand DLcalculationthroughoutallplots,includingthecontrol.
2.4. Modellingthetemporalpattern
Inordertomodelseeddispersalfromatemporalperspective, thetotalseedcollectedintrapsduringeachdatacollectioninterval wasgraphicallycomparedwiththatperiod’smeanclimate vari-ables,includingmeantemperature,maximumtemperature,mean relativehumidityandtotalprecipitation.Basedonthisanalysis,the mostsuitablevariableswereselectedtocontroltheprocessofcone opening.AllclimatedatawereachievedfromOlmedo meteorolog-icalstation(coordinates41◦1734N,4◦4058W).
Concerningseedrelease,weconstructedaresponsevariable(sr) relatedtothetotalamountofcollectedseedsthatalsoaccounted fortheseasonallydecreasingaerialseedbankovertime, asthe percentageofseedsreleasedin aparticularperiodwithrespect tothetotalamountofseedsremainingin thecone.Thenature oftheresponsevariable(apercentage)rendersit insensitiveto
extremelylowconecrops,thusweonlyconsideredyearsof appre-ciablecropsintheanalysis(i.e.2006–2007,2007–2008,2008–2009 and2010–2011).Significantdifferencesamongyieldswere deter-minedviathenon-parametricKruskal–Wallistestfornon-normal data(˛=0.05).
Agraphicalanalysiswasalsoundertakentoidentifyprior rela-tionships betweenclimatevariables and sras a basis tomodel srthrough asimplelinearregression.In ordertoprevent unre-alisticconfidenceintervalsfortheparameters,anauto-regressive errorstructurewasappliedwithindispersal periods,due tothe fact that theobservations oftheresponse variable are intrinsi-callyautocorrelatedfromatemporalperspective.Inaddition,those caseswheresr=100werenotusedintheregressionasitisa con-stantthroughoutallterminalvaluesofeverydispersalperiodwith no ecologicalmeaning. Eventually,potential transformations in explanatoryvariableswerecarriedoutwhennecessarytolinearize therelationship.Modelevaluationwasperformedcomparingthe AICofalternativemodels.
Allstatisticalanalysesandcalculationsinthisstudywere per-formedinR2.12.0(RDevelopmentCoreTeam,2009).
3. Results
3.1. Seedrain
During the dispersal periods from 2005to 2010, 753seeds werecollectedintheseedplots.Thespatialdistributionoftrapped seedswasnotuniform.24traps(41%)werenotreachedbyany seed during all periods. The Kruskal–Wallistest indicated sig-nificant differences among years in number of seedscollected (2=48.6924, p-value<0.0001). Dispersal was especially scarce (non-appreciable)during2005–2006(6seeds)and2009–2010(7 seeds);higheryieldsoccurredduring2008–2009(29seeds)and 2010–2011 (73seeds). In contrast, 2006–2007(237 seeds) and 2007–2008(401seeds)werestrongmastingyears.Statisticsper traparesummarizedinTable2.
ConeopeningtookplaceduringJuneandJulyallyears,when seedsreachingtrapsincreasedconsiderably.Concerningthe pro-gressiveseed releaseafteropening,although a strongdispersal peakoccurredatthebeginningofeachdispersalperiod,arelative maximumatadvancedstagesoftheprocessaroseasacommon featurefor allyears holdingappreciableyields(Fig.3).Notably, in2006alargeportionoftheyear’sdispersedseedsfellduring November.Thesametrendoccurredin2007,whenahigh percent-ageoftheyear’sseedfallwascollectedduringSeptember.In2008, thepeakoccurredinOctober,whilein2010twolatemaximawere recordedinSeptemberandNovember.Duringtheyearsof appre-ciableconecrop,thosedatacollectionintervalsoflesserseedrain intensityshowedaresidual(non-null)dispersalrate,withonlyfour lagswherenotrappedseedswerefound.
3.2. Spatialpattern
TheWeibullmodelconsideringaPoissondistributionofdata (henceforthW.P)provedthemostaccurate,withthelowestAIC value,togetherwiththe2Dtmodel(Table3).Themaximizationof thenegativebinomiallog-likelihoodfunctionfortheWeibullcurve (hereafterW.NB)presentedhighinstabilityinparameter estima-tionevenfixingc.Theclumpingparameterinthenegativebinomial hadatrendtolargevalues(>100),meaninglackofoverdispersion inthedata.
Table2
Mainannualseeddispersalstatisticspertrapandseedraindensity(seeds/ha).
Period 2005–2006 2006–2007 2007–2008 2008–2009 2009–2010 2010–2011
Mean 0.10 4.09 6.91 0.50 0.12 1.26
SDa 0.36 9.24 11.65 1.23 0.46 2.57
CIb(95%) ±0.09 ±2.38 ±3.00 ±0.32 ±0.12 ±0.66
Seeds/ha 4137.93 163448.28 276551.72 20000.00 4827.59 50344.83
aSD:standarddeviation. bCI:confidentintervals.
Fig.3.Numberofseedstrapped(solidline),monthlymeanrelativehumidity(dottedline)andmonthlymeantemperature(dashedline)during2005–2010.
Table3
Estimatedparameters,AICandlog-likelihood(log)forthefittedmodels.Inbolds,thelowestAIC.Coefficientofdetermination(r2)amongobservedandpredictedvalues foreachmodelisalsoshown.
˛ c u p AIC r2 log
W.P 3.308 2.065 – – 2358.300 0.428 −1177.150
2Dt – 2a 24.837 253.6 2358.758 0.424 −1117.379
aFixedparameter.
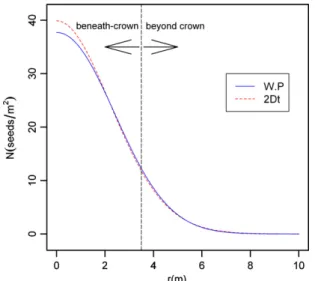
proposedapproaches.Basically,themodelsdifferedinseed disper-salestimationatshortdistances(beneathcrown)withexpected densityatsourcerangingfrom39.89(2Dt)to37.71seeds/m2(W.P), asillustratedinFig.4foranaveragetreewitha3.5mcrownradius. Theprobabilitythataseedisdispersedbeyondcrownvariedfrom 0.312(W.P)to0.310(2Dt).Beyond3.5mfromthedripline(2mean crownradii),theprobabilitywaslessthan0.01forallmodels, indi-catingahighlyaggregatedspatialpattern(Fig.5).
Ahighlevelofagreementbetweenmodelanddatawasfoundin thecaseoftheW.Pmodel.AsshowninFig.6andTable3,therewere
Fig.4. Comparisonofseeddensitycurvesproducedbythefittedmodelsforan averagetreewithcrownradiusR.
noevidencesforrejectingthenullhypothesisofalinear relation-shipwithslope=1(p-value>0.05)andintercept=0(p-value=0.24) amongobservedandexpectedvalues.Coefficientsofdetermination betweenthemintheW.Pand2Dtmodelsweresimilar(Table3), exhibitingrelativelylowvalues.
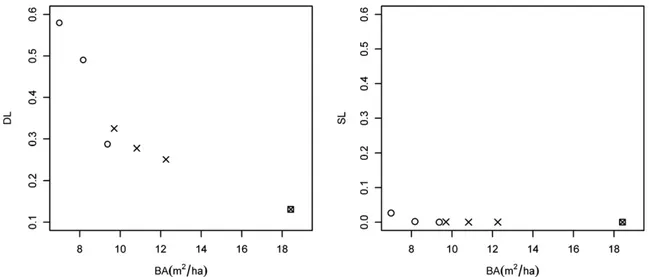
Simulations to calculate limitation indexes were performed withtheW.Pmodel(Fig.4).Sourcelimitationindex(Fig.7) indi-catedthatlimitationduetoseedavailabilitywasnegligibleforall plots(SL<0.005),implyingthatunderauniformseedrain,mostof thespacewould bereached. Dispersallimitationshoweda ten-dency for lower values as basal area increased(Fig.6). Atlow densities(basalarea<9m2/ha;plots3and1),DLwas0.58and0.49, respectively;itwas0.32(plot5),0.29(plot2),0.28(plot4)and0.25 (plot6),wherebasalareawasbetween9and13m2/ha.DLinthe controlplotwas0.13(basalarea=18.4m2/ha).
3.3. Temporalpattern
Anexploratoryanalysisofdifferentclimatevariablesshowed thatconeopenedwhenmeantemperatureofdatacollection inter-vals(mostlymonthly)reached19–20◦C(Fig.3).However,when consideringthesubsequentseedrelease,therewasnoapparent relationshipofthenumberofharvestedseedstotemperature vari-ablesormeanrelativehumidity.
Onthecontrary,whentakingintoaccountthepercentageof seeds fallen during the collecting interval related to the over-all amountof seeds tobe released at theend of thedispersal period(sr),asynchronicpatternwithtotalprecipitationwasfound (Fig.8;anomalousvaluesinthistrendwerethosecorresponding toFebruaryandMarchof2007).
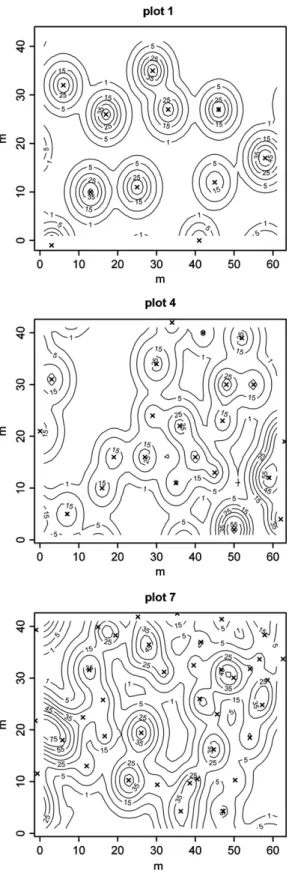
Fig.5.Examplesofseedshadowmapsforplot1(STtreatment),plot4(SW treat-ment)andplot7(control).Crossescorrespondtostemslocations.Linesrepresent levelsofequalpredictedseeddensity(valueindicatedbythefigurewithinlines).
as the explanatory variable (see Table 4, Fig. 9). A slight improvementintheAICvaluewasobtainedwhenan autoregres-sivestructure (AR-1) wasapplied withineach dispersal period (rangingfrom285.939withoutstructure to284.538with struc-ture).
Fig.6.Observedvsexpectedseedshadowintrapsi.Solidlineindicatesatheoretical perfectagreementbetweenmodelanddata(slope=1,intercept=0).Dottedline showstherealdegreeofaccordance(slope=0.858;intercept=2.361).
4. Discussion
4.1. Theinversemodellingapproach
We attempted to fit empirical models using inverse mod-elling procedures todescribe and predictseed shadowand, by implication,thespatialpatternofprimaryseeddispersalandits consequencesinnaturalregenerationinP.pinea.Ourmain con-cern wasshortdispersaldistance,particularly,thescopeofthe crown.Therefore, weusedtwocompetingmodels(Weibulland 2Dt) that workproperly atthis scale. Eventhoughthe flexibil-ityofthe2Dtkernelwasdevelopedtoaccountforlongdistance events (Clark et al., 1999b), those models have been reported to underestimatelongdispersal distances (Debain etal., 2007), incomparisonwiththemixturemodelproposedbyBullockand
Clarke(2000).Similarly,mechanisticapproacheswerenottaken
into consideration,as theyhavebeen developedusing physical variables specificallyrelatedtowinddispersalmechanisms(e.g.
GreeneandJohnson,1989;BullockandClarke,2000;Stoyanand
Wagner,2001;butseealsoMartínezandGonzález-Taboada,2009)
oreven tomodelsecondarydispersal byanimals(Greeneetal., 2004).
Aseriousconstraintofinversemodellingisthatplotsizeand spatialdistributionofseedtrapsmayleadtounderestimationof mean dispersal distancewhen leptokurtic dispersal takes place (Robledo-ArnuncioandGarcía,2007).However,thisproblemdoes notseverelyapplytothisstudy,asanextremelyhighkurtosisisnot expectedinP.pinea,providedgravityprimarydispersalstrategyin thespecies.Inaddition,ourregulargridmaximizesthenumber oftrapsbetweenoneandtwocrownradii,wheredroppedseeds intrapscommencetobeuncommon(deficientsamplinginthose circumstancescouldresultinanunreliableparameterestimation). Anindirectconsequenceofdispersalfeatureisthatthearrivalof
Table4
Summaryoftheestimatedcoefficientsforthefittedmodelbetweenvariablesrand thecubicrootofpp(precipitation).ϕistheauto-regressiveparameteroforder1 indicatingcorrelationbetween2consecutiveobservations.
Coefficient Standarderror t p-value
Intercept −0.0989 9.2157 −0.0107 0.9915
3
√
pp 10.1624 2.7346 3.7162 0.0008
Fig.7. Sourcelimitation(SL)anddispersallimitation(DL)indexesvsBA(m2/ha)forthesevenplots.Circlesindicateseedtreetreatment;crosses,shelterwoodtreatment;
andthesquaredsymbolcorrespondstothecontrol.
0 20 40 60 80 100 120
Jun-0 5 Sep-0
5 Dec-0
5 Mar-0
6 Jun-0
6 Sep-0
6 Dec-0
6 Mar-0
7 Jun-07Sep-0
7 Dec-0
7 Mar-0
8 Jun-0
8 Sep-0
8 Dec-0
8 Mar-0
9 Jun-09Sep-0
9 Dec-0
9 Mar-1
0 Jun-1
0 Sep-1
0 Dec-1
0
sr (%)
0 50 100 150 200 250
pp (mm)
Fig.8.Variablesr(solidline)andtotalprecipitationperdispersalperiod(dashedline)intime.Forclarity,wedonotshowsrdatafrom2005to2006and2009to2010 dispersalperiods(negligible).Notethatsr=100correspondstothelastvalueofeachdispersalperiod.
immigrantseedsisexpectedtobeahighlyunlikelyeventinthis case,consideringalsothespatialdispositionofthegridinregard totheplotboundaries.
Ontheotherhand,althoughgeneticanalysisdealswiththese difficulties,dispersalkernelestimationthroughparentage analy-sisrequirestheuseofhighlyvariablemolecularmarkers,which
Fig.9.Regressionmodelforthetemporalpatternofseedrelease (solidline) betweensrandthecubicrootoftotalprecipitation(pp).Datafromthedispersal yearsusedtofitthemodelaredisplayedseparately.
provide an exact identification of all potential seed sources
(Robledo-Arnuncio and García, 2007; Jones and Muller-Landau,
2008).Thisinterestingandpowerfultechniqueisunfeasibletobe
appliedinthecaseofP.pinea,duetotheextremelylowgenetic diversityinthespecies(Vendraminetal.,2008).
Dependingonthenatureofthedata,severalauthorshave pro-poseddifferenttheoreticaldistributionstofitthedispersalmodels. TheobviousapproachisthePoissondistribution,astheresponse variableisobtainedfromcounts(Ribbensetal.,1994;Sagnardetal.,
2007).However,Clarketal.(1998)firstappreciatedthe
unsuit-abilityofthePoissonprocesswhenclumpingofdatawaspresent, suggestingtheuseofthenegativebinomialdistributioninstead. Thisinterestingfindingandthesubsequentproposalmaydealwith clumping,atcostofanextraparameter(),being,inpractice,a generalizationofthePoissonapproach.Indeed,tendstobelarge whendataaccommodatesaPoissonprocess.
The2DtmodelinvolvesthePoissonassumptionbydefinition. Thisvery flexible Gaussianmodeldealsreasonably wellwitha clumpeddatadistribution,notbeingessentialtoconstructcomplex likelihoodfunctions(Clarketal.,1999b).However,weattempted thenegativebinomialfortheWeibullmodel.Parameterestimation became unstable and the clumping parameter frequently pro-duced high figures (>100; in contrast to Clark et al. (1998)). Consequently,weusedthePoissonlikelihoodasaparticularcase ofthenegativebinomialtoachieveaccurateestimates. Difficul-tiesinfittingandlackofstabilityarenotuncommonforpoorly primarydispersedspecies(zoochorousandbarochorusdispersal syndromes)asreportedbyClarketal.(1998)andMartínezand
Eventually,giventhespecificfeaturesofP.pineaspatialprimary dispersal,allmodelsshowedasimilarbehaviorintermsof predic-tion(comparabler2),withslightdifferencesnearbythestem.In addition,thecoefficientofdeterminationwasrelativelylow,asa resultofincreasingvariancewithmeanvalues(Poisson assump-tion),especiallyatshortdistances(belowcrown).
4.2. Modelimprovements
InaccordancewiththefindingsofRodrigoetal.(2007),through ourpreliminaryanalysistoestimatethemaximumrelative disper-saldistance(crownradii),itwasobservedthatseedtrapslocated furtherthantwocrownradiifromthenearesttreeseldomreceived anyseed,dropping 80%ofseedsunderthecrown.This circum-stance,duetotheaforementionedgravitydispersalpatternandto thelowstanddensities,allowedustoassumealimitednumber ofsources associatedwitheach trap.Consequently, itwas pos-sibletoimprovecomputing efficiencytoassess highresolution distancesand,inturn,tosupplymoreaccurateinputsformodel fit.Inaddition,oursystematictrapdesign,deployedthroughouta varietyofstanddensities,providedahighrangeofdistancesunder thisassumption,whichconstitutesadesirablecircumstance(Clark etal.,1998).
Commonly,inversemodellingproceduresreduceseedsources to points. To our knowledge, there is no study where crown sizehasbeentakenintoaccountinkernelparameterization,but
Sagnardetal.(2007)inadifferentcasestudy.Nevertheless,due
totheumbrella-likeshapeofP.pineacrownsandconeoccurrence throughouttheupperfractionofthecrown(Mutkeetal.,2005b), thewholecrownmust beconsideredasa seedsource.Besides, asitssizemaystronglyinfluenceprimaryseedarrival(Barbeito etal.,2008),itisofgreatinteresttopredicttheproportionofseeds droppedbeneathcrowns.Weproposeamethodthatsuccessfully accomplishesthisobjective.Providingthatasummedseedshadow modelimpedesusingrelativedistances(crownradii)betweentrees andtraps,duetodimensionalinconsistence,distancesfromtrap tosourcearecorrected,implyingadoublescale:beyondcrown, distancetothedriplineisknownandunaltered,whereasbeneath crown, relative distances are assessed in terms of crown radii (1crownradius=3.5m,meancrownradiusatourexperimental plots).BeyonditsapplicationinP.pineastands,theapproach pro-videsaninterestingtooltoaccuratelystudyprimarydispersalin large-seededspecieswithbroadcrowns(e.g.genusQuercus),with modestchangestocustomizethemodel(meancrownradius).
Oneofthemaindrawbacksinclassicseedshadowestimation usinginversemodellingisthatitrequiressourcefecundityfigures. Frequently,thesevaluesaredifficulttoachieveandaredefinedas theproductofsomeknownvariablerelatedtoseedproductivity. Forexample,dbh(Ribbensetal.,1994;Clarketal.,1998;Uriarte
etal.,2005)ornumberofcones(Sagnardetal.,2007)plusa
param-etertoestimatenumberofseedsperdbhunitorcone.Adifferent approachwasproposedbyNanosetal.(2010),wherefecunditywas allowtovaryamongtreeswithoutrestrictions.Thesimultaneous estimationoffecundity anddispersalparameters maycomprise highinstabilityintheprocess(Clarketal.,2004;Nanosetal.,2010). Inourapproach,wereducedmodelcomplexityderivedfromthis issuebyestimatingfecundityviatheexistingmodeldevelopedby
Calamaetal.(2008)andthedimensionalcorrectionsassessedby
Morales(2009),whichenableaccuratepredictionofseed
produc-tioninP.pineaasafunctionofdbhandsiteindex.
4.3. Spatialpatternofseeddispersal
The seed shadow estimated from the selected model (W.P) showedahighlyaggregatedspatialpatternofprimaryseed dis-persalfor P.pinea. Therefore,the presenceof dropped seedsis
boundedbeneathcrownsorinnearbyareas(uptotwocrownradii foranaveragetree),infullaccordancewiththefindingsofRodrigo
etal.(2007).Simulationsproducedbytheselectedmodelallowed
toattainsourceanddispersallimitationindexes.Comparisonsof theseindexeswiththecorrespondingbasalareavalueswithineach plotshowedthatsourcelimitationwasnegligibleforallplots con-sidering thewholeperiod,althoughdue tothespecies’masting habit,limitationwouldoccurfrequentlyinnomastyears(Calama
etal.,Unpublisheddata).Nevertheless,theresultssupportedour
hypothesis thatcurrent managementdensitiesare inefficientin regardtodispersallimitation.Forpost-harvestbasalareavalues underbothregenerationfellings(especiallytheseedtreemethod), thecurrentseedshadowsproducedanotablepercentageofgaps wheredispersedseedsarenotexpectedtoarrive.Theseresultsare consistentwiththose fromDallingetal.(2002)when consider-inglarge-seeded,non-zoochorusspecieswithlowdensitieswithin astand.Thisissuecouldlimitnaturalregenerationifstand den-sityisreducedpriortoseedlingestablishment,particularlywhen basalareaisreducedbelowacriticalvalueof10m2/ha(seedtree method).Inthatcircumstance,theremainingtreesareinsufficient tosuccessfullyregeneratethestand,evenifhighlyfavorable disper-saleventstakeplace,andthusnecessitatingartificialregeneration (directseeding).Thisscenarioconstitutesacommoncircumstance givencurrentfellingschedules,involvingdensitiesthatrangefrom 50 to75stems/haduring thefirst 10 years oftheregeneration period(Monteroetal.,2008).
4.4. Temporalpatternofseeddispersal
From a temporal perspective, the results also support our hypothesisthatclimatecontrolsconeopeningandseedreleaseinP.
pinea.Duringourstudy,conesopenedinresponsetoatemperature
threshold(19–20◦C).Accordingly,Tapiasetal.(2001),ina compar-ativestudyundercontrolledconditions,foundthatP.pineacones openingtookplaceasapunctualprocessat28◦C(thelowest tem-peraturetested).Ontheotherhand,therelationshipbetweensrand totalprecipitationcouldbeconnectedtopassivephysicalprocesses involvingscaletissuesstructureandchangesinrelativehumidity (Dawsonetal.,1997).Thatwouldpromoteconescalesmovements, alternativelyopeningand closing thecone,which would facili-tate seed release.Contrastingly, Masettiand Mencussini (1991) observeddispersalpeaksforP.pineaduringthedriestmonthin twocorrelativeyearsinToscana(Italy),althoughthatanalysiswas performedwithouttakingintoaccounttheseasonallydecliningof thecanopyseedbank.In ourcase, suchaneffectwasobserved onlyduringthedispersalpeakthatbeganinMarch2007.Adaily analysisofprecipitationratesshowsthatmostoftherainfalltook placeattheendofthepreviousinterval(February)along correl-ativedays.However,thedispersalpeakwasrecordednextmonth (March,whichwasdrier).Thisdiscrepancymightindicatethatseed releasecanbecontrolledbyalternatedryandhumideventsin cli-matescharacterizedbyalowerandmoreunevenprecipitationthan inToscana,suchastheSpanishNorthernPlateau.Similarly,Nathan
etal.(1999)claimedthatPinushalepensisseedreleasewasstrongly
relatedtoextremelydryandhotclimateevents.Althoughrainfall wasnotinvolvedintheprocess,shortchangesinhumiditywith respecttopriordailyvaluesproducedtherelease.
4.5. Managementimplications
OurfindingssuggestthatunderthecurrentmanagementofP.
pineastandsintheNorthernPlateau,primarydispersalcould
outpoorphysiologicalperformance ofseedlingslocatedbeyond thecrown influence,whereas Calama et al.(Unpublished data) observedhighermortalityinseedlingslocatedbeyondtwocrown radiifromtrees.Inaddition,Awadaetal.(2003)establishedthat
P.pinearesponsetolateshadereleasingdidnotconditionfurther
plantdevelopment.Therefore,theabsenceoflongdispersal dis-tanceeventscouldapparentlybeneficiatethespecies.Themodels developedinthisstudyshowedahighlyclumpeddispersal spa-tialpattern,wheretheoccurrenceofseedrainisintimatelyrelated torainfallevents.Seedlimitationindexesobtainedfromselected modelsimulationssuggestthatnaturalregenerationfailureisdue to,atleastinpart,dispersallimitation.Inaddition,asseedrelease provedclimate-controlled,currentfellingschedulesfollowingno ecologicalcriteriacanresultinunsuitabledensityreductionbefore dispersaltakesplace.Thesespatialandtemporalconstrictionslimit dispersalthroughspaceandtime,andindicatethatpresent silvicul-turepracticesinP.pineastandscanbemodifiedinordertooptimize seedarrival.Areductionintheintensityofregenerationfellings andtheirschedulingafewyearsaftertheoccurrenceoffavorable recruitmenteventswouldreducetheprobabilityofregeneration failurethroughamoreevenlydistributeddispersal.Becausethe controldispersal limitationindexshowedanegligibleseed lim-itationwithrespect tobasal area, theresidual densities atthe beginningoftheregenerationperiodshouldexceed16–18m2/haof basalarea.Regenerationfellingsshouldbelimitedtopost-dispersal periods,aftertherainfallsthatfollowcone openinginthis area (i.e.October–December)inordertoguaranteethereleaseofallthe seeds.Inconclusion,silviculturalrecommendationsbasedonthe modelsdevelopedinthepresentstudywouldincreasethe avail-ableseedinthesoilbanknecessaryforthenextprocessesinnatural regeneration.
Acknowledgements
WearegratefultotheForestServiceoftheJuntadeCastillay LeónandinparticulartoAyuntamientodeElPortilloforpermission toconductthefieldexperiment.WealsowishtothankGuillermo Madrigal and Enrique Garriga for their help in data collection. Finally,wewouldliketoexpressourgratitudetoDavidAffleckfor hissuggestionsonRprogrammingandJuanJoséRobledo-Arnuncio for hishelpful comments that improved notably the text.This researchwassupportedbyINIAprojectRTA2007-00044.
AppendixA. Supplementarydata
Supplementarydataassociatedwiththisarticlecanbefound,in theonlineversion,atdoi:10.1016/j.ecolmodel.2011.11.028.
References
Awada,T.,Radoglou,K.,Fotelli,M.N.,Constantinidou,H.I.A.,2003.Ecophysiologyof seedlingsofthreeMediterraneanpinespeciesincontrastinglightregimes.Tree Physiol.23,33–41.
Barbeito,I.,Pardos,M.,Calama,R.,Ca ˜nellas,I.,2008.Effectofstandstructureon stonepine(PinuspineaL.)regenerationdynamics.Forestry81,617–629. Belisle,C.J.P.,1992.Convergencetheoremsforaclassofsimulatedannealing
algo-rithmsonR(d).J.Appl.Prob.29,885–895.
Bullock,J.M.,Clarke,R.T.,2000.Longdistanceseeddispersalbywind:measuring andmodellingthetailofthecurve.Oecologia124,506–521.
Calama,R.,Canadas,N.,Montero,G.,2003.Inter-regionalvariabilityinsiteindex modelsforeven-agedstandsofstonepine(PinuspineaL.)inSpain.Ann.Forest Sci.60,259–269.
Calama,R.,Gordo,F.J.,Mutke,S.,Montero,G.,2008.Anempiricalecological-type modelforpredictingstonepine(PinuspineaL.)coneproductionintheNorthern Plateau(Spain).For.Ecol.Manage.255,660–673.
Calama,R.,Manso,R.,Barbeito,I.,Madrigal,G.,Garriga,E.,Gordo,F.J.,Montero,G., Ca ˜nellas,I.,Pardos,M.,Unpublisheddata.Doesinter-specificdifferencesinseed sizedeterminenaturalregenerationtraitsinPinuspineaandPinussylvestris? Calama,R.,Montero,G.,2007.Coneandseedproductionfromstonepine(Pinuspinea
L.)standsinCentralRange(Spain).Eur.J.ForestRes.126,23–35.
Calama,R.,Mutke,S.,Tomé,J.,Gordo,J.,Montero,G.,Tomé,M.,2011.Modelling spatialandtemporalvariabilityinazero-inflatedvariable:thecaseofstone pine(PinuspineaL.)coneproduction.Ecol.Model.222,606–618.
Clark,J.S.,Beckage,B.,Camill,P.,Cleveland,B.,HilleRisLambers,J.,Lichter,J., McLach-lan,J.,Mohan,J.,Wyckoff,P.,1999a.Interpretingrecruitmentlimitationin forests.Am.J.Bot.86,1–16.
Clark,J.S.,LaDeau,S.,Ibanez,I.,2004.Fecundityoftreesandthe colonization-competitionhypothesis.Ecol.Monogr.74,415–442.
Clark,J.S.,Macklin,E.,Wood,L.,1998.Stagesandspatialscalesofrecruitment limi-tationinsouthernAppalachianforests.Ecol.Monogr.68,213–235.
Clark,J.S.,Silman,M.,Kern,R.,Macklin,E.,HilleRisLambers,J.,1999b.Seed disper-salnearandfar:patternsacrosstemperateandtropicalforests.Ecology80, 1475–1494.
Dalling,J.W.,Muller-Landau,H.C.,Wright,S.J.,Hubbell,S.P.,2002.Roleofdispersal intherecruitmentlimitationofneotropicalpioneerspecies.J.Ecol.,90. Dawson,J.,Vincent,J.F.V.,Rocca,A.M.,1997.Howpineconesopen.Nature390,
668.
Debain,S.,Chadoeuf,J.,Curt,T.,Kunstler,G.,Lepart,J.,2007.Comparingeffective dispersalinexpandingpopulationofPinussylvestrisandPinusnigraincalcareous grassland.Can.J.For.Res.37,705–718.
Ganatsas,P.,Thanasis,G.,2010.PinushalepensisinvasioninPinuspineahabitatin Strofyliaforest(SiteofNATURA2000network),southernGreece.J.Nat.Conserv. 18,106–117.
Gómez-Aparicio,L.,Gómez,J.M., Zamora,R.,2007. Spatiotemporalpatterns of seeddispersal inawind-dispersedMediterranean tree(Aceropalussubsp granatense):implicationsforregeneration.Ecography30,13–22.
González-Martínez,S.C.,Burczyk,J.,Nathan,R.,Nanos,N.,Gil,L.,Alía,R.,2006. Effec-tivegenedispersalandfemalereproductivesuccessinMediterraneanmaritime pine(PinuspinasterAiton).Mol.Ecol.15,4577–4588.
Greene,D.F.,Canham,C.D.,Coates,K.D.,Lepage,P.T.,2004.Anevaluationof alterna-tivedispersalfunctionsfortrees.J.Ecol.92,758–766.
Greene,D.F.,Johnson,E.A.,1989.Amodelofwinddispersalofwingedorplumed seeds.Ecology70,339–347.
Jones,F.A.,Muller-Landau,H.C.,2008.Measuringlong-distanceseeddispersalin complexnaturalenvironments:anevaluationandintegrationofclassicaland geneticmethods.J.Ecol.96,642–652.
Levin,S.A.,Muller-Landau,H.C.,Nathan,R.,Chave,J.,2003.Theecologyand evolu-tionofseeddispersal:atheoreticalperspective.Annu.Rev.Ecol.Evol.Syst.34, 575–604.
Magini,E.,1955.Sullecondizionidigerminazionedelpinod’Aleppoedelpino domestico.ItaliaForestaleeMontana,AnnoX:,106–124.
Manso,R.,Calama,R.,Madrigal,G.,Garriga,E.,DeBlas,S.,Gordo,F.J.,Pardos,M. Dis-persiónprimaria,dispersiónsecundariaypredaciónpost-dispersiónenPinus pineaL.In:J.Gordo,R.Calama,M.Pardos,F.BravoandG.Montero(Eds.),La regeneraciónnaturaldePinuspineaL.yPinuspinasterAit.enlosarenalesde laMesetaCastellana.ActasdelasIJornadasdeTransferenciaTecnológicay Científica,inpress.
Manso,R.,Pardos,M.,Garriga,E.,DeBlas,S.,Madrigal,G.,Calama,R.,2010.Modelling thespatial–temporalpatternofpost-dispersalseedpredationinstonepine (PinuspineaL.)standsintheNorthernPlateau(Spain).In:FrugivoresandSeed Dispersal:MechanismsandConsequencesofaKeyInteractionforBiodiversity, Montpellier,France.
Martínez,I.,González-Taboada,F.,2009.Seeddispersalpatternsinatemperate for-estduringamastevent:performanceofalternativedispersalkernels.Oecologia 159,389–400.
Masetti,C.,Mencussini,M.,1991.Régénérationnaturelledupinpignon(Pinuspinea L.)danslaPinetaGranducalediAlberese(ParcoNaturalledellaMaremma, Toscana,Italie).Ecol.Mediterr.17,103–188.
Montero,G.,Calama,R.,RuizPeinado,R.,2008.SelviculturadePinuspineaL.In: Montero,G.,Serrada,R.,Reque,J.(Eds.),CompendiodeSelviculturadeEspecies. INIA—FundaciónCondedelValledeSalazar,Madrid,pp.431–470.
Morales,L.,2009.Modelosparalaprediccióndelcontenidoycalidaddepi ˜nónen pi ˜nasdePinuspineaL.enlosvallesdelTiétarydelAlberche.MasterThesis, UniversidadPolitécnicadeMadrid,Madrid.
Muller-Landau,H.C.,Wright,S.J.,Calderon,O.,Condit,R.,Hubbell,S.P.,2008. Inter-specificvariationinprimaryseeddispersalinatropicalforest.J.Ecol.96, 653–667.
Muller-Landau,H.C.,Wright,S.J.,Calderón,O.,Hubbell,S.P.,Foster,R.B.,2002. Assess-ingrecruitmentlimitation:concepts,methodsandcase-studiesfromatropical forest.In:Levey,D.J.,Silva,W.R.,Galetti,M.(Eds.),SeedDispersaland Fru-givory:Ecology,EvolutionandConservation.CABInternational,Wallingford, pp.35–53.
Mutke,S.,Gordo,J.,Gil,L.,2005a.VariabilityofMediterraneanstonepinecone pro-duction:yieldlossasresponsetoclimatechange.Agric.ForestMetereol.132, 263–272.
Mutke,S.,Sievanen,R.,Nikinmaa,E.,Perttunen,J.,Gil,L.,2005b.Crownarchitecture ofgraftedstonepine(PinuspineaL.):shootgrowthandbuddifferentiation.Trees 19,15–25.
Nanos,N.,Larson,K.,Milleron,M.,Sjostedt-deLuna,S.,2010.Inversemodelingfor effectivedispersal:doweneedtreesizetoestimatefecundity?Ecol.Model.221, 2415–2424.
Nathan,R.,Katul,G.G.,Horn,H.S.,Thomas,S.M.,Oren,R.,Avissar,R.,Pacala,S.W., Levin,S.A.,2002.Mechanismsoflong-distancedispersalofseedsbywind. Nature418,409–413.
Nathan,R.,Safriel,U.N.,Noy-Meir,I.,Schiller,G.,1999.Seedreleasewithoutfire inPinushalepensis,aMediterraneanserotinouswind-dispersedtree.J.Ecol.87, 659–669.
Nathan,R.,Safriel,U.N.,Noy-Meir,I.,Schiller,G.,2000.Spatiotemporalvariationin seeddispersalandrecruitmentnearandfarfromPinushalepensistrees.Ecology 81,2156–2169.
Ordó ˜nez,J.L.,Molowny-Horas,R.,Retana,J.,2006.AmodeloftherecruitmentofPinus nigrafromunburnededgesafterlargewildfires.Ecol.Model.197,405–417. Pardos,M.,Puertolas,J.,Madrigal,G.,Garriga,E.,deBlas,S.,alama,R.,2010.
Sea-sonalchangesinthephysiologicalactivityofregenerationunderanaturallight gradientinaPinuspinearegularstand.ForestSyst.19,367–380.
Prada,M.A.,Gordo,J.,DeMiguel,J.,Mutke,S.,Catalán,G.,Iglesias,S.,Gil,L.,1997. LasregionesdeprocedenciadePinuspineaL.enEspa ˜na.MinisteriodeMedio Ambiente,Madrid.
Ribbens, E., Silander, J.A., Pacala, S.W., 1994. Seedling recruitment in forests—calibratingmodels topredictpatterns oftree seedlingdispersion. Ecology75,1794–1806.
Robledo-Arnuncio,J.J.,García,C.,2007.Estimationoftheseeddispersalkernelfrom exactidentificationofsourceplants.Mol.Ecol.16,5098–5109.
Rodrigo,A.,Quintana,V.,Retana,J.,2007.FirereducesPinuspineadistributioninthe northeasternIberianPeninsula.Ecoscience14,23–30.
Sagnard,F.,Pichot,C.,Dreyfus,P.,Jordano,P.,Fady,B.,2007.Modellingseeddispersal topredictseedlingrecruitment:recolonizationdynamicsinaplantationforest. Ecol.Model.203,464–474.
Santos,B.A.,Melo,F.P.L.,Tabarelli,M.,2006.Seedshadow,seedlingrecruitment,and spatialdistributionofBuchenaviacapitata(Combretaceae)inafragmentofthe BrazilianAtlanticForest.Braz.J.Biol.66,883–890.
Schütz,J.P.,2002.Silviculturaltoolstodevelopirregularanddiverseforest struc-tures.Forestry45,329–337.
Stoyan,D.,Wagner,S.,2001.Estimatingthefruitdispersionofanemochorousforest trees.Ecol.Model.145,35–47.
Tapias,R.,Gil, L.,Fuentes-Utrilla,P.,Pardos, J.A.,2001.Canopy seedbanksin Mediterranean pines of southeasternSpain: a comparison betweenPinus halepensis Mill., P.pinaster Ait., P.nigra Arn. and P. pinea L. J. Ecol. 89, 629–638.
RDevelopmentCoreTeam,2009.R:ALanguageandEnvironmentforStatistical Computing.RFoundationforStatisticalComputing,Vienna,Austria. Tsakaldimi,M.N.,Tsitsoni,T.K.,Zagas,T.,Ganatsas,P.P.,2004.Aleppopine(Pinus
halepensis)naturalregeneration,withoutfire,intheKassandraPeninsula, north-ernGreece.In:Papanastasis,A.(Ed.),MEDECOSConference.25thApril–1stMay. Millpress,Rhodes,Greece.
Uriarte, M., Canham, C.D., Thompson, J., Zimmerman, J.K.,Brokaw, N., 2005. Seedlingrecruitmentinahurricane-driventropicalforest:lightlimitation, density-dependenceandthespatialdistributionofparenttrees.J.Ecol.93, 291–304.
Vendramin,G.G.,Fady,B.,Gonzalez-Martinez,S.C.,Hu,F.S.,Scotti,I.,Sebastiani,F., Soto,A.,Petit,R.J.,2008.Geneticallydepauperatebutwidespread:thecaseofan emblematicmediterraneanpine.Evolution62,680–688.
Weise,W.,1880.ErtragstafelnfürKiefer.J.Springer.