1 23
European Journal of Forest Research
ISSN 1612-4669
Eur J Forest Res
DOI 10.1007/s10342-013-0724-z
A silviculture-oriented spatio-temporal
model for germination in
Pinus pinea
L. in
the Spanish Northern Plateau based on a
direct seeding experiment
1 23
O R I G I N A L P A P E R
A silviculture-oriented spatio-temporal model for germination
in
Pinus pinea
L. in the Spanish Northern Plateau based
on a direct seeding experiment
Rube´n Manso•Rafael Calama• Guillermo Madrigal•
Marta Pardos
Received: 5 March 2012 / Revised: 3 July 2013 / Accepted: 5 August 2013
ÓSpringer-Verlag Berlin Heidelberg 2013
Abstract Natural regeneration in Pinus pinea stands commonly fails throughout the Spanish Northern Plateau under current intensive regeneration treatments. As a result, extensive direct seeding is commonly conducted to guarantee regeneration occurrence. In a period of ratio-nalization of the resources devoted to forest management, this kind of techniques may become unaffordable. Given that the climatic and stand factors driving germination remain unknown, tools are required to understand the process and temper the use of direct seeding. In this study, the spatio-temporal pattern of germination ofP. pineawas modelled with those purposes. The resulting findings will allow us to (1) determine the main ecological variables involved in germination in the species and (2) infer ade-quate silvicultural alternatives. The modelling approach focuses on covariates which are readily available to forest managers. A two-step nonlinear mixed model was fitted to predict germination occurrence and abundance inP. pinea under varying climatic, environmental and stand condi-tions, based on a germination data set covering a 5-year period. The results obtained reveal that the process is pri-marily driven by climate variables. Favourable conditions for germination commonly occur in fall although the optimum window is often narrow and may not occur at all
in some years. At spatial level, it would appear that ger-mination is facilitated by high stand densities, suggesting that current felling intensity should be reduced. In accor-dance with other studies onP. pineadispersal, it seems that denser stands during the regeneration period will reduce the present dependence on direct seeding.
Keywords Empirical modellingTwo-step regressionRegenerationStone pine
Introduction
Pinus pinea is an essential species in Mediterranean eco-systems, its timber and edible seed production generating important economic benefits to the local population. In addition, the species plays a valuable ecological role since it frequently occupies sites with challenging climatic and edaphic conditions (Mediterranean climate and highly sandy soils) where few arboreal species persist. Such conditions are common throughout the Spanish Northern Plateau (Prada et al. 1997), where there are more than 50.000 ha of managedP. pinea forests.
Natural regeneration of this species has become a pri-mary concern for forest management. Like other large-seeded Mediterranean species, natural regeneration is commonly unsuccessful under the silvicultural regimes and regeneration methods currently applied (high-intensity thinnings, seed-tree and increasingly, the shelterwood method), which lead to low stand densities. Several factors underlying this regeneration failure have been identified including climate (specifically, severe summer droughts and high summer temperatures that result in establishment failure); masting habit and lack of synchrony with regen-eration fellings on the one hand and suitable years for Communicated by M. Meincken.
R. Manso
Laboratoire d’Etude des Ressources Foreˆt-Bois, INRA Centre de Nancy, 54280 Champenoux, France
R. Manso (&)R. CalamaG. MadrigalM. Pardos
Departamento de Selvicultura y Gestio´n de Sistemas Forestales, CIFOR-INIA, Carretera de La Corun˜a km 7.5, 28040 Madrid, Spain
e-mail: [email protected]; [email protected] Eur J Forest Res
DOI 10.1007/s10342-013-0724-z
seedling establishment on the other; intensive cone har-vesting, resulting in depauperate seed banks prior to regeneration felling; long rotations, inducing poor seed crops during the regeneration period due to a decline in tree vigour; the gravity-based seed dispersal strategy of this species, resulting in patchy seed distribution; and post-dispersal seed predation (Barbeito et al.2008; Calama and Montero2007; Manso et al.2010; Manso et al.2012). As a result of these difficulties, massive direct seeding has been commonly applied in the Northern Plateau in order to ensure regeneration ofP. pineastands (Gordo et al.2012). However, little is known about germination performance under field conditions when direct seeding takes place. Although the technique has proved effective so far, there exists a gap of knowledge concerning the factors that maximizes emergence and, in turn, that would minimize the seeding effort. On the one hand, climatic variables are essential to understand average germination rates across the region. On the other hand, silvicultural factors are controllable and studying their effects can provide man-agers with new insights to regenerate the stands. In this respect, it is of particular interest to investigate whether the higher stand densities suggested to reduce seed limitation (Manso et al. 2012)—and therefore, the necessity for seeding—will promote or hamper seed germination.
Typically in forestry, germination studies have been conducted under controlled conditions to ‘untangle’ spe-cies dormancy trends (Skordilis and Thanos1995; Nomiya 2010; Cook et al.2008; Cooke et al.2002), to shed light on optimum temperature and humidity conditions (Lippai et al. 1996; Cochard and Jackes 2005; Magini 1955), to investigate the influence of light on the process (Silveira et al.2004; Honda and Katoh2007; Seiwa et al.2009), to determine germination facilitation after fire (Baeza and Roy 2008; De Luis et al. 2008; Ooi 2010) or to explore germination responses to topsoil conditions (Puerta-Pin˜ero et al. 2006). Among the few studies carried out either partially or completely through field trials, only general climate comparisons (Ordo´n˜ez et al. 2004; Meyer and Pendleton 2005), particular climatic events (Ruano et al. 2009) and understory composition (Keyes et al.2009) have been evaluated in relation to germination.
Although these studies provide fundamental data on seed ecology, they commonly lack essential information for determining the successful occurrence of germination under the full range of conditions potentially affecting the process, which could be particularly important in the case ofP. pinea. Calama et al. (2012) reported that germination in the Northern Plateau stands occurs only under very restricted climatic conditions, which do not necessarily arise every year. Hence, further research should be undertaken to accurately predict the degree of success in germination in response to continuous climatic variables
under different silvicultural systems. Also, providing that soil preparation is conducted before proceeding with direct seeding, germination performance has to be tested directly on the mineral soil. Suitable predictive models have been proposed in agronomy and seed science literature such as the hydrothermal model (Bradford 1990; Roman et al. 2000), based on the cumulative effect of water potential and temperature on the cumulative germination rate. Hardegree et al. (2003) proposed a simulation through intensive laboratory experiments to predict field germina-tion rates. However, as these interesting studies were not developed within a forestry management framework, they do not include stand-related variables, inherently useful to foresters, but commonly utilize explanatory variables which are not easily collected by forest managers or which are difficult to relate to silvicultural practices (i.e. water potential).
Therefore, we propose a different modelling approach that takes into account management necessities. To achieve this objective, a long term direct seeding field experiment was installed in the Northern Plateau to record germination behaviour under a highly diverse set of climatic, environ-mental and management conditions.
The main aim of this study was to model the germina-tion response of P. pinea to varying environmental, cli-matic and stand conditions when direct seeding is carried out. The model will allow us to identify the factors regu-lating germination and to draw conclusions as regards the measures to be taken by forest managers in order to encourage this essential process and reduce direct seeding. Specifically, we hypothesized that the implementation of more progressive felling schedules may have a positive effect by modifying determinant factors for germination. In this respect, our findings will provide a valuable resource for management decision-making inP. pineaforests where direct seeding is conducted to make successful regenera-tion possible.
Materials and methods
Study site
climate is continental-Mediterranean with mean monthly temperatures ranging from 4.0°C in January to 21.7 °C in July. Mean annual precipitation is 435 mm, with a period of summer drought (July to September, mean precipitation of 66 mm). The site index is 15–16 m at 100 years; char-acteristic of a class II quality (Calama et al.2003).
Within the same study site, different experiments related to the overall process of natural regeneration inP. pinea (seed dispersal, predation, physiological status, establish-ment and survival) in the Northern Plateau have been carried out (Madrigal et al.2011).
Experimental design
The germination trial was installed in July 2006. It consisted of two 60 m980 m (0.48 ha) sample plots that were set up under two different regeneration management stand densi-ties. A 7.5-m buffer area was included around each plot, increasing the overall plot area to 0.7 ha. All trees within plots were stem mapped and their relative coordinates within each plot calculated. Eighteen seed points were deployed throughout each plot. Seed point location was chosen so as to include a wide natural light gradient and two cover condi-tions (litter and grass). The relative coordinates of each point were also recorded. Seed points were protected with a 40 cm940 cm 915 cm cage made of hard wire mesh (span 0.7 cm90.7 cm), fixed to the ground with nails to minimize rodent predation. The cages could be opened from the top to permit seed manipulation and were buried 3 cm deep to allow direct seed-soil contact.
On 1 August 2006, 2007, 2008, 2009 and 2010, 50 seeds were placed on the ground in each cage. This date was chosen because natural seed release, which commences in the beginning of the summer season, can be assumed to be mostly completed at that point (Manso et al. 2012). In addition, direct seeding is usually conducted by early fall (September). The seeds were provided by the Forest Ser-vice of the Regional Government of Castilla y Leo´n. Seed collection systematically takes place in Tordesillas Selec-ted Stand, nearby the study area, from an average popu-lation of 5,136 individual trees (Gordo2002). The seed lots had been previously tested using the ISTA protocol (via-bility 91.55 %). No stratification or imbibition treatment was applied.
Each year, germinated seeds were counted and dis-carded at regular fortnightly intervals (averaging 17.56±1.06 days) up to the following August or until complete germination was reached. Henceforth, the term year will be used to refer to these annual measurement intervals. Sample plots were visited on a total of 80 occasions. The criterion used to consider seeds as germi-nated was the presence of a radicle protruding at least 0.2 cm beyond the seed coat. During the periods 2007–2008 and 2008–2009, a plague ofApodemus sylvat-icusin Northern Spain caused some damage at several seed points, which were discarded from analysis.
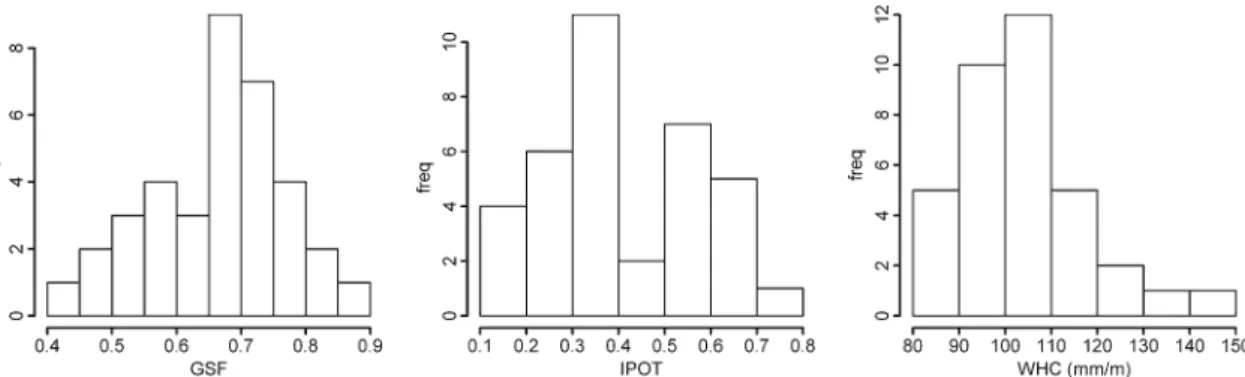
Daily climate variables were obtained from Olmedo meteorological station, located 15 km from the study site and at the same altitude (41°170N, 4°400W; data available in www.inforiego.org). To estimate light availability at each seed point, Global Site Factor (GSF) was calculated from hemispheric photographs taken at each cage location. The water-holding capacity (WHC) of the uppermost layer of the soil was obtained for each point through texture analysis of two soil samples taken in the close vicinity of the seed points. The uppermost 20 cm of the soil profile were extracted for each sample (1.57 dm3 soil cylinder). Finally, in order to consider the possible influence of trees on microclimate conditions at ground level, the influence potential (IPOT) of all trees located within a 15-m radius was calculated for each seed point. IPOT is a competition index based on the concept of ecological field theory (Wu et al. 1985), empirically modified by Kuuluvainen and Pukkala (1989):
IPOTj¼1GPOTj where
GPOTj¼ Ynj
h¼1
1Ihj
and Ihj
¼ dbhhj=max dbhð hÞ
exp bdhj
ð1Þ
Ihjis the potential influence of treehat seed pointj, dhjis
the distance from tree h to seed point j, dbhhj is the
diameter at breast height of tree h in the seed point j influence area, max(dbhh) is the maximum dbhhat each
plot,b is a parameter, andnjis the number of trees in the
seed pointjinfluence area. Heuristically, we set a value of 0.25 for b. IPOT ranges from 0 (no competition) to 1 (maximum competition).
Table 1 Summary of stand densities
Plot N b/f (ha-1) BA b/f (m2/ha-1) Dg b/f (cm) N a/f (ha-1) BA a/f (m2/ha-1) Dg a/f (cm) H a/f (m) FCC a/f (%)
1 156 18.80 39.2 46 6.99 44.1 12.6 14
2 192 22.29 38.4 73 10.82 43.4 14.1 31
b/f–a/f before fellings–after fellings. N is the stand density; BA is the basal area; Dg is the quadratic mean diameter; H is the average height; FCC is the forest canopy cover
Eur J Forest Res
The range and distribution of the spatial variables is shown in Fig.1.
Data analysis
Interannual and seasonal pattern of germination
Two preliminary analyses were undertaken to identify general traits of variability in germination response. Firstly, the seasonal germination pattern was studied using exploratory analysis. The following germination traits were compared between experiment years: starting date of the germination process, proportion of germinated seeds within seasons and maximum germination proportion within a measurement interval. Secondly, the annual proportion of germinated seeds was compared through a binomial gen-eralized linear model with a logit link function, considering each seed point as a sample unit and year as factor.
Modelling germination
In order to model germination with respect to climatic (temporal) and environmental (spatial) covariates, the response variable used was the number of seeds germinated in a specific periodiand seed point (nij) with respect to the
total amount of non-germinated seeds at the beginning of periodi, divided by the duration of the period (di), in days:
pgij¼ nij
NjPIi¼1ni1;j
di ð2Þ where Njis the initial number of seeds in seed pointj, and
I is the total number of intervals.
Thus, pgij will give the seasonal decrease in the seed
bank over time. However, three main statistical limitations arose when modelling this variable: (a) germination often exhibits an intermittent pattern, which leads to a zero-inflated frequency data distribution (violating standard normality assumptions); (b) lack of independence among observations within sample units and measurement years,
possibly exhibiting non-trivial dependencies among the within-group errors; and (c) the nature of this variable could inherently imply heteroscedasticity of residuals over time-varying covariates. To deal with the first issue, the likelihood of germination dependence on different covari-ates was studied considering two different processes sep-arately: germination occurrence and germination abundance. Through the analysis of previous graphical residual patterns, the problems derived from independence and homoscedasticity violation were corrected by includ-ing random effects, allowinclud-ing for auto-correlation error structures in the variance–covariance matrix and applying weighted variance in model formulation.
Germination occurrence Modelling germination occur-rence was performed using a binary variable that equals 1 when a seed point has germinated seeds during a period i(thus, pgij[0) and zero if not. A logistic regression was
computed via logit link function to model the process. We considered temporal and spatial variables in model for-mulation. Several temporal variables were tested, namely; the proportion of days with precipitation occurrence (Ppi),
proportion of freezing days (Fri), averaged daily values for
the mean relative humidity of the air (Hri; ratio of the
partial pressure of water vapour in the air to the saturated vapour pressure of water) and alternately, mean, maximum and minimum temperature (Ti), for each collection period
(i.e. fortnight prior to measurement). The spatial variables were GSFj, IPOTj and WHCj (continuous); and cover
conditions Cj(categorical factor with two levels, litter=0
and grass =1), evaluated at each seed pointj.
Model parameterization was carried out as follows: the logit-transformed probability of germinated seed presence at a seed point j during a period i (pij) is assumed to be
linearly related to Hri, Ppi, Fri, GSFj, IPOTj, WHCj, Cj, and
to a function of Ti(f1(Ti)). There is an optimum
tempera-ture at which the germination response is maximized (Bewley and Black 1994), so that the suitable thermal range can be described by the cardinal temperatures of species [base (Tb), optimum (To) and maximum (Tm);
Fig. 1 Histograms of the considered explanatory spatial variables. GSF is the Global Site Factor; IPOT is the influence potential; and WHD is the water-holding capacity
Kamkar et al. (2012)]. Therefore, f1(Ti) was defined to
fulfil these conditions. We tested two different hypotheses for f1(Ti) based on the skewness of the germination
response (Eqs.3and4):
if ToTb¼TmTo f1ð Þ ¼Ti a1þb1ðTil1Þ 2
no skewness
ð Þ ð3Þ
else f1ð Þ ¼Ti a2þb2Ti if TiTo f1ð Þ ¼Ti a3þb3Ti if Ti[To
skewness
ð Þ ð4Þ
Parameterl1holds an ecological meaning, representing
the value ofTithat maximizes germination occurrence (To)
whereas the linear relation is controlled by parameters a1=a2=a3andb1=b2=b3as intercepts and slopes,
respectively. Note that under the skewness hypothesis, To¼ða2a3Þ=ðb3b2Þ. The complete model is shown
in Eq.5:
logpij1pij¼f1ð Þ þTi hHriþk1Ppiþs1Fri
þc1GSFjþj1IPOTjþg1WHCjþq1Cj
ð5Þ
As measurements are repeated over time in the same plots and seed points, correlation can be present given the data structure. Field visits are grouped into different years, which implies a crossed random effect with respect to both plot and seed point level variability. In order to correct data correla-tion, we attempted to include random terms in the model fit. We expanded the model intercept (s) to allow for random effects at seed point (ujk), plot (vk;, i.e. regeneration treatment)
and year (wl) level. Interactions between random effects and
between random and fixed effects were not considered. The model selection was carried out by comparing the Akaike Information Criteria (AIC) values produced by the different fits, providing all fixed effects and random vari-ance components were significant.
Once the best model had been selected, we heuristically estimated the value of a cut-off that optimized specificity (rate of correctly classified non-events) and sensitivity (rate of correctly classified events).
Germination abundanceGermination abundance model-ling was conducted conditioned to germination occurrence (i.e. using only non-zero values). Therefore, pgij was modelled
through a nonlinear mixed model (the response variable was previously logit-transformed to achieve normality; note that this is not strictly a logistic regression as we do use the normal likelihood function). Based on previous graphical analysis, the regression model was parameterized considering logit (pgij) as
a linear function of relative humidity with intercept parameter a4and a slope term. The latter was expanded as a function of
mean, maximum and minimum daily temperature f2(Ti),
alternately. This function was defined asf1(Ti) in the
occur-rence model, as germination capacity and germination rate are similarly influenced by temperature (Bewley and Black1994). In order to test the skewness of the response, we substituted Eq.3 with a normal density function for the symmetry hypothesis. The normal density is defined by parametersl2and r2, wherel2represents the value of the temperature at which
the germination rate is maximized. As regards the skewness hypothesis, Eq.4was used. With respect to other covariates, the same ones were tested as in the occurrence model since there was no prior evidence of different factors driving each process. Thus, linear terms depending on Ppi, Fri, GSFj, IPOTj,
WHCjand cover type Cjwere inserted in the model, along with
corresponding slope parametersk2,s2,c2,j2,g2andq2. Further
interactions were not taken into account for model simplicity. Possible spatial and among-year patterns of unobserved dependence were modelled including random effects. Differ-ent levels of variability were attempted on model intercept [seed point (ujk), plot (vk;, i.e. regeneration treatment) and year
(wl)], avoiding interaction terms among random effects or
random and fixed effects. Once the optimal variance structure was set in the saturated model, covariate selection was carried out by fitting models with different fixed effects alternatives and comparing their AIC values (Zuur et al.2009). In Eq.6, the model without random effects, including the intercepta4and
the residual termeij, is shown.
log pgij1pg ij
¼a4þk2Ppiþs2Friþc2GSFjþj2IPOTj
þg2WHCjþq2Cjþf2ð Þ Ti Hriþeij
ð6Þ
Goodness of fit and model evaluation Assessment of goodness of fit in the occurrence and abundance models was performed through graphical analysis of residuals. Any detected pattern would suggest altering the variance estimate and/or the introduction of auto-correlation structures.
Model evaluation was carried out using graphical and analytical methods. In the occurrence model, specificity and sensitivity at the fixed cut-off served as model accu-racy indexes. Additionally, the degree of agreement between observed and predicted events was shown on a barplot. In order to test abundance model performance, mean error (E), root mean squared error (RMSE) and modelling efficiency (EF) of the selected conditional model in the logit scale were calculated (Eqs.7a,7band7c):
E¼
P
ij yijy^ij
n ð7aÞ
RMSE¼
ffiffiffiffiffiffiffiffiffiffiffiffiffiffiffiffiffiffiffiffiffiffiffiffiffiffiffiffiffi P
ij yijy^ij
2
n1 s
ð7bÞ
Eur J Forest Res
EF¼1
P
ij yij^yij
2
P
ij yijyij
2 ð7cÞ
Furthermore, occurrence and abundance models were jointly tested on the sample data set. For each year, cumulative observed germination proportion, averaged by measurement period, were compared graphically with that computed from model predictions, previously transformed into the real scale. The Snowdon bias correction was applied to prevent bias derived from back-transformation (Snowdon 1991). Germination occurrence modelling was carried out using PROC NLMIXED in SAS 9.2. All other analyses were assessed in R (R Development Core Team 2009). The nlme package (Pinheiro et al. 2009) was used for the purposes of abundance modelling.
Results
Interannual and seasonal pattern of germination
The earliest germination occurred during the fall following seed deployment for all years included in the study, although the exact date varied from one year to another by up to a month : October 16 (2006–2007), November 7 (2007–2008), November 12 (2008–2009), October 27 (2009–2010) and October 22 (2010–2011). Peak germina-tion periods were in late fall and spring, although a residual germination rate was also observed in winter (2008 and 2011). In contrast, no summer germination was registered during the experiment. The among-year seasonal germi-nation proportions were highly variable (Fig.2). Autumn germination (from October to late December) ranged from 90 % (2006–2007) down to just 4 % (2008–2009). Spring germination (from late March to May) varied between 20 % (2007–2008) and 4 % (2008–2009). In 2006–2007, no Spring germination was recorded as most seeds had germinated during the fall. The highest within-measure-ment period proportions of germinated seeds for each year were 8 % (late November 2006), 7.7 % (early November 2007), 7.1 % (November 2008), 11 % (late November 2009) and 7.1 % (late December 2010).
The results from the generalized linear model show that the annual proportion of germinated seeds varied signifi-cantly among years (Table2). In addition, within years variability was relatively high (Fig.3).
Germination occurrence
Stable convergence was only achieved when understory cover and minimum temperature were excluded from model formulation. Inclusion of year as a random
component was found to be the optimum variance struc-ture. As regards the formulation of the temperature func-tion, the best fits were achieved when no skewness in germination response was taken into account. Therefore, the parameterization given in Eq.3 was preferred. The selection of variables was undertaken sequentially. GSF, IPOT and WHC were dropped first as they were found to be non-significant (p[0.05) in all tested circumstances. The model finally included maximum temperature (posi-tive influence) and frost occurrence (nega(posi-tive influence). Details of the selection process are shown in Table3. The expression for the germination occurrence model was
logpij1pij¼a1þwlþb1ðTil1Þ 2
þs1Fri
ð8Þ
Fig. 2 Observed mean cumulative germination rate over time for the different years of the study. Solid line represents year 2006–2007, dashed line year 2007–2008, dotted line year 2008–2009, dotted/ dashed line year 2009–2010, and double-dashed line year 2010–2011
Table 2 Estimates for the binomial model to detect significant dif-ferences in germination across years
Estimate SD zvalue pvalue
(Intercept) 2.3100 0.5815 3.9724 \0.0001
2007–2008 -1.0925 0.7886 -1.3854 0.1659
2008–2009 -4.3891 0.8529 -5.1460 \0.0001
2009–2010 -0.8891 0.7215 -1.2324 0.2178
2010–2011 -1.4204 0.6876 -2.0658 0.0388
Rejection of null hypothesis (H0=0) implies significant differences
at least with respect to year 2006–2007, set to zero to avoid overparameterization
We chose a cut-off ofpij=0.5, as this value exhibits a
balanced trade-off between specificity (84.2 %) and sensi-tivity (84.3 %). The maximum probability of germination
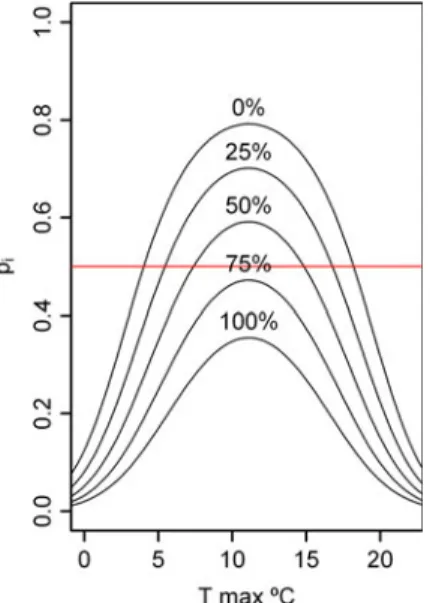
occurrence is expected at a mean maximum temperature of 11.1°C, whereas negligible values are predicted outside the temperature interval 0–22°C. For the same temperature,pij
values decrease with the proportion of frost days. Model predictions for the whole range of covariates are displayed in Fig.4. A comparison between the observed and expected values is shown in Fig.5. No pattern of discrepancy was found between the data and the model although slightly overestimated predictions are observed each year in the first intervals where germination is detected.
Germination abundance
Logit-transformed (non-zero) pgijwas modelled through a
nonlinear mixed model depending on both spatial and temporal variables. The year random effect was found to be the most relevant of all the levels of random variability. The model allowing skewness in response to temperature led to a lack of convergence in the optimization algorithm. Therefore, only the parameterization which does not con-sider skewness is presented. Parameters linked to frost occurrence, GSF, WHC, and understory type were found to be non-significant regardless of model structure, and hence,
Fig. 3 Distribution of annual germination proportion for each year of study. Within-year variability is achieved by considering seeds points as sample units. Boxes represent interquartile range. Whiskers symbolize percentiles corresponding to 1.5 times the interquartile range
Table 3 Summary of the selection process, parameterpvalues and fitting statistics for the germination occurrence model
Skewness Temp. l1 a1 b1 h k1 s1 rw2 AIC Random effect
Symmetry Mean \0.0001 0.0190 0.0004 0.3055 0.0127 0.0634 0.6674 2,072.3 Year
Symmetry Mean \0.0001 0.1524 0.0002 0.0253 – 0.0299 0.8674 2,060.2 Year
Symmetry Mean \0.0001 0.1175 0.0003 0.1476 0.0103 – 0.8445 2,049.5 Year
Symmetry Mean \0.0001 0.0363 0.0002 0.0109 – – 0.2021 2,069.1 Year
Symmetry Mean \0.0001 0.5105 0.0004 – 0.0012 0.0654 1.3708 2,069.1 Year
Symmetry Mean \0.0001 0.0795 0.0002 – – 0.0118 0.1969 2,070.4 Year
Symmetry Mean \0.0001 0.4470 0.0003 – 0.0036 – 0.9551 2,050.8 Year
Symmetry Max \0.0001 0.1205 0.0004 0.2144 0.048 0.0056 0.8557 2,036.5 Year
Symmetry Max \0.0001 0.1233 0.0003 0.4953 – 0.0030 0.8709 2,042.6 Year
Symmetry Max \0.0001 0.7392 0.0004 0.4874 0.011 – 0.8787 2,065.3 Year
Symmetry Max \0.0001 0.9187 0.0002 0.4888 – – 0.9298 2,084.1 Year
Symmetry Max \0.0001 0.2132 0.0004 – 0.0651 0.0061 0.7684 2,036.7 Year
Symmetry Max \0.0001 0.5475 0.0004 – 0.0109 – 0.8330 2,063.9 Year
Symmetry Max <0.0001 0.0364 0.0003 – – 0.0029 0.8209 2,041.1 Year
Symmetry Max \0.0001 0.0025 \0.0001 0.0004 0.0087 \0.0001 0.0472 2,181.8 Seed point
Symmetry Mean 0.0572 0.0874 0.1511 0.2091 0.0307 2183.5 0.0572 0.0874 Plot
Skewness Temp. a2 b2 a3 b3 k1 s1 rw2 AIC Random effect
Asymmetry Mean 0.6363 0.0344 0.0121 0.0083 0.0021 0.0169 0.6836 2,108.4 Year
Asymmetry Mean \0.0001 0.006 \0.0001 \0.0001 \0.0001 – 0.04915 2,294.4 Seed point
Asymmetry Mean 0.401 0.2946 0.1133 0.0982 0.0677 0.1210 0.5503 2,265.8 Plot
l1represents the temperature value at which germination occurrence is maximized.a1,a2anda3are model intercepts;b1–3,h,k1ands1are
model slopes for temperature, relative humidity, precipitation and frost occurrence, respectively. Parameters linked to the rest of the tested
covariates are omitted for simplicity (always non-significant).rw2 stands for variance related to the random effect and Temp. for the thermal
variable used (minimum excluded). The complete process is fully detailed when considering year random effect and no skewed response to temperature, whereas only the best model in terms of AIC is shown for all other options. The best model is in bold
Eur J Forest Res
they were omitted. Thereafter, variable selection was car-ried out sequentially although the intercept and parameters related to temperature were retained (Table4). With regard to the latter, mean temperature proved a better predictor than mean maximum or mean minimum temperature. Furthermore, the preliminary ‘best’ model included relative humidity, mean precipitation and IPOT as explanatory variables having a positive influence on germination abundance.
We found that weighted variance over mean temperature in the form:
var eij ¼r2ej jTi
2d
with d being an estimated parameter, together with the inclusion of an auto-regressive structure of order 1 (AR-1) produced the best fit and notably diminished AIC values (2,018.018 without correction and 1,908.229 with
correction). Under this new formulation, the IPOT effect was non-significant (p =0.4478) and was therefore excluded from the model (Eq.9). This model presented an efficiency of 40.04 %.
logit pgij
¼a4þwlþk2Ppiþ 1 ffiffiffiffiffiffiffiffiffiffi 2pr2
p exp ðTil2Þ
2
2r2
!
Hriþeij ð9Þ wherewl is the random component of between-year
vari-ability affectinga4.
The optimum mean temperature for the process is rep-resented by l2 estimate (10.37°C). Back-transformed
marginal mean predictions for a wide range of temperature and relative humidity under two rainfall scenarios (Ppi 0
and 100 %, respectively) are shown in Fig.6. The closer to the optimum temperature and the higher the relative humidity, the faster the germination rate. Maximum rate when Ppi=100 % is almost three times as high as when
Ppi=0 %. A negligible germination proportion is
expec-ted for mean temperatures below 0°C or above 20°C, or for relative humidity levels below 50 %.
The final parameterization for both the occurrence and abundance models is displayed in Table5.
The combined application of the occurrence and abun-dance conditional models with the sample data set gave predicted annual proportions of germinated seeds which were highly consistent with those observed (Fig.7). Pre-dictions for the year 2006–2007 closely match the observed patterns. Estimates for 2007–2008 were slightly biased, with a tendency to overestimate the germination proportion, whereas for the year 2010–2011, the models slightly underestimated germination. In 2009–2010, the slight departure from observations is due to a predicted early germination event in October. This single event altered the whole expected cumulative germination curve, even though the rest of the instantaneous proportions were reasonably precise. Lastly, the models succeeded in properly detecting the unusually low germination occurring in 2008–2009.
Fig. 4 Plot of predictions for germination occurrence model over mean maximum temperature (T) and varying proportion of freezing
days (0, 25, 50, 75, and 100 %). Response variable piis the proportion
of germinant seed points at intervali. Horizontal line represents the
assessed cut-off
Fig. 5 Observed (black bars) and predicted (grey bars) occurrence proportion (pi) values for each measurement interval and year
Discussion
Modelling germination
The models presented in this study were based on explanatory variables easily available to forest managers and/or related to silvicultural treatments. Unfortunately, water potential is not among the aforementioned variables, although it is an essential covariate for predicting germi-nation rates. We therefore attempted to include other variables which could, in turn, explain at least part of the variability related to water potential. The variables con-sidered suitable for this purpose were as follows: mean fortnightly relative humidity, proportion of days with pre-cipitation and water-holding capacity.
Temperature is considered to be one of the main factors affecting germination, which requires a suitable thermal interval and will generally occur only within a narrow optimum temperature range (Thornley 1986; Bewley and Black1994). According to our models, the average mean/ maximum/minimum temperature over regular time inter-vals explains germination response better when skewness is not included in parameterization (range between optimum and base temperature equals that which exists between maximum and base temperature: To-Tb=Tm-To). This
is because the explanatory variable summarizes the fluc-tuating temperatures recorded each fortnight. Despite this fact, temperature itself does produce a skewed response in the species (Magini 1955). The abundance model fitted under the no skewness hypothesis required the use of a
Table 4 Summary of the selection process, parameter p values and fitting statistics for the germination abundance model
Temp. l2 r2 a4 j2 k2 rw2 AIC Random effect
Mean <0.0001 <0.0001 <0.0001 0.0288 0.0092 0.1893 2,018.018 Year
Mean \0.0001 \0.0001 \0.0001 – 0.0087 0.1816 2,020.831 Year
Mean \0.0001 \0.0001 \0.0001 0.0271 – 0.2178 2,022.813 Year
Mean \0.0001 \0.0001 \0.0001 – – 0.2097 2,025.722 Year
Max \0.0001 \0.0001 \0.0001 0.0411 \0.0001 0.2556 2,089.130 Year
Max \0.0001 \0.0001 \0.0001 – \0.0001 0.2472 2,091.392 Year
Max \0.0001 \0.0001 \0.0001 0.0343 – 0.3087 2,102.176 Year
Max \0.0001 \0.0001 \0.0001 – – 0.2996 2,104.682 Year
Min \0.0001 \0.0001 \0.0001 0.0516 0.0007 0.1101 2,114.380 Year
Min \0.0001 \0.0001 \0.0001 – 0.0007 0.1040 2,116.191 Year
Min \0.0001 \0.0001 \0.0001 0.0545 – 0.1243 2,124.013 Year
Min \0.0001 \0.0001 \0.0001 – – 0.1177 2,125.727 Year
Mean \0.0001 \0.0001 \0.0001 – \0.0001 0.05610 2,061.064 Seed point
Mean \0.0001 \0.0001 \0.0001 0.1182 \0.0001 \0.0001 2,070.549 Plot
l2represents the temperature value at which germination abundance is maximized.r2is the variance parameter of the temperature normal
function.a4is the model intercept;j2andk2are model slopes for IPOT and precipitation occurrence, respectively. Parameters linked to the rest
of tested covariates are omitted for simplicity (always non-significant).rw2 stands for variance related to the random effect and Temp. for the
thermal variable used. The complete process is fully detailed when considering year random effect and no skewed response to temperature, whereas only the best model in terms of AIC is shown for all other options. The best model is in bold
Fig. 6 Marginal predictions assessed through the germination abundance model for a set of varying mean temperatures (T) and relative humidity (Hr) under two scenarios of precipitation occurrence (left no rainfall days, right 100 % of rainfall days within the interval). pgiis the daily germination rate in real scale
Eur J Forest Res
more flexible normal distribution rather than the simpler expression employed in the occurrence model.
In our model formulation, optimum temperature (To) is
directly estimated as a parameter (l1, l2), whereas the
thermal limiting interval is precisely controlled by the occurrence model. The empirical equations developed by Thornley (1986) involve a delaying effect on the initiation of germination that increases asymptotically as temperature
Table 5 Final parameterization, fitting statistics and model evaluation indexes for the selected occurrence and abundance germination models
Parameter Value SD df tvalue pvalue
Occurrence model
l1 11.1042 0.4056 4 27.38 \0.0001 AIC 2,041.1
a1 1.3376 0.4323 4 3.09 0.0364 Specificity (%) 84.2
b1 -0.0266 0.0022 4 -12.02 0.0003 Sensitivity (%) 84.3
s1 -1.9326 0.2989 4 -6.47 0.0020
rw2 0.8209 - - -
-Abundance model
a4 -8.7723 0.1962 712 -44.7080 \0.0001 AIC 1,908.229
k2 0.6818 0.1444 712 4.7217 \0.0001 LL -946.1143
l2 10.3706 0.2288 712 45.3271 \0.0001 E 0.0247
r2 52.4262 3.2065 712 16.3498 \0.0001 RMSE 0.9533
d -0.1432 - - - - EF 0.4040
u 0.4938 - - - - AR structure AR-1
rw2 0.1336 - - - - Weighed Var Power
l1–2,a1,a4,b1,s1andr2are parameters related to the fixed effects;rw2is the variance linked to year random effect;dis the power in the weighed
variance;uis the estimated auto-regressive parameter of order 1. LL is the logarithm of maximum likelihood estimate; E is the mean error;
RMSE is the root mean squared error; EF is the efficiency of the model; AR stands for auto-regressive structure and AR-1 is the AR of order 1
Fig. 7 Observed (circles) and predicted (crosses) cumulative germination rates for each measurement period and year. The latter were achieved from simultaneous conditional predictions of occurrence and abundance germination models
approaches 0°C. Therefore, an additional thermal covari-ate representing the proportion of freezing days was included in the model. This was done because the unfa-vourable effects of very low daily temperatures may not be adequately captured by an average explanatory variable.
The rest of variables considered accounted for light (GSF), overstory (IPOT), and understory (soil cover) con-ditions. Although GSF and IPOT were measured at seed point level, it is important to note that the range of variation for these variables is a consequence of stand silviculture.
As regards the response variable, the proposed approach directly estimates the instantaneous (fortnightly), non-cumulative germination proportion. If the adequate trans-formations are undertaken, classic metrics for germination (e.g. time to reach a cumulative germination percentile/ germination rate) can be straightforwardly deduced.
The intermittent pattern of germination implied a zero-inflated response variable for germination proportion, which is difficult to model conventionally. Modelling this kind of distribution can be approached through zero-inflated models (Flores et al.2006; Fortin and DeBlois2007), even in some cases where data correlation exists (Calama et al. 2011). However, when considering these techniques, classic tools for dealing with further residual assumption violations, such as those present in our data, are not currently implemented in common statistical software. Therefore, in order to avoid an excess of zeros, we modelled germination occurrence and abundance as two separate processes (Woollons1998). The selected germination occurrence model only inclu-ded temporal (thermal) covariates and therefore should be used to generate predictions at stand level. The scarce relevance of random effects other than measurement year suggests that unobserved spatial variability is very low with respect to event occurrence.
Similarly, the germination abundance model only con-siders temporal fixed effects. IPOT was the only spatial variable for which the associated parameter was found to be significant in some steps of the selection process. However, the auto-regressive structure absorbed the vari-ability explained by IPOT.
The accuracy of simultaneously fitting both models to the sample data set proved to be high. However, the main shortcoming is the tendency to overestimate early germi-nation events. The occurrence model bias appears to be responsible for this, since apparently favourable climatic conditions in the fall did not promote germination events. This particular weakness of the model might be linked to exceptional, unobserved delaying effects, the results of which persist long after their occurrence. From a man-agement point of view, this is not a major concern as long as the model can correctly predict annual germination proportion. However, this issue deserves further research in relation to other ecological applications.
Ecological and management implications
Our findings show that the temporal pattern of germination in P. pinea is climate mediated. The P. pinea seeds appeared to be extraordinarily sensitive to favourable conditions for germination, even after long periods of adverse conditions, suggesting an absence of dormant pine nuts. Non-dormancy behaviour has been reported for dif-ferent pine species (Castro et al. 2005; Chambers et al. 1999), although dormancy is not an uncommon mechanism within the genus (Cooke et al. 2002; Krakowski and El-Kassaby2005; Skordilis and Thanos1995).
The germination process commences when conditions are within the ecological range described by the occurrence model. These conditions refer exclusively to maximum temperature and frost occurrence, indicating that the readiness to overcome latency is thermally controlled in the species. Accordingly, Thornley (1986) defined delay in germination initiation as a function of temperature. In addition, it can be deduced from model formulation that even within the suitable average thermal range, freezing can condition the initiation of the process. Another reason for delay in germination initiation when carrying out arti-ficial seeding is genetic variability linked to varying origin of reproductive material. This circumstance does not apply in our case, given that seeds come from a restricted area. Once the occurrence conditions arise, germination pro-gression is driven by fortnightly mean temperature, relative humidity and precipitation occurrence. The most favour-able mean interval temperature derived from the abundance model is roughly 10°C, whereas negligible germination is predicted around the upper and lower limits of the interval 0–20°C. This suggests that temperatures close to the optimum for P. pinea (17.5°C) according to Magini (1955) are more likely to arise at the optimal interval described by our model. In addition, germination increases monotonically with the other two variables as expected, given that they are indirectly related to water potential. This relationship can be illustrated on the one hand by the importance of relative air humidity on water flow towards the top of the profile and the subsequent changes in water potential (Mu¨ller 2000). On the other hand, soil water content can be expressed as a function of time since the last significant rainfall (Roman et al. 2000), especially in soils with low WHC, such as those present in the Northern Plateau. Therefore, relative humidity will influence water loss through evapotranspiration whereas precipitation pro-vides water input.
Depending on the species requirements, high stand densities can enhance or reduce germination rates as a result of microclimate modification. Ordo´n˜ez et al. (2004) reported increasing germination figures in Pinus nigra under closed canopy in typically Mediterranean locations Eur J Forest Res
in the Eastern Iberian Peninsula. Similar results were reported by Lucas-Borja et al. (2011). However, Castro et al. (2005) observed decreasing germination rates in dense stands of Pinus sylvestrisin mountainous locations of the Iberian Peninsula. In our model selection process, a significantly positive influence of overstory competition (i.e. IPOT) was detected where no auto-regressive structure was applied. Overstory microclimate conditions seem to facilitate the process, which is consistent with the tendency of Mediterranean species. Consequently, lower intensity regeneration felling within the current management range (\50 % of the trees, leaving a density of over 75 stems/ha) will lead to an improvement in germination performance.
Another effect of maintaining higher stand densities would be to decrease the amount of light reaching the soil. Light incidence is generally considered to be positively related to germination. Moreover, it is thought to play an essential role as a gap detection mechanism (Silvertown 1980; Honda and Katoh 2007). However, the parameter reflecting GSF influence on germination was found to be non-significant within the range generated by the two tes-ted stand densities. Similarly, Pardos et al. (2010) con-cluded that this variable did not influence other physiological processes under current regeneration stand densities. Interestingly, Seiwa et al. (2009) stated that large-seeded, non-pioneer species exhibit little sensitivity to potential germination enhancement signals, probably due to the greater amount of metabolic reserves in larger seeds, which allows a wider range of conditions for ger-mination (Westoby et al.1992). This supports the findings of this study and the idea of light-independent germination in the species. In this respect, Calama et al. (2012) found that crown influence favours the survival of seedlings and that light stimulation is of little biological importance inP. pineaseed germination.
The two spatial effects which are unrelated to plot density in this experimental design were WHC and understory cover. The former was non-significant, probably due to the homogeneity of the soil. The latter was also found to not affect germination, which surely reflects the effect of artificial conditions created when seeding.
In general, the window of optimal climatic germination conditions forP. pinea seeds is often narrow. These con-ditions can occur in the Northern Plateau around November (fall germination) or April (spring germination), although in some years, they may not occur at all. In addition, preliminary assessments of future climate change in Spain (De Castro et al.2005) point to a decrease in precipitation and increasing mean and maximum temperatures, although minimum temperatures are expected to be more stable, particularly in winter. If these predictions are confirmed, the occurrence of optimal conditions for germination could be seriously threatened. As regards spatial distribution,
very low stand densities such as those resulting from cur-rent management methods appear not to enhance the process.
The combination of the common climatic adverse fac-tors occurring in the area and stand structure effect may lead to partial germination failure, which justifies the considerable current seeding effort. However, whereas climatic factors are not controllable, stand density can be easily managed to facilitate seed germination. In this respect, felling intensity is desirable to decrease. Because understocking has been reported to be a source of dispersal limitation in these stands (Manso et al. 2012), denser for-ests can also reduce the need for direct seeding in this sense. This is particularly true provided that it is possible to predict mast events 1 year in advance (Calama et al.2011). Furthermore, resulting seedlings would benefit from parent cover in the short term, given the medium shade tolerant behaviour ofP. pinea(Awada et al.2003).
Conclusion
The models presented in this study provide promising management tools for describing and predicting P. pinea germination occurrence and abundance, particularly as the explanatory variables used are readily available to forest managers. It can be inferred from these models that the temporal factors (climatic variables) are the main deter-minants of germination success, the suitable germination conditions occurring seldom. However, more progressive felling schedules would encourage germination, partially counteracting adverse climatic events. Denser stands would also rationalize the application of extensive seeding, improving seed dispersal features.
Acknowledgments First of all, we would like to express our most sincere gratitude to Mathieu Fortin for his valuable advice and sug-gestions, which notably improved the scope of this study. We are also grateful to the Forest Service of the Junta de Castilla y Leo´n and in particular to Ayuntamiento de El Portillo for permission to carry out the field experiment. Finally, we wish to thank Santiago de Blas and Enrique Garriga for their help in the data collection and Eduardo Lo´pez and Salvador Sastre for conducting the soil analysis. This research was supported by projects AGL 2010-15521 and RTA2007-00044.
References
Awada T, Radoglou K, Fotelli MN, Constantinidou HIA (2003) Ecophysiology of seedlings of three Mediterranean pine species in contrasting light regimes. Tree Physiol 23(1):33–41
Baeza MJ, Roy J (2008) Germination of an obligate seeder (Ulex
parviflorus) and consequences for wildfire management. For Ecol Manag 256:685–693
Barbeito I, Pardos M, Calama R, Can˜ellas I (2008) Effect of stand
structure on Stone pine (Pinus pineaL.) regeneration dynamics.
Forestry 81(5):617–629. doi:10.1093/forestry/cpn037
Bewley JD, Black M (1994) Seeds: physiology of development and germination, 2nd edn. Plenum press, New York
Bradford KJ (1990) A water relations analysis of seed germination rates. Plant Physiol 94:840–849
Calama R, Can˜adas N, Montero G (2003) Inter-regional variability in
site index models for even-aged stands of stone pine (Pinus
pineaL.) in Spain. Ann For Sci 60:259–269
Calama R, Montero G (2007) Cone and seed production from stone
pine (Pinus pineaL.) stands in Central Range (Spain). Eur J For
Res 126(1):23–35. doi:10.1007/s10342-005-0100-8
Calama R, Mutke S, Tome´ J, Gordo J, Montero G, Tome´ M (2011) Modelling spatial and temporal variability in a zero-inflated
variable: the case of stone pine (Pinus pineaL.) cone production.
Ecol Model 222(3):606–618. doi:10.1016/j.ecolmodel.2010.09.
020
Calama R, Madrigal G, Manso R, Garriga E, Gordo FJ, Pardos M (2012) Germinacio´n, emergencia y supervivencia de regenerado enPinus pineaL. In: Gordo J, Calama R, Pardos M, Bravo F, Montero G (eds) La regeneracio´n natural de los pinares en los arenales de la Meseta Castellana. Instituto Universitario de Investigacio´n en Gestio´n Forestal Sostenible (Universidad de Valladolid-INIA), Valladolid
Castro J, Zamora R, Ho´dar A, Go´mez J (2005) Ecology of seed
germination ofPinus sylvestrisL. at its southern, Mediterranean
distribution range. Investigacio´n Agraria: Sistemas y Recursos Forestales 14(2):143–152
Chambers J, Vander Wall S, Schupp E (1999) Seed and seedling ecology of pin˜on and juniper species in the Pygmy woodlands of Western North America. Bot Rev 65(1):1–38
Cochard R, Jackes BR (2005) Seed ecology of invasive tropical tree
Parkinsonia aculeata. Plant Ecol 180:13–31
Cook A, Turner SR, Baskin JM, Baskin CC, Steadman KJ, Dixon KW (2008) Occurrence of physical dormancy in seeds of Australian sapindaceae: a survey of 14 species in nine genera. Ann Bot 101:1349–1362
Cooke J, Cooke B, Gifford D (2002) Loblolly pine seed dormancy: constraints to germination. New For 23:239–256
De Castro M, Martı´n-Vide J, Alonso S (2005) The climate of Spain: past, present and scenarios for the 21st century. In: A preliminary assessment of the impacts in Spain due to the effects of climate change. ECCE Project-Final report. Ministerio de Medio Ambiente, Madrid
De Luis M, Ravento´s J, Wiegand T, Gonza´lez-Hidalgo JC (2008) Temporal and spatial differentiation in seedling emergence may promote species coexistence in Mediterranean fire-prone eco-systems. Ecography 31:620–629
Flores O, Gourlet-Fleury S, Picard N (2006) Local disturbance, forest structure and dispersal effects on sapling distribution of light-demanding and shade-tolerant species in a French Guianian forest. Acta Oecologica 29:141–154
Fortin M, DeBlois J (2007) Modelling tree recruitment with zero-inflated models: the example of hardwood stands in Southern Que´bec. For Sci 53(4):529–539
Gordo FJ (2002) Cuarta Revisio´n de la Ordenacio´n de los Montes Navales, Molinillo y La Reguera y La Vega y Zapardiel del te´rmino municipal de Tordesillas. Servicio Territorial de Medio Ambiente de Valladolid, Junta de Castilla y Leo´n, Valladolid Gordo FJ, Rojo LI, Calama R, Mutke S, Martı´n R, Garcı´a M (2012)
Selvicultura de regeneracio´n natural dePinus pineaL. en montes
pu´blicos de la provincia de Valladolid. In: Gordo J, Calama R, Pardos M, Bravo F, Montero G (eds) La regeneracio´n natural de los pinares en los arenales de la Meseta Castellana. Instituto
Universitario de Investigacio´n en Gestio´n Forestal Sostenible (Universidad de Valladolid-INIA), Valladolid, p 254
Hardegree SP, Flerchinger GN, Van Vactor SS (2003) Hydrothermal germination response and the development of probabilistic germination profiles. Ecol Model 167:305–322
Honda Y, Katoh K (2007) Strict requirement of fluctuating
temper-atures as a reliable gap signal inPicris hieracioidesvar.japonica
seed germination. Plant Ecol 193:147–156
Kamkar B, Al-Alahmadi MJ, Mahdavi-Damghani A, Villalobos FJ (2012) Quantification of the cardinal temperatures and thermal
time requirement of opium poppy (Papaver somniferum L.)
seeds to germinate using non-linear regression models. Ind
Crops Prod 35(1):192–198. doi:10.1016/j.indcrop.2011.06.033
Keyes CR, Maguire DA, Tappeiner JC (2009) Recruitment of ponderosa pine seedlings in the Cascade Range. For Ecol Manag 257:495–501
Krakowski J, El-Kassaby YA (2005) Lodgepole pine and white spruce germination: effects of stratification and simulated aging. Silvae Genetica 54(3):138–144
Kuuluvainen T, Pukkala T (1989) Simulation of within-tree and between-tree shading of direct-radiation in a forest canopy: effect of crown shape and sun elevation. Ecol Model
49(1–2):89–100. doi:10.1016/0304-3800(89)90045-8
Lippai A, Smith PA, Price JW, Lloyd CJ (1996) Effects of temperature and water potential on germination of horehound (Marrubium vulgare) seeds from two Australian localities. Weed Sci 44:91–99
Lucas-Borja M, Fonseca T, Parresol B, Silva-Santos P, Garcı´a-Morote F, Tı´scar-Oliver P (2011) Modelling Spanish black pine seedling emergence: Establishing management strategies for endangered forest areas. For Ecol Manag (in press)
Madrigal G, Pardos M, Garriga E, Montero G, Manso R, Calama R
(2011) Sitios se ensayo INIA de regeneracio´n natural enPinus
pinea. In: Gordo J, Calama R, Pardos M, Bravo F, Montero G
(eds) La regeneracio´n natural dePinus pineaL. yPinus pinaster
Ait. en los arenales de la Meseta Castellana. Actas de las I Jornadas de Transferencia Tecnolo´gica y Cientı´fica (in press) Magini E (1955) Sulle condizioni di germinazione del pino d’Aleppo
e del pino domestico. Italia Forestale e Montana Anno 40:106–124
Manso R, Pardos M, Garriga E, De Blas S, Madrigal G, Calama R (2010) Modelling the spatial-temporal pattern of post-dispersal
seed predation in stone pine (Pinus pinea L.) stands in the
Northern Plateau (Spain). Paper presented at the Frugivores and Seed Dispersal: Mechanisms and Consequences of a Key Interaction for Biodiversity, Montpellier (France), 13th–18th June 2010
Manso R, Pardos M, Keyes CR, Calama R (2012) Modelling the
spatio-temporal pattern of primary dispersal in stone pine (Pinus
pinea L.) stands in the Northern Plateau (Spain). Ecol Model 226:11–21
Meyer SE, Pendleton BK (2005) Factors affecting seed germination
and seedling establishment of a long-lived desert shrub (
Coleo-gyne ramosissima: Rosaceae). Plant Ecol 178:171–187 Mu¨ller C (2000) Modelling soil-biosphere interactions. CABI, New
York
Nomiya H (2010) Differentiation of seed germination traits in relation to the natural habitats of three Ulmus species in Japan. J For Res 15:123–130
Ooi MKJ (2010) Delayed emergence and post-fire recruitment success: effects of seasonal germination, fire season and dormancy type. Aust J Bot 58:248–256
Ordo´n˜ez JL, Franco S, Retana J (2004) Limitation of the recruitment ofPinus nigrain a gradient of post-fire environmental condi-tions. Ecoscience 11:296–304
Eur J Forest Res
Pardos M, Puertolas J, Madrigal G, Garriga E, de Blas S, Calama R (2010) Seasonal changes in the physiological activity of
regeneration under a natural light gradient in a Pinus pinea
regular stand. For Syst 19(3):367–380
Pinheiro J, Bates D, DebRoy S, Sarkar D, R CT (2009) nlme: Linear and nonlinear mixed effects models. R package version 3.1-96 Prada MA, Gordo J, De Miguel J, Mutke S, Catala´n G, Iglesias S, Gil
L (1997) Las regiones de procedencia de Pinus pineaL. en
Espan˜a. Ministerio de Medio Ambiente, Madrid
Puerta-Pin˜ero C, Go´mez JM, Zamora R (2006) Species-specific
effects on topsoil development affect Quercus ilex seedling
performance. Acta Oecologica 29:65–71
R DCT (2009) R: A language and environment for statistical computing. R Foundation for Statistical Computing, Vienna Roman ES, Murphy SD, Swanton CJ (2000) Simulation of
Cheno-podium album seedling emergence. Weed Sci 48(2):217–224. doi:10.1614/0043-1745(2000)048[0217:socase]2.0.co;2 Ruano I, Pando V, Bravo F (2009) How do light and water influence
Pinus pinasterAit. germination and early seedling development? For Ecol Manag 258:2647–2653
Seiwa K, Ando M, Imaji A, Tomita M, Kanou K (2009) Spatio-temporal variation of environmental signals inducing seed germination in temperate conifer plantations and natural hard-wood forests in northern Japan. For Ecol Manag 257:361–369 Silveira FAO, Negreiros D, Fernandes W (2004) Influeˆncia da luz e
da temperatura na germinac¸a˜o de sementes deMarcetia taxifolia
(A. St.-Hil.) DC. (Melastomataceae). Acta Botanica Brasilica 18(4):847–851
Silvertown J (1980) Leaf-canopy-induced seed dormancy in a grassland flora. New Phytol 85:109–118
Skordilis A, Thanos CA (1995) Seed stratification and germination
strategy in the Mediterranean pines Pinus brutia and Pinus
halepensis. Seed Sci Res 5:151–160
Snowdon P (1991) A ratio estimator for bias correction in logarithmic
regressions. Can J For Res 21(5):720–724. doi:10.1139/x91-101
Thornley JHM (1986) A germination model: responses to time and
temperature. J Theor Biol 123(4):481–492. doi:
10.1016/s0022-5193(86)80215-6
Westoby M, Jurado E, Leishman M (1992) Comparative evolutionary ecology of seed size. Trends Ecol Evol 7(11):368–372 Woollons RC (1998) Even-aged stand mortality estimation through a
two-step regression process. For Ecol Manag 105(1–3):189–195. doi:10.1016/s0378-1127(97)00279-x
Wu HI, Sharpe PJH, Walker J, Penridge LK (1985) Ecological field-theory: a spatial-analysis of resource interference among plants.
Ecol Model 29(1–4):215–243. doi:10.1016/0304-3800(85)90054-7
Zuur A, Ieno E, Walker N, Saveliev A, Smith G (2009) Mixed effects models and extensions in ecology with R Statistics for Biology and Health. Springer, New York