TítuloPhysical activity and fitness levels of Physical Education and Sports teacher Department students during the graduation
15
0
0
Texto completo
(2) Original article. Physical activity and fitness levels of Physical Education and Sports teacher Department students during the graduation. Vol. 6, nº. 1; p. 166-180, enero 2020. A Coruña. España ISSN 2386-8333. Resumen Este estudio tuvo como objetivo comparar la actividad física y el estado físico de los estudiantes del departamento de educación física y de deportes, e investigar la relación entre los parámetros físicos y el éxito académico. Veinticinco (13 hombres y 12 mujeres) se ofrecieron como voluntarios para participar en este estudio. Se analizó la composición corporal medida a través del método de impedancia bioeléctrica, se realizó una prueba de funcionamiento de la lanzadera. Se realizó un cuestionario de actividad física internacional. Los antecedentes deportivos y los puntos de examen de educación superior, los niveles de actividad física y el éxito académico han sido similares en ambos sexos. Sin embargo, los resultados de la capacidad aeróbica disminuyeron en comparación con la entrada a la universidad con la graduación en estudiantes masculinos y femeninos. Además, hubo una correlación entre el porcentaje de cambio de VO2max y el éxito académico. Los requisitos del departamento de educación física y deportes no pueden mantenerse hasta la graduación. Estos resultados indican que las pruebas físicas no afectan las cantidades de graduación del maestro de educación física. Sin embargo, la relación entre el porcentaje de cambio de VO2max y el éxito académico es un indicador importante de que los deportes activos y la actividad física pueden ser beneficiosos. Para crecer mejores y más maestros de educación física cuantitativos, los estudios futuros requieren investigar las pruebas físicas actuales que realizaron la entrada de educación física y educación de maestros de deportes y consultas que hacen pruebas físicas un buen método para lograr los objetivos solicitados. Palabras clave Composición corporal; Educación Física; Actividad Física; Fitness test Abstract This study aimed to compare physical activity and fitness of physical education and sports teacher department students and investigate the relationship between physical parameters and academic success. Twenty-five (13 male and 12 female) students volunteered to participate in this study. Sportive background and higher education examination points, shuttle run test scores, and academic success pieces of information of students were taken from the personal folder with the permission of faculty administration. Body composition measured via bioelectric impedance method, shuttle run test performed. Self-admitted international physical activity questionary (long form) was performed. Sportive background and higher education examination points, physical activity levels, and academic success have founded similar within both sexes. However, aerobic capacity results decreased when compared to the entrance of the college with graduation in both male and female students. Also, there was a correlation between VO2max change percentage and academic success. Requirements of physical education and sports department cannot maintain until graduation. These results indicate that there is not an impact of physical tests to graduation quantities of the physical education teacher. However, the relationship between VO2max change percentage and academic success is important indicator that active playing sports and physical activity may be beneficial. To grow up better and more quantitative physical education teachers, future studies require to investigate current physical test which performed the For cite this article you must use the next reference: Gençoğlu, C.; Gümüş, H.; Özdalyan, F.; Kosova, S.; Mancı, E. (2020). Physical activity and fitness levels of Physical Education and Sports teacher Department students during the graduation. Sportis Sci J, 6 (1), 166-180. DOI: https://doi.org/10.17979/sportis.2020.6.1.5843. http://revistas.udc.es/. 167.
(3) Original article. Physical activity and fitness levels of Physical Education and Sports teacher Department students during the graduation. Vol. 6, nº. 1; p. 166-180, enero 2020. A Coruña. España ISSN 2386-8333. entrance of physical education and sports teacher education and querying that do physical tests a good method to attain requested goals. Keywords Body composition; Physical Education; Physical Activity; Fitness test. Introduction In the profession of physical education and sports teaching, commitment to physical fitness and healthy living behaviors are the most prominent features. For a long time, the level of physical fitness of physical education teachers has been an important research topic and it is stated that physical fitness is one of the goals that physical education and sports teaching programs aim to provide to prospective teachers (Staffo and Stier, 2000). The departments of physical education and sports accept students by scoring the special talent exams and resumes of the athletes, as well as their university entrance exams. Although special talent exams may vary according to each university, candidates are expected to demonstrate competence in coordination, endurance and speed tests, gymnastics, or athletics branches. During the school year, students can move away from sports and into an inactive life due to the intensity of academic life or different reasons. It is known that university students are not good at maintaining proper life behaviors such as being physically active and eating healthy (Healty People, 2010; Deliens et al., 2015). In a large-scale study, it was shown that mobile phone use and messaging habits of university students had a negative relationship with academic performance and a positive relationship with anxiety disorder (Lepp et al., 2014). In parallel with this research, it was found that people with a high frequency of mobile phone use had increased physical inactivity and sedentary life habits (Lepp et al., 2013). The incidence of physical inactivity among university students is increasing and physical inactivity is defined as one of the primary health risk factors in this population (Healty Campus, 2010). Huang et al. (2003) in their study examining body composition nutritional habits and physical activities of university students found that 21.6% of the students were overweight and 16.2% were obese according to body mass index, and their weekly physical activities were less than 3 days/week. In a study examining the relationship between the quality of life and physical For cite this article you must use the next reference: Gençoğlu, C.; Gümüş, H.; Özdalyan, F.; Kosova, S.; Mancı, E. (2020). Physical activity and fitness levels of Physical Education and Sports teacher Department students during the graduation. Sportis Sci J, 6 (1), 166-180. DOI: https://doi.org/10.17979/sportis.2020.6.1.5843. http://revistas.udc.es/. 168.
(4) Original article. Physical activity and fitness levels of Physical Education and Sports teacher Department students during the graduation. Vol. 6, nº. 1; p. 166-180, enero 2020. A Coruña. España ISSN 2386-8333. activity levels of university teaching department students (Tekkanat, 2008), physical activity and quality of life of physical education and sports teacher students were found to be higher than those of other teaching departments. Nevertheless, the results of the National Health Risk Behavior Survey showed that one-third of university students did not participate in physical activity sufficiently enough in terms of healthy-life risks (Douglas, 1997). Brockport State University in New York applies standard physical fitness tests to students of the physical education and sports teaching program during their studies and does not allow those who fail the test to graduate (Stier, 1999). For this reason, the students who want to study in physical education departments should have good sport performance and physical fitness levels besides their academic success. However, a study investigating the physical activity levels of physical education teachers showed that participants had an average 1380,16 min/week physical activity, 41,6 % were physically inactive, 41,6 % were minimum active, and only 16,8% were HEPA (Health-Enhancing Physical Activity) active (Arabacı and Çankaya, 2007). In another study, physical activity levels of physical education teachers seems to affects the motivational situation in the classroom which is beneficial to the students learning process. It has been suggested that higher fitness levels and maintaining to the exercise generates motivation to the physical education teachers (Alcalá et al. 2018). Nowadays, considering the fact that higher education students are faced with risk factors due to physical inactivity, it is necessary to identify the differences in academic achievement and physical activities of physical education students between the theoretical and practical courses during their education periods. In this respect, it is important to produce on-campus and off-campus solutions that increase physical activity. This study aims to compare the physical activity and physical performance parameters of students studying in the physical education and sports teaching departments between their school entrance and graduation, and to examine the relationship between them and academic achievement.. For cite this article you must use the next reference: Gençoğlu, C.; Gümüş, H.; Özdalyan, F.; Kosova, S.; Mancı, E. (2020). Physical activity and fitness levels of Physical Education and Sports teacher Department students during the graduation. Sportis Sci J, 6 (1), 166-180. DOI: https://doi.org/10.17979/sportis.2020.6.1.5843. http://revistas.udc.es/. 169.
(5) Original article. Physical activity and fitness levels of Physical Education and Sports teacher Department students during the graduation. Vol. 6, nº. 1; p. 166-180, enero 2020. A Coruña. España ISSN 2386-8333. Method 25 university students (13 male, 12 female), who started their education in 2015 at the Department of Physical Education and Sports Teaching, Faculty of Sport Sciences, and graduated in 2019 participated in this study. The research protocol was approved by the Local Ethics Board for Non-Interventional Studies (Decision number: 2019/16-26) and the volunteers were informed and written informed consents were obtained before the tests. In the study, the data of Athletic Background Score (ABS), University Exam Score (UES), Shuttle Run Test Score (STS) (applied in special talent exams), and Theoretical Course Achievement Score (TCAS) and Applied Course Achievement Score (ACAS) (of the courses taken in the department), were acquired from the personal student files with the faculty's consent. In the calculation of the success of the course, the letter grade (LG) was obtained by multiplying the grade of the student with the letter equivalent credit. The grade per credit (GPC) was calculated by summing the LGs of all courses taken by the student and dividing it by the student's credit. In order to compare the graduates with different credits, their LGs from the theoretical courses were divided into their total credits they got from the theoretical courses, and their GPC Theoretical (GPC_T) was calculated. Similarly, GPC Applied (GPC_U) and GPC Branch Applied (GPC_BU) were found by applying the same calculation for applied courses and sports-related courses. The number of active sports (APS) they did during the school year was asked to the participants and it was determined numerically over eight semesters. Body composition parameters such as body weight, skeletal muscle weight, fat percentage, fat weight, and waist-hip ratio were determined by a segmental body composition analyzer (Biospace Inbody 170, Korea), which can be measured by bioelectrical impedance analysis (BIA) method. The measurements were carried out in accordance with the instructions specified by the manufacturer after calibration with appropriate sports clothes, without metal touching the body, at least 2 hours before consuming any food or drink. The participants stepped on the device with a barefoot and care was taken to press the soles of the For cite this article you must use the next reference: Gençoğlu, C.; Gümüş, H.; Özdalyan, F.; Kosova, S.; Mancı, E. (2020). Physical activity and fitness levels of Physical Education and Sports teacher Department students during the graduation. Sportis Sci J, 6 (1), 166-180. DOI: https://doi.org/10.17979/sportis.2020.6.1.5843. http://revistas.udc.es/. 170.
(6) Original article. Physical activity and fitness levels of Physical Education and Sports teacher Department students during the graduation. Vol. 6, nº. 1; p. 166-180, enero 2020. A Coruña. España ISSN 2386-8333. foot to the electrodes. After measuring the bodyweight by standing still, height, age, and gender were entered. For the upper body measurement, the handles are taken with two hands and the arms are kept open from the body (Gibson, 2008). For the shuttle run test, the 20 m course was marked with traffic cones as start and end. The running speed was set by audible warning with a pre-recorded metronome. The initial running speed was set at 8.5 km/h and increased by 0.5 km/h per minute. Volunteers were asked to complete the 20-meter track and step on the signal line at each warning from the sound recording. The test was terminated if the person could not reach the target line twice in succession. The total number of shuttles including the last remaining shuttle was recorded. VO2max was calculated from the distance traveled (Ramsbottom, 1988). To determine the level of physical activity, the long form of the International Physical Activity Questionnaire (IPAQ), whose reliability and validity were tested for adults between 15 and 69 years of age in Turkey (Sağlam, 2010), was applied. The participants were asked about the physical activities they performed for at least 10 minutes a day in the last week, and the duration of their intensive physical activities, moderate-intensity activities, and walking were determined. The metabolic equivalent (MET) unit was used to indicate the level of physical activity. According to this, a person consumes 3.5 ml/kg/min of oxygen per body weight during rest (1 MET = 3.5 ml/kg/min). IPAQ results calculate the amount of energy that people spend in physical activity during the week in MET min/week, assuming 8 MET is spent for severe physical activity, 4 MET for moderate-intensity activity, and 3.3 MET for walking. As a result of the calculation, those whose physical activity level was <600 MET min/week were classified as inactive, >600 - 3000 MET min/week as minimum active, and <3000 MET min/week as HEPA active (Wanner et al 2016). Findings Descriptive data on the body composition of the participants were presented as means and standard deviations in Table 1 for girls, boys, and all students.. For cite this article you must use the next reference: Gençoğlu, C.; Gümüş, H.; Özdalyan, F.; Kosova, S.; Mancı, E. (2020). Physical activity and fitness levels of Physical Education and Sports teacher Department students during the graduation. Sportis Sci J, 6 (1), 166-180. DOI: https://doi.org/10.17979/sportis.2020.6.1.5843. http://revistas.udc.es/. 171.
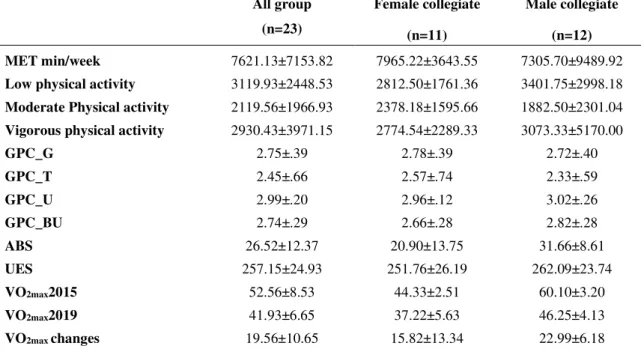
(7) Original article. Physical activity and fitness levels of Physical Education and Sports teacher Department students during the graduation. Vol. 6, nº. 1; p. 166-180, enero 2020. A Coruña. España ISSN 2386-8333. Table 1. Descriptive analysis of body composition according to sex All group. Female collegiate. Male collegiate. (n=23). (n=11). (n=12). Age (year). 22.67±1.27. 22.89±1.66. 22.47±0.82. Height (cm). 169.44±8.86. 161.72±5.02. 176.51±4.50. Weight (kg). 67.55±15.12. 57.31±9.57. 76.92±13.17. Skeletal muscle mass (kg). 40.18±6.24. 42.12±5.01. 38.39±6.91. Fat mass (kg). 13.88±5.13. 14.67±5.63. 13.15±4.75. Waist-Hip ratio. 0.85±0.04. 0.83±0.03. 0.87±0.04. Body mass index (kg/m2). 23.30±3.61. 21.80±2.62. 24.68±3.94. Fat percentage (%). 20.86±6.82. 25.05±5.99. 17.01±5.17. Table 2 shows the mean UES, athletic background scores, aerobic capacity changes, physical activity assessment results, and academic achievement scores. The ABS and UES added to the entrance talent exam scores, academic achievement and physical activity levels at the school were found to be similar for female and male students. Table 2. Athletic backround, academic succsess, physical activity and fitness paremeters during the acceptance to school and graduation. For cite this article you must use the next reference: Gençoğlu, C.; Gümüş, H.; Özdalyan, F.; Kosova, S.; Mancı, E. (2020). Physical activity and fitness levels of Physical Education and Sports teacher Department students during the graduation. Sportis Sci J, 6 (1), 166-180. DOI: https://doi.org/10.17979/sportis.2020.6.1.5843. http://revistas.udc.es/. 172.
(8) Original article. Physical activity and fitness levels of Physical Education and Sports teacher Department students during the graduation. Vol. 6, nº. 1; p. 166-180, enero 2020. A Coruña. España ISSN 2386-8333. All group. Female collegiate. Male collegiate. (n=23). (n=11). (n=12). MET min/week. 7621.13±7153.82. 7965.22±3643.55. 7305.70±9489.92. Low physical activity. 3119.93±2448.53. 2812.50±1761.36. 3401.75±2998.18. Moderate Physical activity. 2119.56±1966.93. 2378.18±1595.66. 1882.50±2301.04. Vigorous physical activity. 2930.43±3971.15. 2774.54±2289.33. 3073.33±5170.00. GPC_G. 2.75±.39. 2.78±.39. 2.72±.40. GPC_T. 2.45±.66. 2.57±.74. 2.33±.59. GPC_U. 2.99±.20. 2.96±.12. 3.02±.26. GPC_BU. 2.74±.29. 2.66±.28. 2.82±.28. ABS. 26.52±12.37. 20.90±13.75. 31.66±8.61. UES. 257.15±24.93. 251.76±26.19. 262.09±23.74. 52.56±8.53. 44.33±2.51. 60.10±3.20. VO2max2015 VO2max2019. 41.93±6.65. 37.22±5.63. 46.25±4.13. VO2max changes. 19.56±10.65. 15.82±13.34. 22.99±6.18. Aerobic capacity test results of the students at the date of graduation were observed to decrease significantly in both male and female participants compared to their entrance scores (p<0.001) (Figure 1).. Figure 1. Comparision of aerobic capacity acceptance to the college and graduation in both female and male students For cite this article you must use the next reference: Gençoğlu, C.; Gümüş, H.; Özdalyan, F.; Kosova, S.; Mancı, E. (2020). Physical activity and fitness levels of Physical Education and Sports teacher Department students during the graduation. Sportis Sci J, 6 (1), 166-180. DOI: https://doi.org/10.17979/sportis.2020.6.1.5843. http://revistas.udc.es/. 173.
(9) Original article. Physical activity and fitness levels of Physical Education and Sports teacher Department students during the graduation. Vol. 6, nº. 1; p. 166-180, enero 2020. A Coruña. España ISSN 2386-8333. Figure 2 shows the correlation matrix between the qualifications sought during the special talent exam for school entrance, the competencies gained during academic achievement at school, and the relationship between physical activity and physical fitness criteria at the time of graduation. There was a negative correlation between fat percentage and aerobic capacity values among the physical fitness parameters in the graduation year (r= - 0.69). There was a negative correlation between academic achievement (GPC_T) and the rate of VO2max changes that decreased during graduation in both genders (r= - 0.61). Similarly, there was a negative correlation between the percentage of VO2 changes and the period of active sports during school (r= - 0.51). There was a very weak positive correlation between YGS score and academic achievement (GPC_G, r= 0.36; GPC_T, r= 0.25; GPC_U, r= 0.47).. For cite this article you must use the next reference: Gençoğlu, C.; Gümüş, H.; Özdalyan, F.; Kosova, S.; Mancı, E. (2020). Physical activity and fitness levels of Physical Education and Sports teacher Department students during the graduation. Sportis Sci J, 6 (1), 166-180. DOI: https://doi.org/10.17979/sportis.2020.6.1.5843. http://revistas.udc.es/. 174.
(10) Original article. Physical activity and fitness levels of Physical Education and Sports teacher Department students during the graduation. Vol. 6, nº. 1; p. 166-180, enero 2020. A Coruña. España ISSN 2386-8333. For cite this article you must use the next reference: Gençoğlu, C.; Gümüş, H.; Özdalyan, F.; Kosova, S.; Mancı, E. (2020). Physical activity and fitness levels of Physical Education and Sports teacher Department students during the graduation. Sportis Sci J, 6 (1), 166-180. DOI: https://doi.org/10.17979/sportis.2020.6.1.5843. http://revistas.udc.es/. 175.
(11) Original article. Physical activity and fitness levels of Physical Education and Sports teacher Department students during the graduation. Vol. 6, nº. 1; p. 166-180, enero 2020. A Coruña. España ISSN 2386-8333. Figure 2. Relationship between talent exam qualifications and academic succsess, physical activity and graduation fittness level FP: Fat percentage, BMI: Body mass index, ABS: Athletic backgroun score, UES: University exam score, GPC_G: grade per credit in general, GPC_T: grade per credit in Theoretical classes, GPC_U: grade per credit in applied classes, GPC_BU: grade per credit in applied classes like team sports branches, APS: number of active semesters to participation to sports, 2015VO2: aerobic capacity during the acceptance to the college, 2019VO2: aerobic capacity during the graduation, VO2changes: difference percentage of 2015 and 2019 aerobic capacity, METweek: weekly physical activity levels according to IPAQ results, METLow: low intensity physical activity according to IPAQ results, METModerate: moderate physical activity according to IPAQ results, METVigorous: Vigorous physical activity according to IPAQ results Correlation is significant at the level * 0.05 ve ** 0.01. Discussion This study was conducted to determine the change in the physical fitness of the students in the department of teaching and their physical activity status at the time of graduation and to examine its relationship with academic achievement. The results of the study showed that both male and female students' aerobic capacity decreased significantly. In addition, it was observed that the relationship between the athlete resume score, university entrance exam score, and VO2max values, which are the required qualifications at the time of entry to school, and the academic achievement and physical activity cannot be maintained. The qualifications required from the students with special talent exams are thought to have no effect on the competencies required to be gained until graduation. However, the relationship between the VO2max change rate and academic success and the number of active sports periods during the school period are prominent parameters in terms of physically active students. In the literature, Staffo and Stier (2000) conducted a survey in the physical education departments of universities of different sizes (2500 provinces and a student population of 10000) and 69% of these departments did not conduct physical tests for various reasons such as a lack of administrative support, the fact that students may show physical development with the lessons they will take during school, and those with less physical fitness may be good teachers. 26% of the departments in the 69% tranche who did not conduct the entrance exam reported that they gave up their exams in the past. Baghurst and Bryant (2012) examined the For cite this article you must use the next reference: Gençoğlu, C.; Gümüş, H.; Özdalyan, F.; Kosova, S.; Mancı, E. (2020). Physical activity and fitness levels of Physical Education and Sports teacher Department students during the graduation. Sportis Sci J, 6 (1), 166-180. DOI: https://doi.org/10.17979/sportis.2020.6.1.5843. http://revistas.udc.es/. 176.
(12) Original article. Physical activity and fitness levels of Physical Education and Sports teacher Department students during the graduation. Vol. 6, nº. 1; p. 166-180, enero 2020. A Coruña. España ISSN 2386-8333. effectiveness of physical tests used at university entrance and argued that questioning the physical needs of physical education courses given during high school education would be a better selection method. However, there is no consensus as to when, and how physical testing of physical education and sports teachers should be applied. Similarly, in a study conducted by Petersen et al., which measured health-related physical fitness of university students, it was found that the students easily provided competence when the performance evaluation including the Fitnessgram, body-mass index, 1 mile running, sit-and-lie flexibility, push-ups, and shuttle run tests were performed. However, body composition tests were additionally conducted for students whose BMI results were higher than normal and 25% of girls and 32% of boys had fat percentage below the criteria (Petersen et al., 2003). Whether the body composition parameter is an elimination criterion for the physical education teacher is open to discussion. "Can the physical fitness parameters tested in the entrance examinations for physical education teachers be maintained during the training and can the students pass the same exam again when they graduate?" remains an unanswered question. In addition to students' academic achievement, physical fitness and body composition parameters can be repeated as a post-test at the end of the training period. This performance test, which the students have to prepare, can prevent physical inactivity and increase their motivation to exercise. Body composition also stands out as a restrictive factor for physical education teachers. It has been shown that overweight physical education teachers may encounter negative situations during the recruitment process. It is stated that candidates with less academic qualifications but more physical status are preferred over those with higher body weight in personnel selection (Melville and Cardinal, 1997). According to these results, it can be thought that gaining competence in terms of body composition will give the teaching students an advantage in the process of finding a job after graduation. Conclusion In order for physical education teacher candidates to be more qualified teachers, it is necessary to investigate the entrance talent exams in scientific terms and to evaluate the For cite this article you must use the next reference: Gençoğlu, C.; Gümüş, H.; Özdalyan, F.; Kosova, S.; Mancı, E. (2020). Physical activity and fitness levels of Physical Education and Sports teacher Department students during the graduation. Sportis Sci J, 6 (1), 166-180. DOI: https://doi.org/10.17979/sportis.2020.6.1.5843. http://revistas.udc.es/. 177.
(13) Original article. Physical activity and fitness levels of Physical Education and Sports teacher Department students during the graduation. Vol. 6, nº. 1; p. 166-180, enero 2020. A Coruña. España ISSN 2386-8333. appropriateness of the exam applications to the desired goal. The results of these studies are expected to provide feedback on the following: "Is the performance in the talent exams maintained in the long run?" and "Do the tested physical characteristics change over the course of education, and how does it relate to academic achievement?". References Hortigüela-Alcalá, D.; Salicetti-Fonseca, A.; Hernando Garijo, A.; Pérez Pueyo, A. (2018). Relationship between the level of physical activity and the motivation of physical education teachers. Sportis Sci J, 4 (2), 331-348. https://doi.org/10.17979/sportis.2018.4.2.3291 American College Health Association. Healthy Campus 2010: Make it Happen. Baltimore, MD: American College Health Association; 2002 Baghurst, T., & Bryant, L. (2012). Do as I say not as I do: Improving the image of our profession. Strategies, 25(4), 11–13. https://doi.org/10.1080/08924562.2012.10592156 Deliens, T., Deforche, B., De Bourdeaudhuij, I., & Clarys, P. (2015). Determinants of physical activity and sedentary behaviour in university students: a qualitative study using focus group discussions. BMC public health, 15(1), 201. https://doi.org/10.1186/s12889-0151553-4 Donald F. Staffo & William F. Stier Jr. (2000) The Use of Fitness Tests in PETE Programs, Journal. of. Physical. Education,. Recreation. &. Dance,. 71:5,. 48-52.. https://doi.org/10.1080/07303084.2000.10605146 Douglas KA, Collins JL,Warren CW, et al. Results from the 1995 National College Health Risk. Behavior. Survey.. J. Am. Coll. Health.. 1997;46:55–66.. https://doi.org/10.1080/07448489709595589 Gibson AL, Holmes JC, Desautels RL, Edmonds LB, and et al. (2008). Ability Of New Octapolar. Bioimpedance. Spectroscopy. Analyzers. To. Predict. 4-Component–Model. Percentage Body Fat In Hispanic, Black, And White Adults. Am J Clin Nutr, 87: 332– 8. https://doi.org/10.1093/ajcn/87.2.332. For cite this article you must use the next reference: Gençoğlu, C.; Gümüş, H.; Özdalyan, F.; Kosova, S.; Mancı, E. (2020). Physical activity and fitness levels of Physical Education and Sports teacher Department students during the graduation. Sportis Sci J, 6 (1), 166-180. DOI: https://doi.org/10.17979/sportis.2020.6.1.5843. http://revistas.udc.es/. 178.
(14) Original article. Physical activity and fitness levels of Physical Education and Sports teacher Department students during the graduation. Vol. 6, nº. 1; p. 166-180, enero 2020. A Coruña. España ISSN 2386-8333. Huang, T. T. K., Harris, K. J., Lee, R. E., Nazir, N., Born, W., & Kaur, H. (2003). Assessing overweight, obesity, diet, and physical activity in college students. Journal of American College Health, 52(2), 83-86. https://doi.org/10.1080/07448480309595728 Lepp, A., Barkley, J. E., & Karpinski, A. C. (2014). The relationship between cell phone use, academic performance, anxiety, and satisfaction with life in college students. Computers in Human Behavior, 31, 343-350. https://doi.org/10.1016/j.chb.2013.10.049 Lepp, A., Barkley, J. E., Sanders, G. J., Rebold, M., & Gates, P. (2013). The relationship between cell phone use, physical and sedentary activity, and cardiorespiratory fitness in a sample of US college students. International Journal of Behavioral Nutrition and Physical Activity, 10, 79. https://doi.org/10.1186/1479-5868-10-79 Melville, D.S., & Cardinal, B. (1997). Are overweight physical educators at a Disadvantage in the labor market? A random survey of hiring personnel. The Physical Educator, 54, 216221 Petersen, S., Byrne, H., & Cruz, L. (2003). The Reality of Fitness for Pre-Service Teachers: What Physical Education Majors" Know and Can Do". The Physical Educator. R. Arabacı & C. Çankaya Beden Eğitimi Öğretmenlerinin Fiziksel Aktivite Düzeylerinin Araştırılması Eğitim Fakültesi Dergisi XX (1), 2007, 1-15 Ramsbottom R, Brewer J and Williams C (1988) A progressive shuttle run test to estimate maximal. oxygen. uptake.. British. Journal. of. Sports. Medicine. 22:141-144.. https://doi.org/10.1136/bjsm.22.4.141 Saglam M, Arikan H, Savci S, Inal-Ince D, Bosnak-Guclu M, Karabulut E, et al. (2010). International physical activity questionnaire: reliability and validity of the Turkish version. Perceptual and motor skills.111(1):278-84. https://doi.org/10.2466/06.08.PMS.111.4.278-284 Stier, W. F., Jr. (1999). Expectations of a fitnesslwellness professional in the 21st century. Paper presented at the Eighth Annual Health, Promotion & Aerobic Convention, Taipei, Taiwan. For cite this article you must use the next reference: Gençoğlu, C.; Gümüş, H.; Özdalyan, F.; Kosova, S.; Mancı, E. (2020). Physical activity and fitness levels of Physical Education and Sports teacher Department students during the graduation. Sportis Sci J, 6 (1), 166-180. DOI: https://doi.org/10.17979/sportis.2020.6.1.5843. http://revistas.udc.es/. 179.
(15) Original article. Physical activity and fitness levels of Physical Education and Sports teacher Department students during the graduation. Vol. 6, nº. 1; p. 166-180, enero 2020. A Coruña. España ISSN 2386-8333. Tekkanat, Ç. (2008). Öğretmenlik bölümünde okuyan öğrencilerde yaşam kalitesi ve fiziksel aktivite düzeyleri (Master's thesis, Pamukkale Üniversitesi Sağlık Bilimleri Enstitüsü). US Dept of Health and Human Services. Healthy People 2010: Understanding and Improving Health. 2nd ed. Washington, DC: US Government Printing Office; 2000. Wanner, M., Probst-Hensch, N., Kriemler, S., Meier, F., Autenrieth, C., & Martin, B. W. (2016). Validation of the long international physical activity questionnaire: influence of age and. language. region.. Preventive. medicine. reports,. 3,. 250-256.. https://doi.org/10.1016/j.pmedr.2016.03.003. For cite this article you must use the next reference: Gençoğlu, C.; Gümüş, H.; Özdalyan, F.; Kosova, S.; Mancı, E. (2020). Physical activity and fitness levels of Physical Education and Sports teacher Department students during the graduation. Sportis Sci J, 6 (1), 166-180. DOI: https://doi.org/10.17979/sportis.2020.6.1.5843. http://revistas.udc.es/. 180.
(16)
Figure

Documento similar
Thus, the objective of this study is twofold: First, it seeks to discover the level of sports participation and the physical activity habits of participants in a popular
Alternatively, parent-reported physical activity levels of their children are an alternative method, and it is of interest to test whether a single question on parents’ rated
Teaching Games for Understandings vs Direct Instruction: levels of physical activity on football U-12 S Teaching Games For Understanding vs Modelo Tradicional: niveles de
The aims of this study were to examine how much of the PE time 13-year-old students were in moderate and vigorous physical activity MVPA level and differences between boys and girls
Our results indicated that the use of the school environment, in addition to increasing the weekly physical activity volume, presented benefits for physical fitness in our protocol,
A)To know the methodological treatment that must be carried out in the teaching-learning process through games and sports in Primary Education. B) To value the important presence
(n = 147) of the students were studying either for the official degree in physical activity and sports sciences or for the official degree in primary education with a mention
For both, the unadjusted and adjusted model, the OR for the questions related to parents (to encourage to practice sports and physical activity and to be physically active) was
