Recovery of proteins from biomass grown in pig manure microalgae-based treatment plants by alkaline hydrolysis and acidic precipitation.
Ana Lorenzo Hernandoa, c, JavierRuiz Vegasa,Marisol Vega Alegreb, c,Silvia Bolado Rodrígueza, c *
a Department of Chemical Engineering and Environmental Technology, University of Valladolid, Calle Doctor Mergelina s/n, 47011, Valladolid, Spain
b Department of Analytical Chemistry. Campus Miguel Delibes, 8. Paseo Belén 7,
47011, Valladolid, Spain.
c Institute of Sustainable Processes. University of Valladolid, 47011, Valladolid, Spain
Abstract
The influence of three variables on key parameters of the protein extraction process (an
alkaline hydrolysis followed by an acidic precipitation) for biomass from innovative photo-bioreactors for pig manure treatment was evaluated. Alkaline hydrolysis provided
high solubilisation values (up to 66.5% of the biomass), augmenting with increasing values of the three studied variables (NaOH concentration, temperature and time). Nevertheless, moderate total (13.2%) and protein extraction yields (16.9%) were
obtained, which was attributable to protein denaturation or to the low effectivity of the precipitation method. Extracts rich in proteins (53.5% – 77.9%) with suitable amino
acid profiles were obtained, but significant amounts of the initial lipids (up to 44.6%) were co-extracted probably due to fatty acids saponification. These results establish the
first step for future studies in enhancing cell wall disruption and protein recovery by
coupling alkaline hydrolysis with other mechanical pre-treatments, while considering alternative separation and purification methods.
Highlights
Protein recovery by pH-shift from a consortium microalgae-bacteria biomass.
ANOVA of NaOH concentration, temperature and time effect on process parameters.
Intermediate alkaline concentration (0.5M NaOH) provided maxima extraction yields.
High solubilisation by alkaline hydrolysis but low acidic precipitation efficiency.
Co-extraction of lipids increased with process intensity.
Keywords
1. Introduction
Consortia of microalgae and bacteria have been recently used in innovative
wastewater and pig manure treatment plants to enhance removal efficiency and reduce energy requirements compared to conventional processes. Since microorganisms use the
pollutants contained in the wastewaters to grow, these processes generate high amounts of biomass. Specifically, microalgae metabolise nutrients present in the wastewaters into proteins, carbohydrates and lipids through photosynthesis. This process provides a
mixed microalgae-bacteria biomass rich in microalgae, with a macromolecular
composition similar to that of any other microalgae biomass obtained in sterilized media
(Acién et al., 2016). This biomass produced by wastewater remediation could be a very cheap and valuable source of a multitude of products by applying the current concepts of circular economy or biorefinery (Chew et al., 2017; Molinuevo-Salces et al., 2015;
Vanthoor-Koopmans et al., 2013). From the three main macromolecular components (proteins, lipids and carbohydrates) of the biomass, protein fraction is usually the richest
(up to 70% of the dry weight of the biomass (Becker, 2007)), but also the most sensitive to harsh operation conditions such as low pH or high temperatures. Thus, to preserve their properties as much as possible, protein extraction would be one of the first steps to
be considered in a biorefinery approach. Since the culture media used for biomass production is wastewater, proteins obtained through these processes cannot be used for
human consumption, but they are perfectly suitable for other commercial applications such as animal feed, bio-fertilizers, as pigments source like phycobiliproteins, and foaming or emulsifying agents (Benelhadj et al., 2016; Bleakley and Hayes, 2017;
Suganya et al., 2016).
presence of a rigid cell wall protecting the intracellular content and acting as a barrier against pathogens and severe environmental conditions (Phong et al., 2018b). This cell
wall could be especially recalcitrant in microalgae species able to grow in stressing environments and used for wastewater remediation, such as Scenedesmus sp. or other
coccoid green algae (Dunker and Wilhelm, 2018; Scholz et al., 2014; Voigt et al., 2014), given that it provides tolerance to high organic loads and physiological stresses (Gupta et al., 2016). In this regard, several mechanical treatments, most of them under
alkaline conditions, have been tested. In the great majority of cases, tests were done for particular microalgae species grown in sterilized synthetic media, and for pre-defined
“optimal” conditions, which does not allow for an understanding of the influence of the operation parameters on the protein extraction process. One of the few published studies that includes the effect of operation parameters was performed by (Gerde et al., 2013),
who studied the effect of temperature, time, pH and defatting pre-treatment when evaluating a protein extraction method from Nannochloropsis sp. biomass combining
ultrasonication and pH-shift. They found a maximum recovery of around 15% from a 1% suspension of sonicated non-defatted biomass after extraction at 60º C, pH 11 for 5h. (Ursu et al., 2014) used a high-pressure cell disrupter instead of ultrasonication for
enhancing alkaline protein extraction from Chlorella vulgaris biomass, achieving 98% of protein solubilisation after 2 x 2.7 kbar at pH 12. They also reported a minimum
solubilization when using only chemical treatment (2.3% at pH 12). In contrast, the work by (Safi et al., 2014) showed remarkable protein release (around 25%) from C. vulgaris and N. oculata biomass when using only alkaline treatment (pH 12, 2h and 40º
extracts containing 23%, 12% and 42% of protein, lipid and carbohydrate content, respectively. (Teuling et al., 2017) systematically compared composition (proximate,
amino acid and fatty acid compositions) and solubility of protein extracts from four pure microalgae species, being one of them Scenedesmus dimorphus, using a delicate
isolation process based on bead milling as in the previous example but using a potassium phosphate buffer to bring the solution under alkaline conditions (pH 8.0). They obtained the lowest protein yield (17%) for S. dimorphus biomass which was
attributed to its highly recalcitrant cell wall. Recently, (Ansari et al., 2018) used in their work biomass obtained from the cultivation of an isolated strain of Scenedesmus
obliquus in municipal wastewater as culture medium, but they mainly focused on lipid
extraction.
Alkaline hydrolysis conditions are crucial to obtain high yields and quality of
extracts because they are responsible for an efficient protein solubilisation. Cell wall configuration, composition and proteins nature could show a great variability depending
on the environmental growth conditions of the biomass (Phong et al., 2018b).
Therefore, deductions for microalgae-bacteria mixtures cultured in wastewaters cannot be directly inferred from results for pure species, and a preliminary study should be
done to optimize this process in terms of chemicals, energy and time prior to any coupling with other mechanical pre-treatments. In this work, a pH-shift process for
biomass grown in photo-bioreactors for pig manure treatment has been studied. The protein extraction process was adapted from (Gerde et al., 2013).
The influence of three operational parameters (alkali concentration, temperature and
quality was evaluated considering the amino acid profile of extracts as well as their proximate composition. The distribution of the organic nitrogen among the different
final phases has also been studied. 2. Materials and methods
2.1. Raw Biomass
Freeze-dried biomass used in this work was kindly provided by University of Almería (Spain) and stored at 4º C until use. This biomass was recovered from a
photo-bioreactor used for pig manure wastewater remediation during September-October 2016, freeze-dried and stored at 4º C until further use. It was mainly composed of the
microalgae Scenedesmus almeriensis. The macromolecular composition of this biomass was determined as 46.7 ± 0.8% proteins, 43.5 ± 4.3% carbohydrates, and 9.4% ± 0.3% lipids in dry-weight ash-free basis. Ash content of the original raw material was 15.6 ±
0.28% in dry-weight basis.
2.2. pH-shift process: Alkaline hydrolysis and acidic precipitation
Figure 1 shows a diagram of the process. Biomass suspensions were prepared at 5% w/w by adding 5M NaOH and distilled water up to the required alkali concentration. Alkaline hydrolysis assays were conducted in an orbital shaker at 200 rpm at the
corresponding temperature for each run. Once the reaction time was completed,
hydrolysates were centrifuged at 18500xg for 15 minutes at 4º C. Solids recovered from
this first centrifugation, denoted as “spent biomass”, were dried at 40º C, its weigh recorded and stored at 4º C for further analysis (evaluated properties were total solids content (TS, %), ash content (%) and – for some selected experiments – the organic
precipitation by adding 2M HCl until reaching pH 2.5. Acidified suspension was then centrifuged (18500xg for 15 minutes at 4º C). The liquid phase obtained after this
second centrifugation step (called acid supernatant) was recovered for some selected runs and kept separately for further analysis of organic nitrogen content. The solid phase
(the so-called extract) was dried at 40º C, its weigh recorded and stored at 4º C for further analysis: TS content, ash content and proximate composition (protein, carbohydrate and lipid content). The amino acid profile was also evaluated for some
selected extracts (Cavonius et al., 2015; Gerde et al., 2013).
The total extraction yield, as well as the protein, lipid and carbohydrate extraction
yields, the solubilisation yield and the protein-to-lipid ratio of the extracts, were calculated as expressed in the following equations. Since the ash content was expected to be considerably high due to the combined use of NaOH and HCl during the different
steps of the extraction process, all the calculations were made in a dry-weight ash-free basis.
YT (%) = mextract⁄m ×100 (Eq. 1)
YP % = ( (mextract ×Pextract % ⁄ m ×P0 % )×100 (Eq. 2)
Y (%) = (mextract ×Lextract % ⁄ m0×L0 (%))) ×100 (Eq. 3)
Y (%) = (mextract ×CHextract % ⁄(m0×CH0 (%))) ×100 (Eq. 4)
S (%) = 100 (mspent⁄m0×100) (Eq. 5)
P-to-Lratio (dim.-less) = Pextract⁄Lextract (Eq. 6) Where YT (%) is the total extraction yield, mextract is the dry-basis ash-free mass
extract, L0 (%) is the lipid content of the raw biomass, YCH (%) is the carbohydrate extraction yield, CHextract (%) is the carbohydrate content of the extract, CH0 (%) is the carbohydrate content of the raw biomass, S (%) is the solubilisation yield, mspent is the dry-basis ash-free amount of the spent biomass recovered after alkaline hydrolysis, and
P-to-Lratio is the mass protein-to-lipid ratio of the extracts.
The effect of the three process parameters (alkali concentration – B (mol L-1) –, temperature – T (º C) –, and time – t (h) –) and the interactions between them were
evaluated at three levels (low, medium and high which were numbered as 0, 1, 2). Parameters levels were selected according to previous works (Gerde et al., 2013; Safi et
al., 2014), introducing the most common values for each parameter as the intermediate level magnitude and adding rational minimum and maximum values according to them. It has been considered as well operational restrictions; e.g. a maximum temperature of
55º C had to be defined to avoid protein denaturation (Bischof and He, 2005), or 5h as hydrolysis time was selected since longer times could not be industrially suitable.
Parameter levels were hence defined as follows: the NaOH concentration selected values were 0.1, 0.5 and 2M; the temperature selected values were 25, 40 and 55 º C, and the hydrolysis time selected values were 0.5, 2 and 5h. Experimental runs have been
coded according to the corresponding levels applied, in the same order as described previously, e.g. experimental Run 210 would correspond with the hydrolysis conditions
of an alkali concentration of 2M NaOH (Level 2), a temperature of 40º C (Level 1) and a hydrolysis time of 0.5h (Level 0), and thus coded as 2 1 0.
and T – t; and B – T – t) for four outputs: total extraction yield, protein extraction yield, lipid extraction yield, and solubilisation yield. For this, a multi-factor analysis of
variance (ANOVA) was applied to determine the significant differences (considering a confidence interval of 95%) among the levels of operational parameters in terms of the
previously mentioned outputs. The data were analysed using Statgraphics Centurion XVII software.
2.3. Analytical methods
The total solids content and ash content of the raw biomass, the extracts and spent biomass were determined by the gravimetric method according to internal analytical
standards from the Instrumental Techniques Laboratory (LTI – UVa). The
identification, quantification, and biometry measurements of raw biomass (fixed with lugol solution at 5% and stored at 4 °C prior to analysis) were carried out by
microscopic examination (OLYMPUS IX70) according to (Sournia, 1978). The carbohydrates content in the raw biomass and extracts was determined by
HPLC-RI using a modified NREL (National Renewable Energy Laboratory – USA) procedure (Sluiter et al., 2008). First, 300 mg dry-weight basis samples were subjected to a concentrated acid hydrolysis for 1 h by adding 3 mL of H2SO4 (72% w/w) at 30º C.
Then, 84 mL of deionized water was added to dilute the acid concentration to 4% w/w prior to hydrolysis at 121º C for 1h. Then, liquid samples were obtained by filtration
and analysed. A Bio-Rad HPX-87H ion-exclusion column installed in a Waters e2695 separation module equipped with Waters 2414 refractive index detector was used to quantify the concentration of sugars on the mentioned liquid samples. A mobile phase
The organic nitrogen content of the raw biomass, extracts and some selected samples of spent biomass and acid supernatants were determined using the Total
Kjeldahl nitrogen method. The protein content of the extracts was calculated by applying an N-to-P ratio of 5.95 (González-López et al., 2010). The total amino acid
profile of the raw biomass and the selected extracts was determined, in order to evaluate the protein extracts quality, according to internal analytical standards from the
Instrumental Techniques Laboratory (LTI – UVa) based on (Moore and Stein, 1948).
Samples were hydrolysed with 6 N hydrochloric acid. Then, the acid was removed using N2 until dry, the samples were re-suspended in 0.1M HCl and the final solution
was filtered with 0.22 μm nylon membrane filters. Samples underwent pre-column derivatization with ortho-phthalaldehyde (OPA) and fluorenylmethyloxycarbonyl chloride (FMOC). The analysis was performed by HPLC using a Zorbax Eclipse AAA
4.6 x 150 mm 3.5-micron column, with mobile phases A (Buffer NaH2PO4 ꞏ H2O pH 7.8) and B (AcN:MetOH:ddi water 45:45:10), and UV detector. The lipid content of the
raw material and the extracts was determined using a modified protocol based on the Kochert method (Kochert, 1978).
All values were determined in replicate for each duplicated experiment. The results
are presented as the mean of the replicated duplicates and the corresponding standard deviation.
3. Results and discussion
3.1. Extraction and solubilisation yields.
The total extraction yields (YT) at the different operation conditions are shown in
corresponding to the hydrolysis conditions of 0.5M, 55º C and 5h. On the other hand, minimum YT (4.3 ± 0.8%) was found for Run 001, which corresponded to 0.1M, 25º C
and 2h. These results were in agreement with those values reported by (Safi et al., 2014), who found slightly higher extraction yields for pure C. vulgaris biomass (around
15%) when applying chemical alkaline treatment at pH 12 and 40º C for 2h. This higher value could be attributed to the fact that C. vulgaris cell walls is less resistant than those of S. almeriensis (Baudelet et al., 2017). Moreover, the biomass used in our work
underwent more stress due to the culture media and that had more stressful
environmental conditions, which could have caused the development of a stronger and
more resistant strain. As expected, larger extraction yields were observed when both temperature and time were increased. Regarding the alkali concentration, larger yields were observed for experiments where this variable was increased from 0.1M to 0.5M,
but little improving effect or even a decrease in the extraction yields were detected when increasing the NaOH concentration from 0.5M to 2M. Since maximum yield
values were obtained for milder conditions rather than the stronger conditions, it could be expected that the combination of these individual effects might eventually lead to some degradation of the extracted bioproducts influencing the extract quantity (yields)
and quality (composition). The individual and combined effect of the operation
parameters was evaluated by ANOVA and is shown in Section 3.3. The conditions that
yielded the maximum total extraction yield (Run 122) also provided the highest protein extraction yield (YP = 16.9 ± 1.1%). In general terms, the YP values also showed the same trend as the total yields with respect to the variation of the experimental
was found for Run 001, with a yield of just 4.9 ± 1.1%.
The lipid extraction yields (YL) steadily increased with process severity, presumably
influenced by all three variables equally. YL values oscillated between 3.7 ± 0.1% for Run 000 and 44.6 ± 0.5% for run 222, i.e. almost half of the initial lipid content was
retrieved within the final extract. These results showed a co-extraction that could be relevant for the quality of extracts (whether those extracted lipids could provide valuable properties to the extract or not), and it could also be important when
considering a sequential valorisation of the components, according to the biorefinery concept. Under alkaline conditions, lipids contained within the cells would be
transformed by saponification into water-soluble sodic salts, favouring protein solubilisation (Sari et al., 2013). In addition, the consecutive acidification of the solution not only caused protein agglomeration but also the precipitation of these sodic
salts, and thus were recovered along with the proteins in the extract. On the contrary, carbohydrate extraction yields reported very low values, and only between 0.6 and 3.6%
of the initial carbohydrate content was found in the extracts. Complex carbohydrate chains might have been hydrolysed and transformed into simple sugars, which are water-soluble (Sun and Cheng, 2002) and probably would have remained in the acid
supernatant (Figure 1).
Although the extraction yields were not found to be high, it should be noted that
those values were the global efficiency of the process, as the combination of two steps: solubilisation and precipitation. The previously defined Solubilisation yield (S (%)) would therefore help to describe the specific efficiency of the alkaline hydrolysis step
understand how much of the initial raw material was lost due to either degradation of the extracted compounds or a low efficiency of the acidification step. As a matter of
fact, S% ranged from 38.0 ± 4.1% (for Run 011) to 66.5 ± 1.4% (for Run 222), which were considerably higher values than total extraction yields (6.0 ± 0.2% and 12.3 1.2±
% respectively). Solubilisation yield values increased with stronger extraction conditions, even with higher alkali concentration, in a manner contrary to what was observed for the total extraction yields. For example, YTs for Runs 022, 122 and 222
were 10.9 ± 1.1%, 13.2 ± 0.4% and 12.3 ± 1.2%, whereas solubilisation yield values for these runs were found to be 43.9 ± 2.6%, 52.1 ± 5.1% and 66.5 ± 1.4% respectively.
Solubilisation yield values for 0.1M experiments oscillated between 38.0 ± 4.1% and 50.1 ± 1.0%, for 0.5M experiments varied from 41.2 ± 1.2% and 52.1 ± 5.1%, and from 54.3 ± 0.2% and 66.5 ± 1.4% for 2M experiments, suggesting a strong correlation of
solubilisation with alkali concentration. These will be further analysed when applying ANOVA method in section 3.3. These values were in agreement with (Gerde et al.,
2013), who found that the soluble fraction remaining in the acid supernatant accounted for 52% of the initial biomass when extracting proteins from pure Nannochloropsis sp. These values were higher than those reported by (Phong et al., 2018a), who obtained
25% of solubilization yield when extracting proteins from Chlorella sorokiniana working at 0.5M KOH, but using a very short extraction time (60s).
Since carbohydrates and proteins are especially sensitive to alkaline and high-temperature conditions (Bischof and He, 2005; Clark and Pazdernik, 2013), these compounds might have been denaturalized and transformed into other smaller
could lead a loss of some carbohydrates (reducing valuable carbohydrate content of the spent biomass used for successive steps in the biorefinery) and, on the other hand, it
could affect proteins re-folding ability and eventually reduce their recovery rate during the acidic precipitation step.
3.2. Extracts composition
Regarding the composition of extracts, ash content required a first insight since all contents are reported in dry-weight ash-free basis. The ash content of the precipitated
extracts was directly related to the NaOH concentration used for each run: the ash content oscillated between 5.4 ± 0.3% and 8.2 ± 2.0% for experiments with an alkali
concentration of 0.1M NaOH; for 0.5M NaOH experiments, the ash content went from 10.3 ± 2.0% to 16.0 ± 0.9%; and finally for 2M NaOH alkali, the ash content was between 24.1 ± 0.7% and 31.7 ± 3.7%. The higher the amount of NaOH added for the
experiments, the higher the amount of HCl was needed for acidification and so the final ash content in the extracts. These results are in agreement with the data reported by
(Gerde et al., 2013), who worked at pH 11 and whose protein extracts had around 8% ash content.
Figure 3 displayed the proximate composition (protein, lipid and carbohydrate
content) of extracts in dry-weight ash-free basis. The protein content showed some variation, with values between 53.5 ± 0.3% and 77.9 ± 3.4%, (corresponding to Runs
022 and 201 respectively), but was scarcely relatable to operation conditions or yields (Fig. 3). The application of identical conditions for the acidification step can likely be related to the similarity obtained in the extract proximate composition. Slightly higher
They also observed that, despite the differences found in the initial protein content and between protein solubilisation yields, the protein content of the different extracts were
similar at the end of the process. The proximate composition of the extract obtained for Run 122, which was found to have the highest total extraction yield as well as the
highest protein extraction yield, was 60.0 ± 1.8% (w/w dry basis ash-free) proteins, 20.6 ± 1.8% (w/w dry basis ash-free) lipids and 11.8 ± 0.6% (w/w dry basis ash-free)
carbohydrates (Fig. 3), with an ash content of 10.3 ± 3.7%.
Unlike the protein content, the carbohydrate and lipid contents showed a trend which was clearly dependent on the severity of the extraction process. The lipid content
values rose as the levels of the operation conditions increased, from 7.5 ± 0.2% to 34.9 ± 3.8% for the Runs 000 and 222 respectively, while the carbohydrate content of the extracts decreased from an average value of 13% when using 0.1M and 0.5M NaOH to
values around 4% for 2M NaOH experimental runs (Fig. 3). This should be considered especially relevant since an enrichment in lipid content and a steep diminution in
carbohydrate content for the extracts was observed, compared to the raw biomass that had a lipid content of 9.4 ± 0.3% and a carbohydrate content of 43.5 ± 4.3%.
In light of the fact that a large amount of lipids was apparently being co-extracted
along with proteins (and hence transferred to the extracts), and considering the low carbohydrate content of the extracts, an additional property was defined: a
protein-to-lipid ratio. This additional property is considered important for the evaluation of extracts quality. The two extreme experiments showed the highest (7.21 ± 0.3 for Run 000) and the lowest (1.66 ± 0.2 for Run 222) protein-to-lipid ratio, which consequently
(fatty acids) in these extracts can improve the nutritional profile as well as the
organoleptic properties of proteinaceous products. In our case, due to the source of the
biomass an exhaustive preliminary study of toxicity and pathogenesis of the extracts would be compulsory before considering their applications e.g. as an enriched feed
ingredient.
3.3. Influence of the operation parameters: ANOVA analysis
ANOVA analysis showed that the total extraction yield was individually affected by
all the three operation parameters, with the alkali concentration being especially
important since it represented 31.6% of the contribution, followed by time (24.6%) and
temperature (19.3%). To the best of our knowledge, only (Gerde et al., 2013) briefly studied the effect of temperature, alkali concentration and time on protein extraction despite the extended use of the pH-shift process with microalgae biomass. These
authors described no significant differences between using 0.5 or 1M NaOH
concentrations in protein solubilisation from a 1% suspension of defatted biomass since
the pH of these solutions was around 13, which provided the highest solubilisation yields according to the protein solubility curve. Temperature increased protein
solubilisation at 45º C and 60º C compared to 30º C, and the hydrolysis time was found
to be reduced with higher temperatures, obtaining a 12% yield after only 2 – 5h at 60º C and after only 8 – 16h at 45º C. For the individual multi-range tests, differences between
alkali concentrations were all statistically significant, with the most important being within the range of 0.1M – 0.5M. An increase in the total yield values was achieved when increasing the concentrations from 0.1M to 0.5M and from 0.1M to 2M, but a
increased with temperature and time. In both cases, the most relevant difference
between the extreme values was 25º C – 55 º C and 0.5h – 5h. By analysing interactions
between parameters, it was found that neither B – T nor B – t interactions were statistically significant even though the individual alkali concentration (B) was the
parameter primarily affecting the total extraction yield. By contrast, the other two-parameter interaction T – t was statistically significant with an influence of 10.4%. The T – t interaction graph showed no maxima but instead showed a steady increase in
average yield values and the important effect that temperature had on the total
extraction yields when hydrolysis time was increased (Fig 4a and b). That is, extraction
yields were almost independent of temperature when hydrolysing for 0.5h (6.3 ± 0.4% at 25 and 40º C and 6.9 ± 0.4% at 55º C). However, a more significant difference was found on the average total extraction yields when applying a temperature of 25º C, 40º
C or 55º C (7.3 ± 0.4%, 8.8 ± 0.4% and 12.2 ± 0.4% respectively) after a hydrolysis time of 5h. The three-parameter interaction was not found to be statistically significant.
Comparable conclusions were obtained from the ANOVA analysis of the protein extraction yield. This variable was statistically affected by the three operational parameters evaluated, especially by the NaOH concentration, whose influence
accounted for 49.1%, almost 20 percentage points higher than the NaOH effect on the total yields. The influence of time was again more important than temperature; however,
the influence of time was lower for the total yields, with values of 18.0 and 14.9%, respectively. Similar multi-range tests figures to the ones acquired for the total extraction yield were obtained for the protein extraction yields. Alkali concentration
protein extraction yields (between 15-35%) at alkaline pH (9.5, 10 and 11) after 3h of incubation at 60º C of Chlorella fusca biomass cultured in agricultural wastewaters, but
small differences were reported when working at pH 9.5, 10 or 11. On the contrary, the multi-range tests of temperature and time levels were all found to be statistically
significant, with the most important being the contrast of average protein extraction yield values between levels 0 – 2 for both parameters. In contrast with total extraction yields, no relevant interactions between the parameters were found.
The lipid extraction yield was found to be homogeneously affected by the three studied parameters B, T and t, with a contribution of 24.1% for the alkali concentration,
24.2% for temperature, and a 30.4% for time. This similar influence on the lipid extraction yield from all parameters tested was also observed in the multi-range test, which showed statistically significant differences for every parameter on all the ranges
tested, with the most relevant being the difference between levels 0 and 2: 0.1 – 2M, 25 – 55 º C and 0.5 – 5h. Regarding the interactions between parameters, p-values were all
found to be below 0.05 but T – t was the only one with a relevant contribution (7.0%), higher than that of the residues. Interactions proportionally increased in the lipid extraction yield either by increasing the alkali concentration, temperature or time.
Differences between average YL values of each level were found to be steeper when increasing the level of the other studied variables. The carbohydrate extraction yields
were not studied by ANOVA since differences were low and not significant. Solubilisation, on the contrary, strongly – and only – depended on the alkali concentration (80.2% of the share). Although the p-value of temperature was below
lower than that of the residues. The multi-range test of the alkali concentration for solubilisation average values revealed that the ranges 0 – 2 and 1 – 2, corresponding to
0.1M – 2M and 0.5M – 2M were the most relevant, in opposition to what was found for total yield and protein extraction yield. The solubilisation values were statistically
similar for range 0.1M – 0.5M and increased for range 0.1M – 2M whereas the
extraction yields increased for interval 0.1M – 0.5M but decreased for 0.5M – 2M. That is, protein recovery worsened even though solubilisation was being favoured by the
extraction conditions. The temperature multi-range test showed significant differences for intervals 40º C – 55º C and 25º C – 55º C, whereas the significant differences were
found for the hydrolysis time for intervals 0.5h – 2h and 0.5h – 5h. Analysis of the interactions determined that B – T and B – t interplays were influencing solubilisation, with a contribution of 3.1 and 4.5% respectively, which again was barely relevant
compared to the influence of the alkaline concentration alone. Interaction graphs (Figure 4c and d) display the average behaviour expected from the results previously described,
with increasing solubilisation values for increasing alkali concentrations, and overlapped lines and similar trends for temperature and time variables.
For the extract composition, the protein-to-lipid ratio was influenced by the
extraction time (35.9% of the share), followed by the temperature (25.4% of the share) and scarcely affected by the alkali concentration, with just a 7.7% of the share.
Regarding parameter interaction, only the three-parameter interaction was statistically relevant with a substantial 16.2% of the share. Any strengthening in variable levels caused a reduction in the average P-to-L ratio values, although this reduction was much
less significant for variations of the alkali concentration when the hydrolysis
hydrolysis time (0.5h). Multi-range tests of all the variables showed that the most significant differences between average P-to-L ratio values were found for range 0 – 2.
In view of these results, a compromise between the protein extraction yield, extract protein content and protein-to-lipid ratio should be achieved, to obtain a good protein
extraction yield but at the same time a proper protein-to-lipid ratio. To select the best point, the protein content of extracts and the protein-to-lipid ratio values were evaluated, and the highest values checked against the total extraction yields and the protein
extraction yields. The extract from Run 122, which provided the highest extraction yields (13.2 ± 0.4% and 17.0 ± 1.1% for the total yields and the protein extraction yields
respectively), presented a poor protein-to-lipid ratio (only 2.9 ± 0.2 gproteins/glipids). On the one hand, the maximum protein-to-lipid ratio was obtained for Run 000, with 7.76 ± 0.3 gproteins/glipids and a 58.41 ± 0.8% of protein content, but with the lowest extraction
yields (4.6 ± 0.0% of the total yield and 5.4 ± 0.1% of the protein extraction yield). On the other hand, maximum protein content (77.8 ± 3.4%) was found for the extract from
Run 201, but only 5.0 ± 0.2 of the protein-to-lipid ratio and 11.1 ± 1.8% of the protein extraction yield. The extract with the second highest protein content (74.0 ± 0.1%) was obtained from Run 210, with a YT of 7.1 ± 0.3%, YP of 11.3 ± 0.6% and a P-to-L ratio
of 5.8 ± 0.2. Since a compromise between all the parameters was needed, the
experimental conditions for this run (2M NaOH, 40º C and 0.5h) were chosen as the
best ones to obtain a high-quality protein extract from biomass by pH-shift, because it presented the second highest protein content and an appreciable protein-to-lipid ratio, with an intermediate protein extraction yield value. The lipid and carbohydrate content
improve its quality, like membrane ultrafiltration techniques.
3.4. Organic nitrogen balance and amino acid profile of selected extracts
The organic nitrogen content in the different phases (solid extract, solid spent biomass and liquid acid supernatant) was evaluated on some runs (001, 011, 101, 120,
122, 201, 211, 220, 221 and 222) in order to have a clearer perspective of the influence of the alkaline solubilisation and pH-shift recovery steps on the overall protein
extraction process. A parameter called “Process intensity” was computed by summing
up the numerical values of the levels applied for each run and used as classification criterion, i.e. Run 011 would present a process intensity of 2 (0 + 1 + 1) and Run 122
would represent a process intensity of 5 (1 + 2 + 2). Two experimental runs,
corresponding to the maximum and minimum total extraction yields, were selected for process intensity values 2, 3, 4 and 5; for values 1 and 6 only the minimum and the
maximum values were respectively selected. Organic nitrogen content (using the Kjeldahl method) is a reliable indicator of the actual protein (González-López et al.,
2010; Mæhre et al., 2018) .
As explained before, higher extraction yields were not necessarily obtained from runs where higher solubilisation yields were detected, probably because of a poor
efficiency in the acidification step. Consequently, the organic nitrogen content on each final phase has been analysed to check the organic nitrogen distribution in the different
phases depending on the intensity of the operation parameters (Figure 5). The graph showed that the organic nitrogen content in the spent biomass decreased with increasing intensity, which is in line with the solubilisation values and proved that the alkaline
expressed as gorganic nitrogen in spent/100ginitial organic nitrogen in raw biomass) in the spent biomass went from 69.6 ± 3.28% for Run 001 down to 27.0 ± 5.9% for Run 222. As observed
from the low values of the protein extraction yields, a small amount of the solubilised protein – and hence of the organic nitrogen – was recovered in the extracts (with values
ranging from 5.4 ± 0.24% for Run 001 to 20.5 ± 1.0% for Run 122). Meanwhile, the amount of organic nitrogen not recovered by the acidification step – and hence remaining in the acid supernatant – progressively increased with the intensity of the
parameters from 17.3 ± 0.8% for Run 001 to a value as high as 54.9 ± 13.5% for Run 222, suggesting that the extracted proteins might have undergone one or several
different chemical and physical changes (such as irreversible denaturation, break of covalent bonds, etc. (Bischof and He, 2005)) that made them unable to refold and/or aggregate during the acidification step, and thus remaining in the liquid phase (Gerde et
al., 2013). In terms of the total recovery, all of the initial organic nitrogen content was recovered for all the runs tested, distributed throughout those different phases,
excluding a possible loss of nitrogen due to degradation, e. g. into ammonia form. (Gerde et al., 2013) also evaluated nitrogen mass balance, but on a moisture-free basis (since the reported content on sodium chloride was low and constant) and in terms of
total nitrogen instead of organic nitrogen. They obtained a 100% nitrogen recovery, and an approximate distribution of 40%, 30% and 30% of total nitrogen in the pH 11
insoluble fraction (equivalent to the spent biomass defined for this work), the extract and the pH 11&3.2 soluble fraction (called acid supernatant in our work) when
extracting proteins from pure Nannochloropsis sp. at pH 11, 60º C and 5h. Comparing
distributed and within the range of those reported by (Gerde et al., 2013). Since it was observed that the acidic precipitation was not as selective as expected, other separation
methods should be considered for future work, like three-phase partitioning or membrane filtration ((Safi et al., 2017; Waghmare et al., 2016))
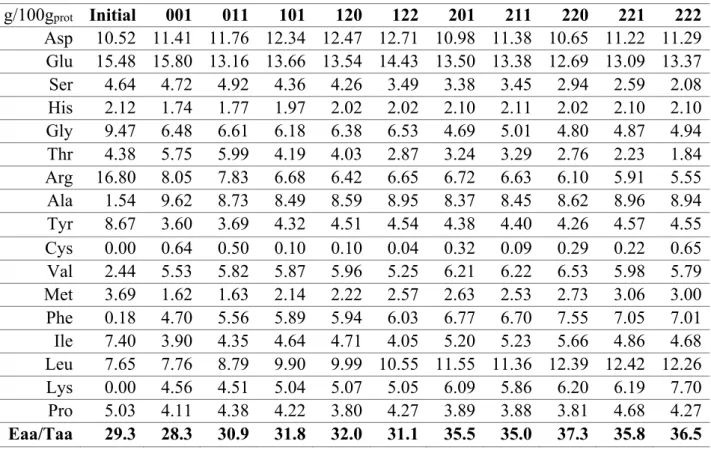
The amino acid profile of the raw biomass (Table 1) presented a suitable essential-to-total amino acid ratio (Eaa/Taa), with high values of essential amino acids such as tyrosine and isoleucine, but slightly lower values of lysine or phenylalanine, compared
to WHO/FAO recommendations (Becker, 2007). The amino acid profile of the extracts was found to be standardly constant for all of them, and hence independent of the
intensity of the process. In general, a good Eaa/Taa amino acid ratio was found for all the extracts, slightly higher than that of the raw biomass, presenting values from 28.3 to 37.3% which are within the range of the average Eaa/Taa of an egg (34.7%) (Becker,
2007). In fact, the extraction process caused an enrichment of the content of several amino acids, including those that were in scarcity in the raw biomass. The extraction
process caused the enrichment of some essential amino acids, namely Phe, Leu and Lys, and the non-essential amino acids Ala, Val and Asp. On the contrary, a substantial decay in Arg content was observed, along with Tyr, Gly and Ile content. Despite these
variations and even though some of the lower limit values defined by the WHO/FAO were not attained in the raw biomass used in this work (e.g. for Phe or Lys), the amount
of these amino acids (Tyr, Val, Met, Phe, Ile, Leu and Lys) was above these lower limits in almost all of the analysed extracts (Becker, 2007). (Safi et al., 2013) analysed the amino acid profile of several species, including Chlorella sp., as well as that of the
compared to raw pure Chlorella sp. However, the extracts obtained from the microalgae biomass grown in piggery wastewater in this work had a higher ratio and a better amino
acid distribution, with higher contents of essential amino acids such as Met, Phe or Leu, and lesser amounts of Ala or Glu, than those obtained from the Chlorella sp. biomass.
(Teuling et al., 2017) compared protein extracts from different pure microalgae species, including Scenedesmus dimorphus. The amino acid profile of S. dimorphus raw biomass partially differed in some of the amino acid content (such as Arg, Phe, Leu and Lys) and
presented an Eaa/Taa 10 percentage points higher than the raw biomass used in this work. However, the amino acid profile of the extract obtained from S. dimorphus
biomass (with an Eaa/Taa ratio of 34.2%) did not differ very much from the average obtained in this work and despite the different initial distribution.
4. Conclusions
ANOVA showed that all variables (alkali concentration, temperature and time) influenced the total (31.6%, 19.3% and 24.6% of influence), protein (49.1%, 14.9% and
18.0%) and lipid (24.1%, 24.2% and 30.4%) yields. Protein-to-lipid ratio decreased due to time and temperature (35.9% and 25.4%) while protein solubilisation solely increased because of the alkali concentration (80.2%). Acidic precipitation provided low
efficiency and selectivity, thus a different separation method should be considered. The most suitable conditions, pondering yields and selectivity, were 2M - 40º C - 0.5h,
which resulted in 11.3% of protein yield, providing an extract comprised of 73.9% proteins and 12.7% lipids.
5. Acknowledgements
Innovación y Universidades” (CTQ2017-84006-C3-1-R) and the EU-FEDER (CLU 2017-09 and CTQ2017-84006-C3-1-R) for the financial support of this work. Ana
Lorenzo would like to thank the University of Valladolid for her doctorate scholarship. 6. References
Acién, F.G., Gómez-Serrano, C., Morales-Amaral, M.M., Fernández-Sevilla, J.M., Molina-Grima, E., 2016. Wastewater treatment using microalgae: how realistic a contribution might it be to significant urban wastewater treatment? Appl.
Microbiol. Biotechnol. 100, 9013–9022. doi:10.1007/s00253-016-7835-7
Ansari, F.A., Gupta, S.K., Nasr, M., Rawat, I., Bux, F., 2018. Evaluation of various cell
drying and disruption techniques for sustainable metabolite extractions from microalgae grown in wastewater: A multivariate approach. J. Clean. Prod. 182, 634–643. doi:10.1016/j.jclepro.2018.02.098
Baudelet, P.H., Ricochon, G., Linder, M., Muniglia, L., 2017. A new insight into cell walls of Chlorophyta. Algal Res. 25, 333–371. doi:10.1016/j.algal.2017.04.008
Becker, E.W., 2007. Micro-algae as a source of protein. Biotechnol. Adv. 25, 207–10. doi:10.1016/j.biotechadv.2006.11.002
Benelhadj, S., Gharsallaoui, A., Degraeve, P., Attia, H., Ghorbel, D., 2016. Effect of pH
on the functional properties of Arthrospira (Spirulina) platensis protein isolate. Food Chem. 194, 1056–1063. doi:10.1016/j.foodchem.2015.08.133
Bischof, J.C., He, X., 2005. Thermal stability of proteins. Ann. N. Y. Acad. Sci. 1066, 12–33. doi:10.1196/annals.1363.003
Bleakley, S., Hayes, M., 2017. Algal Proteins: Extraction, Application, and Challenges
Concerning Production. Foods 6, 33. doi:10.3390/foods6050033
oculata microalgal biomass to obtain a protein-enriched food or feed ingredient.
Algal Res. 11, 95–102. doi:10.1016/j.algal.2015.05.022
Chew, K.W., Yap, J.Y., Show, P.L., Suan, N.H., Juan, J.C., Ling, T.C., Lee, D.J., Chang, J.S., 2017. Microalgae biorefinery: High value products perspectives.
Bioresour. Technol. 229, 53–62. doi:10.1016/j.biortech.2017.01.006 Clark, D.P., Pazdernik, N.J., 2013. Molecular biology. Elsevier.
Dunker, S., Wilhelm, C., 2018. Cell wall structure of coccoid green algae as an
important trade-offbetween biotic interference mechanisms and multidimensional cell growth. Front. Microbiol. 9. doi:10.3389/fmicb.2018.00719
Gerde, J.A., Wang, T., Yao, L., Jung, S., Johnson, L.A., Lamsal, B., 2013. Optimizing protein isolation from defatted and non-defatted Nannochloropsis microalgae biomass. Algal Res. 2, 145–153. doi:10.1016/j.algal.2013.02.001
González-López, C. V., Cerón-García, M.C., Acién, F.G., Bustos, C.S., Chisti, Y., Fernandez-Sevilla, J.M., López, C.V.G., del Carmen Cerón García, M., Fernández,
F.G.A., Bustos, C.S., Chisti, Y., Sevilla, J.M.F., 2010. Protein measurements of microalgal and cyanobacterial biomass. Bioresour. Technol. 101, 7587–7591. doi:10.1016/j.biortech.2010.04.077
Gupta, S.K., Ansari, F.A., Shriwastav, A., Sahoo, N.K., Rawat, I., Bux, F., 2016. Dual role of Chlorella sorokiniana and Scenedesmus obliquus for comprehensive
wastewater treatment and biomass production for bio-fuels. J. Clean. Prod. 115, 255–264. doi:10.1016/j.jclepro.2015.12.040
Kochert, G., 1978. Quantitation of the macromolecular components of microalgae.
Handb. Phycol. methods. Physiol. Biochem. methods 189–195.
Determination—Method Matters. Foods 7, 5. doi:10.3390/foods7010005 Molinuevo-Salces, B., Mahdy, A., Ballesteros, M., González-Fernández, C., 2015.
From piggery wastewater nutrients to biogas: Microalgae biomass revalorization through anaerobic digestion. Renew. Energy 1–8.
doi:10.1016/j.renene.2016.01.090
Moore, S., Stein, W.H., 1948. Partition chromatography of amino acids on starch. Ann. N. Y. Acad. Sci. 49, 265–278.
Phong, W.N., Show, P.L., Le, C.F., Tao, Y., Chang, J.S., Ling, T.C., 2018a. Improving cell disruption efficiency to facilitate protein release from microalgae using
chemical and mechanical integrated method. Biochem. Eng. J. 135, 83–90. doi:10.1016/j.bej.2018.04.002
Phong, W.N., Show, P.L., Ling, T.C., Juan, J.C., Ng, E.P., Chang, J.S., 2018b. Mild cell
disruption methods for bio-functional proteins recovery from microalgae—Recent developments and future perspectives. Algal Res. 31, 506–516.
doi:10.1016/j.algal.2017.04.005
Safi, C., Cabas Rodriguez, L., Mulder, W.J., Engelen-Smit, N., Spekking, W., van den Broek, L.A.M., Olivieri, G., Sijtsma, L., 2017. Energy consumption and
water-soluble protein release by cell wall disruption of Nannochloropsis gaditana. Bioresour. Technol. 239, 204–210. doi:10.1016/j.biortech.2017.05.012
Safi, C., Charton, M., Pignolet, O., Silvestre, F., Vaca-Garcia, C., Pontalier, P.Y., 2013. Influence of microalgae cell wall characteristics on protein extractability and determination of nitrogen-to-protein conversion factors. J. Appl. Phycol. 25, 523–
529. doi:10.1007/s10811-012-9886-1
C., 2014. Aqueous extraction of proteins from microalgae: Effect of different cell disruption methods. Algal Res. 3, 61–65. doi:10.1016/j.algal.2013.12.004
Sari, Y.W., Bruins, M.E., Sanders, J.P.M., 2013. Enzyme assisted protein extraction from rapeseed, soybean, and microalgae meals. Ind. Crops Prod. 43, 78–83.
doi:10.1016/j.indcrop.2012.07.014
Scholz, M.J., Weiss, T.L., Jinkerson, R.E., Jing, J., Roth, R., Goodenough, U., Posewitz, M.C., Gerken, H.G., 2014. Ultrastructure and composition of the
Nannochloropsis gaditana cell wall. Eukaryot. Cell 13, 1450–1464.
doi:10.1128/EC.00183-14
Schwass, D.E., Finley, J.W., 1984. Heat and alkaline damage to proteins: Racemization and lysinoalanine formation. J. Agric. Food Chem. 32, 1377–1382.
doi:10.1021/jf00126a040
Sluiter, A., Hames, B., Ruiz, R., Scarlata, C., Sluiter, J., Templeton, D., 2008. Determination of ash in biomass: Laboratory Analytical Procedure (LAP),
NREL/TP-510-42622.
Sournia, A., 1978. Phytoplankton: manual. UNESCO, United Kingdom.
Suganya, T., Varman, M., Masjuki, H.H., Renganathan, S., 2016. Macroalgae and
microalgae as a potential source for commercial applications along with biofuels production: A biorefinery approach. Renew. Sustain. Energy Rev. 55, 909–941.
doi:10.1016/j.rser.2015.11.026
Sun, Y., Cheng, J., 2002. Hydrolysis of lignocellulosic materials for ethanol production : a review q. Bioresour. Technol. 83, 1–11.
doi:10.1016/S0960-8524(01)00212-7
Extracts from Various Unicellular Green Sources. J. Agric. Food Chem. 65, 7989– 8002. doi:10.1021/acs.jafc.7b01788
Ursu, A.V., Marcati, A., Sayd, T., Sante-Lhoutellier, V., Djelveh, G., Michaud, P., 2014. Extraction, fractionation and functional properties of proteins from the
microalgae Chlorella vulgaris. Bioresour. Technol. 157, 134–139. doi:10.1016/j.biortech.2014.01.071
Vanthoor-Koopmans, M., Wijffels, R.H., Barbosa, M.J., Eppink, M.H.M., 2013.
Biorefinery of microalgae for food and fuel. Bioresour. Technol. 135, 142–149. doi:10.1016/j.biortech.2012.10.135
Voigt, J., Stolarczyk, A., Zych, M., Malec, P., Burczyk, J., 2014. The cell-wall
glycoproteins of the green alga Scenedesmus obliquus. The predominant cell-wall polypeptide of Scenedesmus obliquus is related to the cell-wall glycoprotein gp3 of
Chlamydomonas reinhardtii. Plant Sci. 215–216, 39–47. doi:10.1016/j.plantsci.2013.10.011
Figure Captions
Figure 1. Scheme of the process followed for the extraction of the protein fraction of
biomass from pig manure treatment photo-bioreactors. The three process parameters defined and abbreviated in this figure are alkali (NaOH) concentration – B (mol L-1) –, temperature – T (º C) –, and time – t (h) –.
Figure 2. Total (gextract/100graw biomass) and protein (gproteins/100gproteins in raw biomass) extraction yields. Values shown are the mean of duplicate values, and the standard
deviation is shown as lines. Experimental runs codification stands for the three levels (0, 1 and 2) of the three evaluated parameters, i.e. alkali concentration (0.1,
0.5 and 2M NaOH), temperature (25, 40 and 55 ºC), and hydrolysis time (0.5, 2 and 5h).
Figure 3. Proximate composition of extracts (gmacromol. component/100gextract dry-weight
ash-free). Values shown are the mean of duplicate values, and the standard deviation is shown as lines. Experimental runs codification stands for the three levels (0, 1 and
2) of the three evaluated parameters, i.e. alkali concentration (0.1, 0.5 and 2M NaOH), temperature (25, 40 and 55 ºC), and hydrolysis time (0.5, 2 and 5h). Figure 4. Interaction graphs obtained from ANOVA. (a) Total extraction yield (%):
NaOH concentration vs. Temperature; (b) Total extraction yield (%): Temperature vs. time; (c) Solubilisation (%): NaOH concentration vs. Temperature; (d)
Solubilisation (%): NaOH vs. time.
Figure 5. Organic nitrogen balance (gOrgN in each phase/100g initial OrgN) in each phase obtained after alkaline hydrolysis and acidic precipitation of the biomass.
Table 1