Procedia Engineering 178 ( 2017 ) 13 – 23
1877-7058 © 2017 Published by Elsevier Ltd. This is an open access article under the CC BY-NC-ND license (http://creativecommons.org/licenses/by-nc-nd/4.0/).
Peer-review under responsibility of the scientific committee of the International Conference on Reliability and Statistics in Transportation and Communication doi: 10.1016/j.proeng.2017.01.054
ScienceDirect
16
thConference on Reliability and Statistics in Transportation and Communication,
RelStat’2016, 19-22 October, 2016, Riga, Latvia
Methodology to Assess the Effects of ICT-measures on Emissions.
The Case Study of Madrid
Andrés Monzon
a*
, Álvaro Garcia-Castro
b, Cristina Valdes
ca
Department of Civil Engineering: Transport and Territory, Universidad Politécnica de Madrid, Madrid, Spain
b
Transport Research Centre, Universidad Politécnica de Madrid, Madrid, Spain
c
Empresa Municipal de Transporte, Madrid, Spain
Abstract
The road transportation sector is one of the largest emitters of Greenhouse Gases, which triggered the climate change. Much effort is dedicated to reduce the emissions, highlighting the use of Information and Communication Technologies. In this framework, the ICT-Emissions project has developed the methodology necessary to estimate the effects of ICT-measures on emissions. Based on this methodology, this paper presents the results of the measures tested in the case study of Madrid: Section Speed Control, Variable Speed Limits, Cruise Control, Eco-Driving and Green Navigation. Some of the measures have been analysed with real Floating Car Data, comparing the fuel consumption before and after implementing the ICT-measures. On the other hand, Green Navigation results are based only in simulation. Although the level of analysis is different for each of the tested measures, the results show positive values in terms of CO2 emission reductions and prove the applicability of the
ICT-Emissions methodology.
© 2017 The Authors. Published by Elsevier Ltd.
Peer-review under responsibility of the scientific committee of the 16th International Conference on Reliability and Statistics in Transportation and Communication.
Keywords: GHG emissions, ICT-measures, Floating Car Data, traffic simulation, emission simulation
* Corresponding author.
E-mail address: [email protected]
© 2017 Published by Elsevier Ltd. This is an open access article under the CC BY-NC-ND license (http://creativecommons.org/licenses/by-nc-nd/4.0/).
1.Introduction
Greenhouse gases (GHG) emissions and overconsumption of energy resources represent a global problem, which concerns both their causes and consequences (Ramanathan and Feng, 2009). Changes in the atmospheric presence of greenhouse gases and aerosols alter the energy balance of the climate system. “Warming of the climate system is unequivocal, as is now evident from observations of increases in global average air and ocean temperatures, widespread melting of snow and ice, and rising global average sea level” (IPCC, 2007).
The transportation sector is one of the largest emitters despite the advances in the field of engine technology. According to statistics provided by the European Environment Agency (2013), GHG emissions from the road transportation sector have started to decline, but still account for about 93% of the emissions attributable to the transportation sector, and approximately 20.4% of total emissions. The transport sector accounted for 26% of global energy consumption in 2010, and transportation energy use is expected to increase by 1.1% every year from 2010 to 2040 according to the International Energy Outlook 2013 Reference case (Energy Info Administration, 2013).
In this context, much of the effort dedicated to reducing energy consumption and emissions has focused on the road transportation sector. The European Commission (2009) proposes an integrated policy to tackle the problem from different approaches; these include particularly demand management, a shift to cleaner modes, improving vehicle technologies, traffic management, and the use of information and communication technologies (ICT). ICT applied to transportation (Intelligent Transportation Systems, or ITS) is a broad field that has the potential for producing positive effects on efficiency, safety, comfort and the environment (European Commission, 2008).
2.The ICT-Emissions project methodology
The aim of the ICT-Emissions project (European 7th R&D Framework Programme) is to find a methodology to simulate in detail the effects on CO2 emissions of a number of ICT measures applied to transportation, commonly known as Intelligent Transportation Systems (ITS). Each of the considered ICT measures affects CO2 emissions
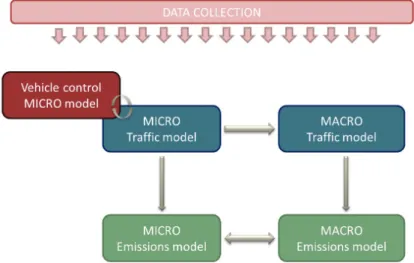
differently. From a macroscopic point of view it can be considered that demand, fleet composition and average speed determine the level of emissions (Ntziachristos and Samaras, 2000). However, taking a detailed look at each vehicle, the processes of acceleration and deceleration and the engine performance are also proved to be critical. Moreover, the areas of application are highly variable and the effects in certain environments may produce undesirable results, causing the need of using models to simulate these effects before investing the large amounts of capitals that in some cases require these measures. Fig. 1 shows the structure of the ICT-Emissions methodology.
All this complexity, which determines the measures effectiveness, also causes that the simulation is not a straightforward process. The methodology proposed in the “ICT-Emissions” project is mainly based on the interaction of various simulation models on micro and macro levels. Therefore, the idea is not to create a new simulation software tool, but to join the already existing by developing the necessary links and interfaces. These models include a vehicle control model, traffic model and emissions model (micro and macro levels). The project focuses on the field of passenger cars, also analysing the effects of the ICT measures under different fleet compositions. The main focus will be on the following groups of ICT measures:
1. Driver behaviour change and eco driving. 2. Navigation and travel information. 3. Traffic management and control. 4. Demand & access management.
5. Advanced driver assistance system (ADAS).
3.The case study of Madrid
3.1. Madrid metropolitan area
The city of Madrid is the capital of Spain and of the region with the same name, officially “Comunidad Autónoma de Madrid”. The region is located in the centre of the Iberian Peninsula, covers an area of 8,021 km2 with a population of 6,377,364 inhabitants on January 1st 2015, while the city of Madrid has 3,165,236 inhabitants (Instituto Nacional de Estadística, 2015).
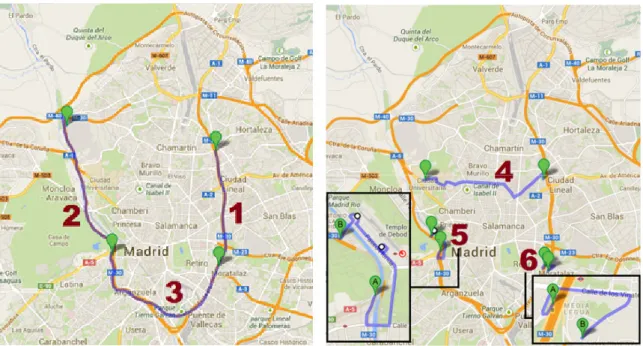
The road network has a radio centric structure with eight main motorways providing access to the city centre. Other four ring motorways encircle the city of Madrid, connecting the peripheral districts and suburbs. The following figure shows the main motorways and local roads of Madrid metropolitan area.
3.2. Data collection campaign
In March and April 2013, the main data collection campaign took place in coordination with the Department of Traffic Technologies of Madrid. This data collection campaign consisted of conducting a representative number of trips through the selected itineraries using floating cars (FCD). With this procedure, it is possible to obtain the fuel consumption and speed profiles. The number of drivers involved was 9. Due to contract limitations, drivers were alumni of Universidad Politécnica de Madrid (UPM) 25 to 30 years old.
Three FIAT passenger cars were involved in this study, a Punto 1.2L gasoline and two diesel variants, Punto and Bravo, with 1.3L and 1.6L engines, respectively. The characteristics of the vehicle were determined inside the ICT-Emissions project, taking into account the compatibility of the selected models with the application to record vehicle parameters developed by FIAT.
According to a report of the Madrid Local Government (Dirección General de Sostenibilidad y Planificación de la Movilidad, 2013), 68% of passenger cars are diesel and 31% gasoline. In this sense, the sample is representative of the Madrid fleet composition.
Regarding the vehicle segmentation, these vehicles can be classified in segments small (Fiat Punto) and medium (Fiat Bravo), which corresponds approximately to 75% of the fleet in Madrid. The three vehicles are registered under Euro 5 standards, while the average fleet age in Madrid is 9.3 years (Dirección General de Sostenibilidad y Planificación de la Movilidad, 2013).
The total number of recorded trips was initially 2,250, with results approximately 12,600 km driven. At a first filtering process, 159 trips were eliminated because of recording application failures. The data collection campaign was focused on the M30 motorway and therefore, some of the trips include both motorway and adjacent urban sections. To isolate the different sections, trips were split into urban and motorway trips, summing up a total of 3,072 trips.
installed on the roadway. This method provides information about individual travel and driving behaviour, simultaneously complementing the information from other fixed on-road sensors.
For many applications, the speed and GPS information recorded by smartphones may be enough. However, the vehicles participating in this campaign also provided information extracted from the on-board diagnostics (OBD) system.
The methodology included the installation of an OBD key to extract data from each vehicle’s OBD system. This was used to record instantaneous position, speed, acceleration, fuel consumption (l/h down to a precision level of five significant digits) and revolutions per minute (rpm). This device is easily installed by the user in the vehicle diagnostic port, and sends the data to a mobile phone via Bluetooth with a frequency of 1 Hz (Fig. 2).
Fig. 2. Data collection process.
In collaboration with the Department of Traffic Technologies in Madrid, the consortium decided to select four different measures for testing in the Madrid case study. Two measures affect only individual vehicles: eco-driving affects driving behaviour, while cruise control is related to vehicle technology. The other two measures involve traffic control and management and depend on the available ITS installations in the road network. We selected Section Speed Control and Variable Speed Limits on account of their availability for experimentation. Therefore, the data collection campaign was focused on the M30 Motorway sections equipped with these systems and some urban roads. Figure 3 and Table 1 show where the different measures have been tested.
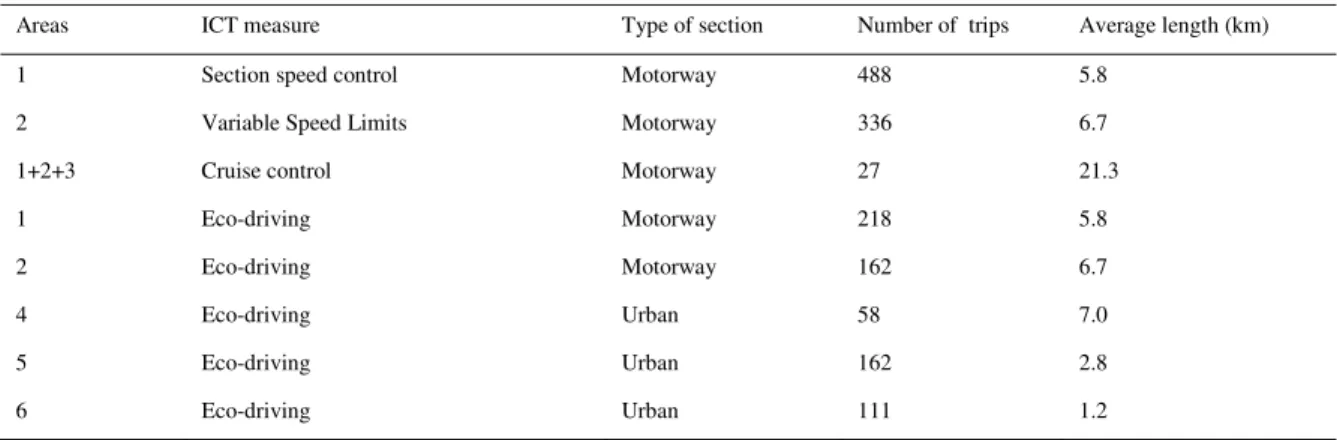
Table 1. Areas of implementation according to Figure 3, number of valid trips and average length by tested ICT measure.
Areas ICT measure Type of section Number of trips Average length (km)
1 Section speed control Motorway 488 5.8
2 Variable Speed Limits Motorway 336 6.7
1+2+3 Cruise control Motorway 27 21.3
1 Eco-driving Motorway 218 5.8
2 Eco-driving Motorway 162 6.7
4 Eco-driving Urban 58 7.0
5 Eco-driving Urban 162 2.8
6 Eco-driving Urban 111 1.2
4.Measures tested in Madrid. Results of CO2 emissions
Different measures and under different circumstances have been tested in the case study of Madrid. The following table summarises the level of analysis of each measure tested in Madrid.
Table 2.Analysis level of the measured tested in Madrid.
Measure Real FCD
collection
Micro traffic simulation
Micro emissions simulation
Macro traffic simulation
Macro emissions simulation
Section Speed Control
Variable Speed Limits
Cruise Control
Eco-driving
Green Navigation
4.1. Section Speed Control
The section speed control (point to point speed control or average speed control) is a measure designed primarily to improve road safety. The license plates of each vehicle entering on a section (usually a section without intersections) are read and stored at the beginning and the end of the section. By measuring the time elapsed, average speed is calculated for each vehicle, proceeding to punish those that exceed the legal speed limit.
In the case study of Madrid, the system was implemented for testing in the East section of the Ring Motorway M30, northbound. The East section corresponds to two separate carriageways per traffic direction: 3 lanes in the central road and 3 or 4 lateral service lanes. The section is limited to 90 km/h and equipped with section speed control system. In the morning peak hour the intensity reaches 11,500 veh/h northbound, producing severe congestion. The speed limit is 90 km/h and the total length is 5.8 km. A total of 489 trips were recorded in this itinerary, 262 of which corresponded to the base case and 226 to the section speed control activated scenario.
Results of FCD
The results of FCD show savings of fuel consumption and therefore CO2 emissions of 3.8% when the measure is
4.2. Variable Speed Limits
Variable Speed Limits (VSL) can be defined simply as speed limit management systems which are time dependant and utilize traffic detectors to determine the appropriate speed. More details about VSL and their effects are summarized on Garcia-Castro and Monzon (2014).The tested section is a 3 lanes motorway (southbound) with traffic intensity in the afternoon peak hours rounding 6,000 veh/h and with a length of 6.6 km. Most of the section is limited to 90 km/h, except the last 100 m., limited to 70 km/h. (tunnel entrance). The congestion is usually caused by the bottleneck situated in the M500 junction, as in peak hour around 2,800 vehicles merge in the M30 with around the 3,300 vehicles already circulating in this road.
Results of FCD
The results of FCD show savings of fuel consumption and therefore CO2 emissions of 1.9% when the measure is
activated.
Results of simulation at micro-level
The traffic simulations have been performed with the software PTV Vissim. Once calibrated the base scenario and set the variable speed limit system in the tool, the results of the traffic simulations have been used as input for the emission model AVL Cruise. Estimated CO2 savings with respect to the base case scenario are presented in the
following table, considering two possible traffic situations: medium and congestion.
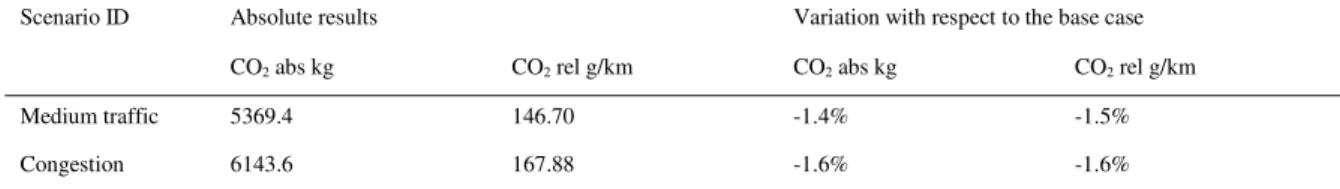
Table 3. Results of CO2 emissions of Variable Speed Limits simulations at micro level.
Scenario ID Absolute results Variation with respect to the base case
CO2 abs kg CO2 rel g/km CO2 abs kg CO2 rel g/km
Medium traffic 5369.4 146.70 -1.4% -1.5%
Congestion 6143.6 167.88 -1.6% -1.6%
The results show both absolute and relative CO2 emissions savings around 1.5%, which are in line with the
floating cars measurements.
Upscaling to macro modelling. Results at macro level
Once the micro scenarios have been developed and simulated, the results obtained are used to calculate the new fundamental diagram or speed intensity function to be used in the macro traffic models. In the case of VSL, the new function produces a capacity increase of 16% in the affected road, as shown in Figure 4.
In the new calibrated function, parameter c varies from 0.85 to 0.99:
ݐ௨ൌݐൈቀͳ ܽൈೌೣൈࢉቁ. (1)
At a macro level, results in global terms are, though positive, almost insignificant, as expected due to the little area where the measure was implemented compared to the whole region.
Table 4. Results of CO2 emissions of Variable Speed Limits simulations at macro level. Madrid Region.
Scenario ID Absolute results Variation with respect to the base case
CO2 abs kg CO2 rel g/km CO2 abs kg CO2 rel g/km
Medium traffic 793,898 180 -0.10% -0.04%
Congestion 1,080,066 183 -0.06% -0.09%
But when disaggregating these results into road types, we can observe in Figure 5 that this capacity increase produced in the road with Variable Speed Limits activated does not benefit directly this road but allows traffic using other routes to re-route through this road and therefore produce a benefit in CO2 emissions globally.
These results highlight the need of using a double scale approach to comprehend as much as possible the impacts a measure can produce.
Fig. 5. Madrid case study. Fuel consumption volume variation by road type.
4.3. Cruise Control
Cruise Control is a driver-activated control system that maintains a constant vehicle speed, avoiding unnecessary speed changes which cause additional fuel consumption. This measure is applicable only on high-capacity (uninterrupted) roads when the traffic intensity is relatively low.
The section under study corresponds to a multilane ring motorway, with 3 or 4 lanes and a normal speed limit of 90 km/h and with a tunnel section with a strictly enforced limit of 70 km/h. The length of the section analysed is 21.3 km. Almost 277 km were driven with the system deactivated, and 298 km when the system was activated by the driver.
Results of FCD
The results of FCD analysis show savings of fuel consumption and therefore CO2 emissions of 4.7% when the
Cruise Control is activated.
4.4. Eco-driving
Results of FCD
AS shown on Table 4, eco-driving has been tested in different itineraries in Madrid, including sections of the urban motorway M-30 and some other urban streets. Differentiating between urban motorway and urban streets, the use of eco-driving techniques saves 8.6% and 7.1% respectively.
Results of simulation at micro-level
In terms of simulation, this implies a complex process of re-calibrating current models in order to reproduce eco driving real behaviour.
The eco-driving behaviour varies the attitude in setting speed and distance to the preceding vehicles. Speed and distance are parameters that influence the speed and density of traffic.
In the case of Madrid, eco-driving has been simulated using the same road section as for Variable Speed Limits, a 3 lane urban motorway with a speed limit of 90 km/h and different traffic levels.
The calibration of the eco-driving behaviour has been performed using the speed profiles obtained from the FCD. Acceleration and deceleration functions and distance between vehicles have been adapted to reproduce the eco-driving behaviour. More information about the calibration can be found on ICT-Consortium (2015).
A total of 18 scenarios have been considered for micro simulations. More information about this modelling work could be found in García-Castro et al. (2016). The variables producing this range of scenarios are:
• Traffic level: congested, medium and free flow
• Penetration rate: 5–20–25–50–75 and 100%
The results are presented in the following figure.
Fig. 6. Eco-driving results depending on the traffic situation and eco-drivers penetration levels.
Eco-drivers tend to accelerate and brake smoothly, letting at the same time larger safety distances. These facts reduce the traffic density and, therefore, the capacity, producing longer queues and increasing travel times. Especially at the congested scenarios, the progressive input of eco-drivers produces an increment on stop times.
Relative positive effects can only be found with low levels of traffic and with eco-driving penetration rates smaller than 25%.
4.5. Green Navigation
Modelling process description
For modelling green-navigation a new transport mode had to be defined in Visum. This new transport mode, green-navigation drivers, has assigned a new impedance function defined in terms of fuel consumption (directly related to CO2 emissions) instead of the typical impedance function for conventional drivers which is based on time
and monetary costs.
A percentage of the light vehicles OD matrices will be assigned depending on the green navigation penetration rate i.e. if a penetration rate 25% of green drivers is considered, the 75% of the OD matrix will be assigned for conventional drivers under the typical impedance function and the rest 25% to green drivers under a impedance function based on fuel consumption.
Scenarios
A total of 30 scenarios have been considered for emissions calculations, while 15 for traffic results. Variables producing this wide range of scenarios are:
• Traffic level: free flow, medium flow or congested flow • Penetration levels of green drivers: 10–25–50–75 and 90%
Fig. 7. Green Navigation modelling process.
Macro simulation results
Table 5. Results of the different scenarios of Green Navigation.
Scenario description CO2 abs kg CO2 rel g/km average speed km/h
Congested_10% -2.22% 1.48% -9.66%
Congested_25% -4.89% 3.09% -19.04%
Congested_50% -7.07% 4.78% -26.83%
Congested_75% -7.92% 5.78% -30.69%
Congested_90% -8.16% 6.19% -32.81%
Medium_10% -1.13% 0.49% -6.87%
Medium_25% -2.24% 1.58% -14.12%
Medium_50% -3.18% 2.94% -21.97%
Medium_75% -4.08% 3.79% -27.41%
Medium_90% -4.66% 4.23% -30.53%
Free_10% -5.91% -0.07% -2.31%
Free_25% -6.83% -0.08% -6.94%
Free_50% -7.85% 0.00% -13.97%
Free_75% -8.93% 0.01% -19.50%
In global terms, we can see that results for traffic and CO2 emissions vary substantially, having a positive impact
for low and high traffic situations but not for medium flow. These benefits increase more with lower penetration levels, while with penetration levels over 75% it seems to reach an asymptote. This means drivers following “the greener route” are selecting shorter routes, though this may imply crossing the city centre or selecting a road with lower speed than a highway.
But this has a negative aspect, which is the time increase. As length has an important effect in CO2 emissions,
green drivers choose routes similar to the minimum length, even having higher travel times.
5.Conclusions
After analysing all these previous scenarios, we can conclude that impacts vary not only with the measure itself but of course with the penetration level, and the traffic situation. Therefore, it is not a straightforward process to quantify the expected impacts an ICT measure may have and it needs a clear methodology.
The ICT-Emissions methodology has been tested with real data in the case study of Madrid. The most remarkable case is Variable Speed Limits, as it covers all the different levels of the methodology. It starts with collection of real data based on Floating Car Data, which allows calculating the CO2 variation when the system is activated compared to base case
scenario. However, the savings are calculated based on a limited number of vehicles. In order to analyse what happens to all the vehicles affected by this measure, it is necessary to simulate the traffic at micro level. The output of this model is the input used to estimate the emissions. Going one step further, it is possible to upscale the results to calculate the effects at the whole region. With this case study, the upscaling methodology is proven and it reflects the changes in traffic and emissions.
Other measures such as Section Speed Control and Cruise Control have been only tested using the floating car data in the case of Madrid. However this real data show the potential of these measures to reduce fuel consumption and CO2 emissions. Related further research should be focused on simulating these measures to analyse the effects
in the whole fleet.
Eco-driving is a clear example of negative effects when aggregating individual savings. In this case, high presence of eco-drivers could lead to higher congestion and therefore increase the emissions.
Last measure included in the case study of Madrid is Green Navigation. In this particular case it is not necessary to run the complete methodology, as a macro traffic model can simulate properly how drivers choose different routes according to different preferences. From this exercise we can conclude that measures can be beneficial in terms of CO2 emission reductions, although producing delays that are probably not accepted by drivers.
In most of the measures, CO2 emissions decrease is below 3%, which means none of these measures represents a
turning point in solving the problem of increasing CO2 emissions, but combination of them, implemented correctly,
may help to tackle it. There is a commitment to reduce EU CO2 emissions by at least 40% below the 1990 level by
2030, and therefore strong efforts have to be done to find the ways of reducing them without strangling mobility and economic growth. This research proves ICT measures do have a potential for reaching this objective. Therefore, a strong effort in investigating these measures needs to be made, as they have a potential to reduce CO2 but there are
many variables interfering which need to deepen in their knowledge in order to provide assessment to implement them in practice.
References
Dirección General de Sostenibilidad y Planificación de la Movilidad. (2013) Estudio del parque circulante de la ciudad de Madrid. Año 2013. Madrid. Spain: Dirección General de Sostenibilidad y Planificación de la Movilidad.
Energy Information Administration. (2013) International Energy Outlook. (No. DOE/EIA-0484(2013)). Washington D.C: U.S. Department of Energy.
European Commission. (2008) Action plan for the deployment of intelligent transport systems in Europe. (No. Tech. Report. COM (2008) 886). Brussels, Belgium: European Commission.
European Environment Agency. (2013) Annual European Union greenhouse gas inventory 1990-2011 and inventory report 2013. Copenhagen, Denmark: Publications Office of the European Union.
Garcia-Castro, A. and Monzon, A. (2014) Using Floating Car Data to Analyse the Effects of ITS Measures and Eco-Driving. Sensors, 14(11), 21358–21374.
Garcia-Castro, A., Monzon, A.,Valdes, C. and Romana, M. (2016) Modelling different penetration rates of eco-driving in urban areas. Impacts on traffic flow and emissions. International Journal of Sustainable Transportation,in press.
ICT-Emissions Consortium (2015) Results of application of ICT measures in ICT-EMISSIONS partner cities. (Deliverable No. 6.4). Brussels, Belgium.
Instituto Nacional de Estadistica. (2015) Population figures and demographic censuses. Retrieved from http://www.ine.es/en/inebmenu/mnu_cifraspob_en.htm
Intergovernmental Panel on Climate Change (2007): The physical science basis. Agenda, 6(07), 333.
Ntziachristos, L. and Samaras, Z. (2000) Speed-dependent representative emission factors for catalyst passenger cars and influencing parameters. Atmospheric Environment, 34(27), 4611–4619.