Collingwood Environmental Planning Limited
Survey on Public Perceptions of
Environmental Risks
EUROPEAN COMMISSION Directorate-General for Environment Directorate F — Strategy
Unit F.3 — Knowledge, Risks and Urban Environment Contact: Ivana Juraga and Elena Montani
E-mail: [email protected] [email protected]
Survey on Public Perceptions
of Environmental Risks
LEGAL NOTICE
This document has been prepared for the European Commission however it reflects the views only of the authors, and the Commission cannot be held responsible for any use which may be made of the information contained therein.
More information on the European Union is available on the Internet (http://www.europa.eu).
Luxembourg: Publications Office of the European Union, 2015
ISBN 978-92-79-54020-2 doi:10.2779/419439
© European Union, 2015
Europe Direct is a service to help you find answers to your questions about the European Union.
Freephone number (*):
00 800 6 7 8 9 10 11
Project title: Survey on Public Perception of Environmental Risks
Project code: ENV.F.3/ETU/2014/0037
Contracting
organisation: DG Environment, European Commission
Lead contractor: Collingwood Environmental Planning Limited
Address: 1E The Chandlery, 50 Westminster Bridge
Road, London, SE1 7QY, UK
Contact: Paula Orr (Project Director)
Tel. +44 (0)20 7407 8700
Fax. +44 (0)020 7928 6950
Website: www.cep.co.uk
Partner organisations: CIRPA - Inter-University Centre for Research in Environmental Psychology, Sapienza University of Rome
Contact: Professor Marino Bonaiuto
Faculty of Sociology and Psychology, West University of Timișoara
Contact: Corina Mirela Ilin
Department of Psychology, University of A Coruña
Contact: Professor Ricardo García Mira
Faculty of Geography and Earth Sciences, University of Latvia
Contact: Professor Assistant Iveta Šteinberga
Oikos, Development Consulting inc.
Contact: Mojca Hrabar
Report details: Report title: Survey on Public Perceptions of Environmental Risks. Draft Final Report
Date issued: 01 December 2015
Version no.: 3.0
Author(s): Paula Orr, Katya Brooks, Liza
Papadopoulou, Marino Bonaiuto, Giuseppe Carrus, Stefano De Dominicis, Silvia Ariccio, Alexandra Stancu, Corina Ilin, Ricardo García Mira, Helena Martínez, Adina Dumitru, Isabel Lema, Iveta
Steinberga, Ieva Strode, Mojca Hrabar and Jurij Kobal.
CONTENTS
INTRODUCTION ... 1
1
1.1 Project aim and objectives ... 11.2 Research methodology ... 1
1.3 Report outline ... 1
PROJECT APPROACH AND METHODOLOGIES ... 3
2
2.1 Expert survey ... 42.2 Country focus groups ... 7
2.3 Approach to transferability ... 12
QUANTITATIVE RESULTS ... 13
3
3.1 Expert assessment of environmental risks ... 133.2 Focus group assessment of environmental risks ... 18
3.3 Comparison of ranking of environmental risks by type of respondent ... 24
QUALITATIVE ANALYSIS ... 28
4
4.1 Risk perception theory ... 284.2 Describing environmental risks: the Eurobarometer issues ... 31
4.3 Focus groups’ discussions of the individual environmental risks ... 31
4.4 Key findings regarding influences on understandings of environmental risk .... 39
4.5 Comparison across countries ... 43
4.6 Comparison between groups with different educational qualifications... 44
4.7 Learning about and developing understandings of environmental risks ... 45
CONCLUSIONS ... 50
5
5.1 Main findings about expert and lay perceptions of environmental risks ... 505.2 Factors that influence lay and expert perceptions of risk ... 50
5.3 Transferability of the findings of the research ... 53
5.4 Pathways to understanding environmental risks ... 53
5.5 Methodologies for researching lay assessments of environmental risks ... 54
References ... 55
Appendix 1: Detailed methodology of expert survey ... 57
Appendix 2: Focus group recruitment ... 60
Appendix 3: Methodology for focus group risk selection ... 61
Appendix 4: Focus group schedule ... 64
Appendix 5: Thematic framework for analysis ... 71
Appendix 6: Significance and probability of environmental and health
impacts ... 73
Appendix 7: Comparing assessments by European region... 75
Appendix 8: Environmental risk prioritisation and ranking ... 76
EXECUTIVE SUMMARY
Project aim and objectives
Collingwood Environmental Planning (CEP) Ltd (UK) was commissioned, in partnership with the University of A Coruña (Spain), University of Latvia (Latvia), Oikos (Slovenia), Sapienza University of Rome (Italy) and West University of Timisoara (Romania), by the European Commission’s DG Environment to undertake a research project on the public perception of environmental risks in Europe.
The overarching aim of the project was to understand the differences between public perception and scientific assessment of environmental risks and the main factors influencing the evolution of public perspectives in Europe. The specific objectives of the project were:
A comparison of the public perception of environmental risks with the scientific assessment of environmental risks.
A qualitative assessment of the public perception of environmental risks.
An overview of the main factors influencing the perception of environmental risks.
Research approach and methodology
The project used a mixed methodology research approach that combined a quantitative scientific assessment with a qualitative exploration with members of the public of the main factors influencing public perceptions of environmental risks. The lay assessment of environmental risks also drew on the results of the Eurobarometer survey of public attitudes towards the environment (European Union, 2014). The list of 14 environmental risk categories used in the Eurobarometer survey were used in this study.
The research comprised the following elements:
An online survey of European experts to provide a scientific classification of a list
of the 14 environmental risks included in the Eurobarometer survey.
Focus groups with members of the public to investigate why the public perception
of environmental risks differs from the scientific assessment of the same risks, explore the ways in which people think about and assess environmental risks and understand what influences their thinking.
The analysis of the results compared the assessment of environmental risks made by experts (through the survey) and by members of the public (in the focus groups and Eurobarometer) to identify the factors contributing to the assessment of environmental risks by each of these groups and any differences within groups.
The results were considered in relation to the different contexts in which they were obtained, to explore the transferability of the findings and their value in explaining behaviours in similar geographic, socio-economic and cultural contexts.
Expert survey
The expert survey was employed to provide a scientific classification of the environmental risks included in the Eurobarometer, based on probability and significance of negative impacts on the environment (including biodiversity and ecosystem services, water, air, noise, land use, soil) and human health.
A total of 415 scientific experts across European Union Member States were invited to participate via email. The survey achieved a response rate of 56% and a total of 104 valid responses (with a target of 100 responses), satisfying a pre-agreed set of respondent criteria.
Focus groups
Two focus groups were held in each of the six partner countries. A single recruitment questionnaire was used by all partner countries to ensure the participants’ profile was the same in terms of the following criteria: gender, age, nationality and residence, employment and educational qualifications. The profile of the participants in the two focus groups in each country was the same, with the exception of the educational qualifications variable, to allow for comparison between the two groups.
In total, 108 people attended the 12 focus groups, generally eight to twelve at each focus group. The composition of the groups complied with the criteria that were established; almost all participants were EU nationals and residents of the project partner country with a good balance of gender, age and employment status.
The analysis of the themes emerging from the focus groups drew on insights from an extensive academic literature on risk perception.
Quantitative results
Expert assessment of environmental risks
Based on the definition of risk assessment, a risk level can be generated by the
equation: Risk = Significance x Probability. Using this equation for the 14
environmental risks, the mean values assigned by respondents for the significance (or severity) of the impact were multiplied by the mean values assigned by respondents for the probability that each of these impacts will occur. This calculation was undertaken twice for each risk to obtain an assessment of both their environmental and human health impacts. The results of the scientific assessment were used to create a ranking of the risks.
Figure A: Expert assessment of environmental risks overall
Variance (in standard deviation and average score) was established to estimate the level of consensus among the experts on assigning values for risk impacts. Analysis of those results revealed:
There was greater consensus among experts on impacts on the environment
compared to impacts on health of the risks.
The area of participants’ expertise did not have a great impact on the assessment
The biogeographical region1 where the experts were working appeared to have
some influence on their assessment of some of the environmental issues. Public assessment of environmental risks
The focus group participants were asked to pick the five main environmental issues (out of the 14 included in the Eurobarometer survey) that they were most worried about (following the wording used in the survey). The total number of responses across levels of education was aggregated and subsequently converted to an overall ranking and public assessment of risks.
Results looking across participant characteristics showed:
The impact of the educational level of participants on their assessments of
environmental risks appeared to be small.
Looking at the aggregated results across countries, participants from different
countries agreed in their assessments of Air pollution, Water pollution and Chemicals in products as High to Medium priority risks, and Noise pollution and Invasive species as Low priority risks. There was greater variation in the assessments of the remaining risks.
Comparison of ranking of environmental risks by type of respondent
The rankings of environmental risks (14 highest - 1 lowest) by the three types of respondent - Experts, Eurobarometer and Focus group respondents - are presented in Figure B, as they emerged from the experts’ survey, the Eurobarometer survey and the focus group discussion respectively.
Figure B: Comparison of ranking of environmental risks by experts and members of the public (both Eurobarometer and the project focus groups) Ranking: 14 (highest) - 1 (lowest)
Some key observations from this comparison are:
1 The analysis used the four predominant biogeographical regions in the European Union: Northern
Europe, North-West Europe, Central and Eastern Europe, and Mediterranean Europe (EEA, 2012:27)
0 2 4 6 8 10 12 14 16
Experts
Eurobarometer
Air pollution was ranked as the highest risk across all three types of respondent.
There were considerable differences in the assessment of Urban problems, which
was ranked high for experts and focus groups but was only mentioned as a principal concern by 23 per cent of Eurobarometer survey respondents.
Consumption habits ranked third most important in the experts’ ranking but the
issue was of medium importance for both types of public respondents.
Both Eurobarometer and focus group participants were concerned about the
growing amount of Waste and the Depletion of natural resources, which ranked lower with experts.
Invasive species, Soil degradation and Land take ranked low with all types of
respondents.
Differences between expert and public assessments of environmental risks Expert or technical assessments of environmental risks take account of a range of possible impacts of an environmental phenomenon and the different ways these may be felt by different receptors (e.g. humans, animals, water bodies, etc.). The survey showed that the assessment was also affected by the perspective adopted, for example whether the focus is on impacts on human health or on the environment. Members of the public also took account of these factors in their assessment, along with other factors which were identified during the focus groups.
Overall, the environmental risks seen as being of highest concern across the focus groups were similar to the top risks identified by experts: Air pollution was ranked highest, with both experts and focus group participants also including Urban problems and Water pollution in their top five issues. Chemicals in products was one of the top five issues for the focus groups and ranked sixth by experts. Agricultural pollution was in the top five risks for experts and was ranked sixth by focus group participants.
The one issue that appeared high in the list of concerns for experts but that was generally ranked much lower across the focus groups was Consumption habits: only the UK focus group participants included it in the top five risks. For some participants Consumption habits was closely related to other issues such as Chemicals in products or Waste. However, whereas in other instances a connection between issues was seen as a cause for heightened concern, this was not the case for Consumption habits.
The main issue of concern to public participants that was not ranked highly by experts was Waste. Focus group respondents in Italy, Latvia, Slovenia and the UK ranked Waste in their top five environmental issues.
Local conditions and issues seem to have had an influence on focus group participants’ perception of environmental risks. This included references to the presence of specific national natural resources, local industries and livelihoods, issues that received publicity on the local/national news etc. The influence of location-specific factors on the assessment of risk was also observed in the case of experts.
Qualitative analysis and discussion
Many years of academic research on risk perception have identified a number of factors that appear to influence public perceptions of risk. More recently, efforts have been made to develop an integrative model of risk assessment (Breakwell, 1994; Renn and Rohrmann, 2000:221; Renn, 2008) which shows the interrelationship between a number of levels of understanding and response to environmental risks, within a framework of cultural values and norms and a structure of socio-political and economic systems and processes. Insights from these approaches inform the qualitative analysis.
Framing of the Eurobarometer issues
in mind. However, this could be a limitation for future development of similar research on public perceptions.
Key findings regarding the influences on understandings of environmental risk The focus group discussions allowed participants to explore their perceptions of environmental risks from a range of perspectives, with an emphasis on understanding differences between their assessments and those made by experts. Comparing the risk factors identified in academic literature with the evidence obtained from the 12 focus groups, some key findings emerge:
Scale and severity: the likelihood that a risk will affect a wide area or a large number of people, or that its impacts will be serious, was taken into account both in technical risk assessments and by focus group participants. For the focus groups, this increased the sense of risk, for example, in relation to Air and Water pollution, Chemicals in products and in some countries, the Depletion of natural resources.
Proximity of environmental risks contributed to making these appear to focus
group participants as a more immediate and pressing concern. This seemed to influence the prioritisation of Urban problems and Waste as well as being mentioned in relation to risks like Air pollution. However, it was also noted that people become accustomed to living with some kinds of risks and cease to be so aware of them.
A sense of personal control and efficacy can reduce concerns about environmental
risks, for example where consumer choices allow people to avoid Chemicals in products or noisy places that could damage their health. In contrast, the idea that people are exposed to risks over which they have no control tends to exacerbate concerns.
Social values can have a strong influence either to reinforce or attenuate the
sense of risk. Social values related to taking care of one’s own living space appear to have been an important factor in heightening concern about Waste; this is not considered a high risk from the point of view of a technical or scientific assessment.
An important factor that differentiates lay and technical (expert) risk assessment
is the tendency of lay people to look for an institution or individual responsible for the issue and its management. The loss of trust in authorities is associated with increased concern about those risks for which they are seen as responsible, for example Air and Water pollution.
Comparison between countries
Given the importance of contextual factors – both the geography, physical features and climate of the place one lives as well as its socio-economic, political and cultural systems – in shaping risk perceptions, focus groups in the six project countries would be expected to have different views of some or all of the environmental risks discussed. While responses to many risks were similar, the influence of geographic, cultural and socio-political context was apparent in relation to others.
Comparison between groups with different educational qualifications
One of the main areas of difference between participants with different educational qualifications was in their sources of information and the way in which they obtain information about environmental issues.
Learning about and developing understandings of environmental risks
The ways in which members of the public find out about and develop their understanding of environmental risks was explored in different ways during the focus groups.
Members of the public varied considerably in their views about how well-informed they were on environmental issues. The UK participants were most confident that they were well-informed, with the majority of participants in both focus groups saying they were either fairly or very well-informed, whereas there was a greater range of views within the Italian and Spanish focus groups. People’s perceptions are likely to be influenced by both external factors like the amount of information on environmental issues that is available to them and its accessibility, as well as their own attitudes about what kind of information they should have.
In all countries participants reported using a range of different sources to get information about environmental risks. The main sources were:
Internet: in every country, half or more of the focus group participants used the
Internet as a source of information on environmental issues.
TV news as well as programmes and documentaries on TV continue to be an
important source of information on environmental issues and were ranked the most important source by participants in Romania, Slovenia and the UK.
There were considerable differences between countries in terms of the importance
attributed to conversations with relatives, family, friends, neighbours and colleagues as a source of information on environmental issues. While this was reported to be a fairly important source of information in Italy, Latvia, Romania and Spain, it was mentioned by only a very small number of participants in both Slovenia and the UK.
The proliferation of information through the internet, social media and multiple TV channels tended to create confusion. In some cases, respondents claimed to consciously avoid information.
However, discussions in the focus groups showed that many people were using multiple sources of information to develop their understanding of what are often complex environmental issues. Most people check information about new and unfamiliar subjects: several participants said that it is important to confirm information they come across or look for opposing arguments.
Conclusions
Factors that influence lay and expert perceptions of risk
Both expert and lay risk assessments reflected the context of the risk and the focus of the person making the assessment. While the detailed analysis of the expert assessment of the set of environmental risks did not find evidence of bias in favour of the experts’ own areas of expertise, regional differences were found between expert assessments. Similarly, evidence from the focus group assessments indicated that lay people are influenced by their individual identity and background and by the collective cultural, institutional and socio-political systems and values within which their lives and activities develop.
Location-specific factors reflected in the focus group discussions included
environmental and climatic characteristics, history, geography, politics and economic development.
A number of qualitative characteristics of environmental risks were found to
Cultural factors, attitudes and behaviours may differ between geographic regions, countries, administrative districts and even local areas.
Social values can have a strong influence either to reinforce or attenuate the
sense of risk.
A loss of trust in authorities seen as responsible for managing risks was
associated with increased concern about those risks.
The focus group discussions provided evidence of the influence of cultural factors,
social values and lack of trust in authorities on lay perceptions of risk. The evidence available on expert prioritisation of environmental risks did not address the possible influence of these factors.
Transferability of the findings of the research
Transferability is concerned with the extent to which the findings of one study can be applied to other situations, in this case, the possibility of generalising from the findings of the expert survey and lay focus groups to other parts of the European Union or to Member States.
Given the small number of participants in the research (104 experts and 108 lay people) and the limited geographical coverage of the focus groups (six countries), the findings cannot be generalised in a simplistic way to the entire European context. However, if certain contextual elements are taken into account, some of the results could be used to suggest likely responses to environmental risks in some specific contexts. The main contextual elements considered to be of relevance are:
Urban density: risks associated with urban living (e.g. Urban problems, Air
pollution, Waste) are more relevant and immediate for urban dwellers and appear to be heightened in more densely populated urban locations (e.g. London, Rome, Riga);
Geographical and climatic factors: concern about pressures on natural resources
including water are likely to be heightened in locations where people have direct experience of the relevance of these to society and the economy (e.g. Romania, Slovenia and A Coruna in Spain);
Political economy: people in countries that have experienced recent major
political and economic change may feel greater uncertainty about the future along with lower levels of confidence in institutions and their ability to manage environmental risks.
In relation to the issue of trust in institutions, it is important to note the low level of trust in both public and private institutions that was expressed across all the focus group locations.
Pathways to understanding environmental risks
The main conclusions regarding the ways in which participants receive information and develop their understanding of environmental risks are:
A small proportion of lay people spontaneously search for information on
environmental issues.
The majority of people sometimes search for information on environmental issues
if these are made relevant to their own interests.
Information on action and response is of particular relevance and interest.
Once members of the public become interested in or engage with a particular
environmental risk, they tend to look for multiple sources of information and employ search strategies to check information.
There is a widespread lack of trust in many sources of information, including
The prevalence of the Internet as a source of information is reinforcing the ‘information overload’ where lay people’s information strategies become as much concerned with filtering out information that does not support their own world view or priorities, as they are about accessing a wide number of information sources.
It is important to present information in a way that is engaging and easy to
comprehend in order to capture people’s interest.
Methodologies for researching lay assessments of environmental risks
The use of a mixed methods approach to the research made it possible to obtain quantitative and qualitative data, which enriched the analysis and conclusions of the study. The expert survey was easy and quick for participants to complete, and a healthy response rate was achieved. No qualitative information was collected and this is an aspect that might be reconsidered if the survey is to be conducted again in the future. The use of focus groups in different Member States with participants from two different levels of education made it possible to collect data which was then analysed to explore a number of different aspects:
Expert versus lay perception and assessment of environmental risks.
Responses of participants with higher versus lower educational levels; and
between each of these levels and the expert assessment.
Participant responses across six Member State countries.
The main factors influencing the evolution of public perspectives in Europe.
A qualitative assessment of the public perception of environmental risks.
INTRODUCTION
1
Collingwood Environmental Planning (CEP) Ltd was commissioned, in partnership with the University of A Coruña, University of Latvia, Oikos, Sapienza University of Rome and West University of Timisoara, by the European Commission’s DG Environment to undertake a research project on the public perception of environmental risks in Europe.
1.1
Project aim and objectives
The overarching aim of the project was to understand the differences between public perception and scientific assessment of environmental risks and the main factors influencing the evolution of public perspectives in Europe. The outcomes of the project will also contribute towards developing a methodology and tools for monitoring public perception of environmental risk to inform future policy-making.
The specific objectives of the project were:
A comparison of the public perception of environmental risks with the scientific assessment of environmental risks.
A qualitative assessment of the public perception of environmental risks.
An overview of the main socio-cultural (including behavioural) factors influencing
the perception of environmental risks.
1.2
Research methodology
To meet these objectives, the research employed a mixed methods approach, utilising the qualitative and quantitative social research techniques of:
An online survey of European scientific experts: to provide a scientific
classification of a list of the environmental risks included in the Eurobarometer survey of public perceptions (2014), based on probability and significance of environmental and health impacts.
Focus groups with members of the public: to investigate why the public
perception of environmental risks differs from the scientific assessment of the same risks.
Analysis of the results: to compare the assessment of environmental risks made
by experts (through the survey) and by members of the public (in the focus groups and Eurobarometer survey), to analyse the factors contributing to the assessment of environmental risks by each of these groups and any differences within groups and to identify and analyse any environmental risks that emerged during the research.
1.3
Report outline
This report is structured in the following sections:
Section 2: Project approach and methodologies
This section briefly describes the approach and methodologies used in the design of the two main research methods (the expert survey and the focus groups) and for the analysis. It also includes a short explanation of the approach to the transferability of results.
Section 3: Expert and public prioritisation of environmental risks
This section presents an expert ranking (based on the expert survey) and a public ranking (based on the Eurobarometer and focus groups) of the 14 Eurobarometer environmental risks along with a comparison between the expert and public classifications.
Section 4: Analysis and discussion
Section 5: Conclusions
PROJECT APPROACH AND METHODOLOGIES
2
The project used a mixed methodology research approach that combined a quantitative assessment with a qualitative exploration of the main factors influencing public perceptions of environmental risks.
This methodology allowed comparisons to be drawn between three sources of information (a Eurobarometer survey, a survey of experts’ prioritisation of environmental risks and focus groups held with members of the public in six European Union Member States), while it also gave the research team the flexibility to delve into questions of ‘how’ members of the public develop understandings of environmental risks, ‘which’ factors lead them to classify them as such and ‘why’.
The elements of this approach and the methods used are summarised in Table 1. Table 1: Project approach
Scientific assessment Lay assessment
Method Expert survey Focus Groups Eurobarometer survey Approach Quantitative Qualitative Quantitative
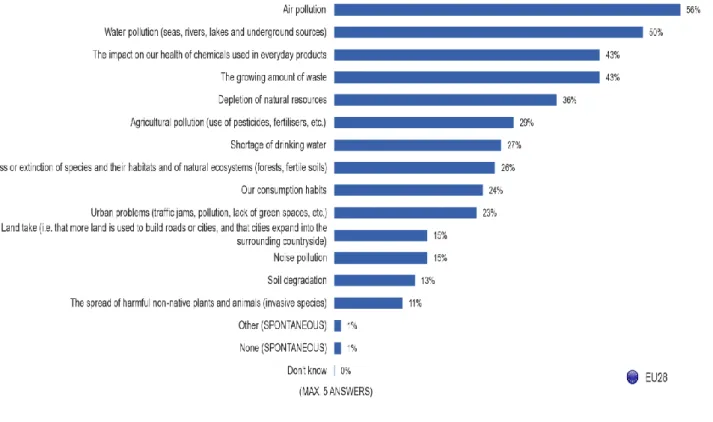
The lay assessment of environmental risks drew on the results of the Special
Eurobarometer 416: Attitudes of European citizens towards the environment2 (European
Union, 2014). Specifically, a list of 14 environmental issues identified in the Eurobarometer survey were used in this study. Figure 1 presents the results of the prioritisation of these issues.
Figure 1: Responses to Special Eurobarometer survey (2014) (QA2)
2 Unless otherwise specified, references to the Eurobarometer survey results and respondents refer
2.1
Expert survey
An online survey with scientific experts was employed to provide a scientific classification of the environmental risks included in the Eurobarometer survey, based on probability and significance of negative impacts on the environment (including biodiversity and
ecosystem services, water, air, noise, land use, soil) and human health
.
2.1.1 Survey design
The European Commission’s online survey tool, EUSurvey, was used to design and
disseminate the survey. To help achieve a satisfactory response rate, the survey was carefully designed and piloted to ensure it was straightforward and did not exceed a maximum of 15 minutes to complete.
The final format agreed with DG Environment after iterations included a set of Likert scale questions asking respondents to rate (1 (low) – 5 (high)) the significance3 and
probability of environmental and health risks. Qualitative risk assessment involves making a formal judgment on the significance (or ‘severity’) of the impact of a risk and the probability (or ‘likelihood’) of the risk occurring. As defined by a European Commission report dedicated to the harmonisation of risk assessment procedures (2000: 5), risk is “the probability and severity of an adverse effect/event occurring to man or the environment following exposure, under defined conditions, to a risk source(s).”
Based on this principle, a risk level can be generated by the equation: Risk =
Significance x Probability.
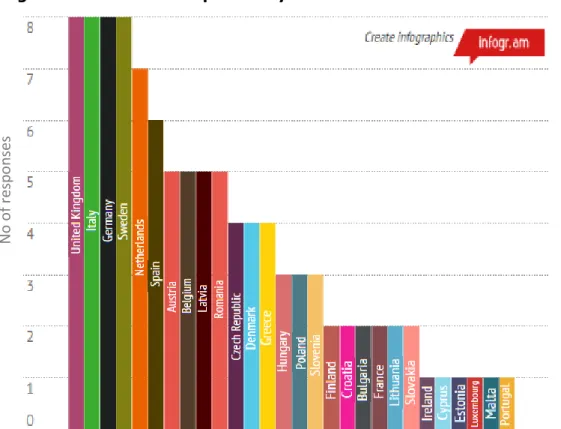
A total of 415 experts were invited to participate in the survey, with the overall target of obtaining 100 valid responses from scientific experts across European Union (henceforth EU) Member States. A two stage sampling methodology was used to ensure the sample population was representative of all relevant scientific disciplines and EU countries. Phase 1 of the survey included a wave of 200 invitations, with responses received and checked for validity against the recruitment criteria. The profile of respondents was analysed to identify any countries or areas of expertise that were underrepresented in the dataset and was followed by Phase 2 and a second targeted wave of 215 invitations. The number of invalid and valid responses and response rates received for Phases 1 and 2 of the survey of experts is presented in Table 2.
Table 2: Survey responses responses from experts in each of these Member States. In contrast, one response was
received from a single expert in Ireland, Malta, Luxembourg, Cyprus, Portugal and Estonia.
Figure 2: Number of responses by EU Member State
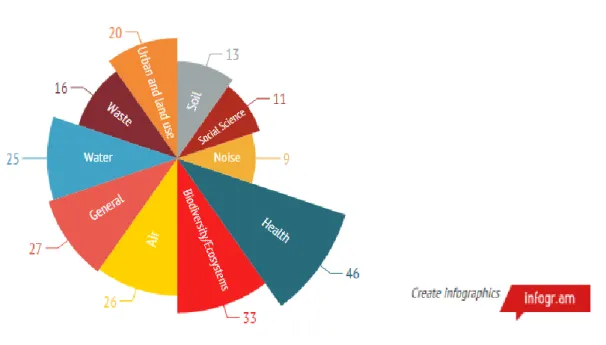
Out of the 104 experts whose responses were taken into consideration for data analysis, the majority (59) work for public academic/research institutions. The remaining 45 valid responses are from experts employed by public/government agencies. Respondents reflected a good spread across a wide range of scientific expertise and 46 per cent had expertise in health, which is close to the target of 50 per cent of respondents having expertise in this area. The areas of expertise with the highest representation were health and biodiversity / ecosystems (46 and 33 experts, respectively). Noise pollution (9) and social science (11) were the areas of expertise least represented. It is important to note that respondents were able to select more than one area of expertise, as relevant, and therefore the total number of areas of expertise identified and represented in Figure 3 is higher than the total number of respondents.
N
o
o
f re
sp
o
n
Figure 3: Number of responses by area of expertise
2.1.3 Data analysis
From the pool of 104 valid responses, based on the scores assigned by the scientific experts on a Likert scale of 1 (low impact) to 5 (high impact) the frequencies of values and the averages for distribution of values (mean, mode and median values) were calculated for each of the 14 environmental risks under the following four categories of assessment:
1. Significance of negative impacts on the environment
2. Significance of negative impacts on human health
3. Probability of negative impacts on the environment
4. Probability of negative impacts on human health
Using the risk equation (Risk = Significance x Probability) for the 14 environmental risks, the mean values assigned by respondents for the significance of the impact were multiplied by the mean values assigned by respondents for the probability that each of these impacts will occur, both on the environment and on human health. The results of this calculation provided rankings of all the risks as judged by the scientific experts that could be compared with the results of the Eurobarometer public survey.
Blank fields corresponding to ‘no response’ from respondents were removed when calculating variance and standard deviation. Only the responses with values were considered as valid responses. Any missing scores were excluded from analysis on a pairwise basis, which means that if a respondent has a score missing for a particular variable then their data are excluded only from calculations involving the variable for which they have no score.
2.1.4 Limitations
The detailed methodology for the expert survey is described in Appendix 1.
2.2
Country focus groups
2.2.1 Objectives of the focus groups
The purpose of the focus groups was to understand how and why public perception of environmental risks differs from the scientific assessment of the same risks. The Eurobarometer survey provides quantitative data about public perceptions of environmental risks across Europe. The focus groups provided an opportunity to explore the ways in which people think about and assess environmental risks and to understand what influences their thinking. Specifically, the focus groups were intended to:
1. Clarify what members of the public think that environmental risks are, in order to
compare their definitions with an expert definition (that includes both significance and probability of environmental and health impacts).
2. Compare public perceptions of environmental risks with the scientific assessment
of environmental risks, particularly looking at:
- The way that members of the public prioritise environmental risks;
- The factors that they take into account in making sense of and assessing
environmental risks.
3. Identify pathways for lay understandings of environmental risks and the main
socio-cultural (including behavioural) factors influencing the perception of environmental risks.
4. Capture different narratives or ways in which members of the public rationalise
their assessment of environmental risks. 2.2.2 Design of focus groups
Recruitment criteria
Two focus groups were planned with 8-10 participants each, to take place in each of the six partner countries. A single recruitment questionnaire was used in all partner countries to ensure participants’ profile was the same in terms of the following criteria: gender, age, nationality and residence, employment and educational qualifications. The profile of the participants in the two focus groups in each country was the same, with the exception of the educational qualifications variable, to allow for comparison between the two groups. The rationale for using educational qualifications as the variable for comparison was:
Clear recruitment process / question
Comparable across all partner countries
Consistency across all partner countries
Potential for comparison with experts (assumed to be university educated) e.g.
knowledge and assessment process
Based on this decision, participants in the two focus groups in each of the six countries under study had to fit the educational qualifications presented in Table 3.
Table 3: Variable for comparison within and between the focus groups
Focus group 1 Focus group 2
A detailed description of focus group recruitment is included in Appendix 2. Fieldwork
Across the partner countries all but one of the focus groups were held with eight or more participants, as specified in the focus group design. In a few cases respondents withdrew or failed to attend the discussion on the day and had to be replaced at short notice, resulting in the intended distribution of some of the participant characteristics (e.g. gender, educational qualifications) not being fully achieved. The possibility that participants may drop out is an inherent risk in any social research method and the project teams had recruited participants above target.
Location
In each country, the participants for the two focus groups were recruited in the same geographical area. The venue was also located in the area. The venues were checked against a set of established criteria of accessibility (near to public transport services and accessible for people with physical disabilities) and comfort to ensure that participants felt able to contribute freely.
Running of the focus groups
The first focus group was held in the UK and was used as a pilot to test the discussion guide and materials. An extensive report was produced on the lessons from the pilot and adjustments were made to improve the focus group design and delivery. This was used as the basis for the delivery of the remaining focus groups.
The focus group session was divided into two sections: the first lasting one hour and twenty minutes, and the second lasting 50 minutes, with a twenty minute break in between. The structure described below was principally followed for all focus groups with slight improvements incorporated following the pilot focus group.
The whole group were together for all but one exercise, when the group was divided into two, so that participants would have more time to give their views on the list of Eurobarometer issues. One facilitator worked with each group. The second facilitator was also essential in determining the two risks to be discussed using the methodology described in Appendix 3, while the first facilitator continued with the session.
It was crucial to have two facilitators both for the initial reception and welcome, creating the right atmosphere for the session and making people feel at home, as well as for the management and continuity of the sessions and ensuring that the discussions were captured. An audio recording was made of the whole session which was supplemented by detailed notes taken by the facilitators.
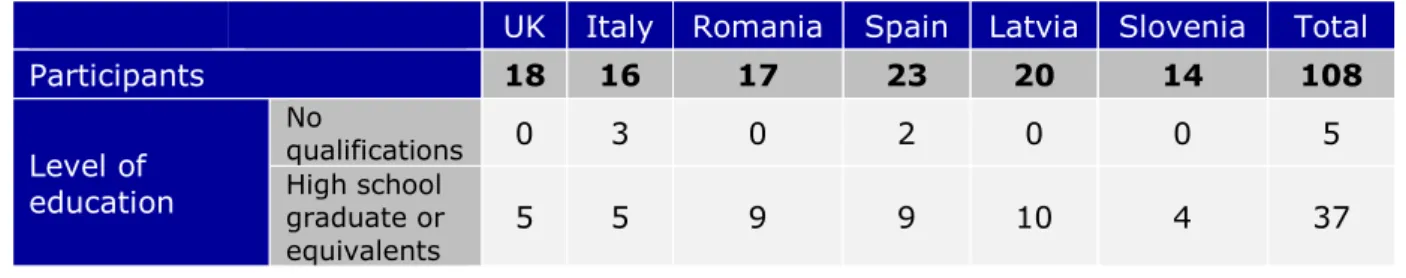
2.2.3 Characteristics of participants
In total, 108 people attended the 12 focus groups, eight to twelve at each focus group4,
meeting - and in some cases slightly exceeding - the target for attendance (eight to ten participants).
Table 4: Characteristics of participants in Focus Groups per country
UK Italy Romania Spain Latvia Slovenia Total
UK Italy Romania Spain Latvia Slovenia Total
The composition of the groups complied with the criteria that had been established:
All participants were EU nationals
Almost all participants were nationals of the project partner country (target: at least 70 per cent)
There was a good spread between the four major age categories: 18-24; 25-39;
40-54; 55 and over
A balance of genders: overall there were 54 men and 54 women
An adequate representation from all statuses of employment: participants in
employment, students, homemakers, retired and unemployed were all represented
The two groups in each partner country represented the two different levels of
educational qualifications, the characteristic chosen to be explored as an explanatory variable of the public’s perceptions around environmental risks. The first focus group in each country was run with the group with lower educational qualifications, where all participants had high school level qualifications, vocational qualifications or below. The second focus group was conducted with the group with university level educational qualifications.
2.2.4 Description of focus group structure and discussion guide
A fairly detailed schedule was designed for the session, taking participants through a series of activities that included responding to questions, verbal and visual prompts, ranking and sorting exercises and group discussions. After discussion within the team, it was decided that the use of pictures or photographs as prompts for discussions would be limited to the final session exploring pathways of understanding, to avoid these suggesting interpretations of the risks.
prompts to elicit information if that did not emerge from the initial activity or discussion. However, there was sufficient flexibility to allow new or unexpected information to emerge and to ensure that the discussion was not artificially limited to pre-established topics. The schedule for the focus group is shown in Appendix 4.
The key sections of the session were:
Scene setting and general questions about the environment
This section had a dual purpose: on the one hand to put participants at ease and introduce them to the sorts of topics that would be covered during the focus group; and second, to compare the members of the focus group’s general views towards the environment with those reflected in the Eurobarometer survey. Participants were asked to answer a short set of questions about their attitudes towards environmental issues; those questions were all taken from the Eurobarometer survey.
Prioritising environmental issues
During this part of the session participants individually ranked the 14 Eurobarometer issues and then discussed the reasons for the ranking. After the sessions the individual rankings were combined to generate a ranking for the group which could then be compared with the ranking of issues by the experts and by the Eurobarometer respondents. The group discussion was used to encourage participants to start reflecting on the way they think about environmental issues and the things that make them consider issues more or less worrying.
Environmental risks
The purpose of this section was to explain to participants how experts assess risks in terms of probability and consequence and to encourage them to explore whether using this approach might change the way they think about environmental issues.
Detailed discussion of two environmental risks
These discussions focused on individual risks and explored participants’ perceptions and understandings, leading to reflections on the processes involved in making sense of these risks (e.g. associations, narratives, reasoning, etc.). A particular focus of these sessions was to explore how members of the public think about environmental risks in order to contrast this with what is known about the ways in which experts think about the same risks. For this reason, in each focus group the facilitators looked at issues where there is a considerable gap between the importance attributed to the risk by experts and the lay assessment of the same risk. The methodology followed to decide these is detailed in Appendix 3.
Pathways for understanding environmental issues and risks
This section looked at the sources of information, prompts and processes that participants follow in building up a narrative or understanding of specific environmental risks. It encouraged participants to reflect on the sources of information that prompt them to think about specific risks, to what extent they are active or passive in relation to these sources of information and the factors that encourage them to pursue particular lines of reflection or questioning. A power point presentation was used to prompt discussion. 2.2.5 Focus group analysis
The analysis of participants’ discussions during the focus groups involved identifying and examining the themes emerging.
Broadly this involved coding the data according to themes which are either already named (deductive) or emerge from the data (inductive).
The six focus group reports were imported into Dedoose, a computer-assisted qualitative data analysis software (CAQDAS) package, which facilitated the management, coding and grouping of the qualitative data. A code tree was developed before starting to code the data (see Appendix 5). This included eight main code headings:
1. Background (how participants feel about environmental issues)
2. What do people understand by environmental issues?
3. Reasons for worry / concern about environmental issues
4. Reasons for low concern about some issues
5. Ranking of environmental risks by participants
6. Sources of information
7. Additional environmental risks raised by participants
8. Conceptual understanding of environmental ‘risks’ versus ‘issues’
During coding, additional codes were added to capture emergent themes from the focus group reports. Once the data were coded, excerpts relating to a code were exported and then analysed further looking for links and relationships within and between codes across the focus groups.
In the discussion of these themes, we have drawn on insights from an extensive academic literature on risk perception. We identify similarities and differences in perceptions of environmental risks across countries and educational levels. Throughout the report there are also comparisons drawn between the combined results of the focus groups and the expert survey, as well as the Eurobarometer survey. We have also looked at possible reasons for the observed results using insights provided by focus group participants and any influences of the specific country context and background. 2.2.6 Limitations
As with all research methods there are limitations to focus group research. It is important to remember that each focus group comprises different individuals with their own attitudes, behaviours and views that have been purposively recruited for the study. It should not be assumed that the participants in the 12 focus group are representative of Europe’s population, but as explained in Section 2.3, contexts and characteristics can be identified that allow the transferability of findings. Any comparisons between focus group participants, experts and the Eurobarometer survey were made based on observations of small groups of people who discussed these topics for 2.5 hours.
Further, all focus groups were undertaken in urban environments which has possibly influenced what the focus group population identified as high priority environmental risks and other aspects of their discussions. For instance, air pollution might have been seen as less important were the focus groups undertaken in rural settings. The locations of the focus groups as well as the individual country contexts (see section 2.3) must be taken into consideration.
Focus groups rely heavily on assisted discussion, so the role of the facilitators is critical. Facilitators in the project focus groups were aware of potential impacts of:
The ‘Hawthorne effect’– whereby participants are aware they are being studied
and therefore may say what they think the facilitator wants to hear or just generally change their behaviour because of the study and the unnatural social setting. (Merrett , 2006)
‘Groupthink’– where participants actively hide their own viewpoints on a topic and
just agree with the dominant view/individual in the group, generally to avoid conflict, achieve consensus or due to feeling inhibited. (Rose, 2011)
2.3
Approach to transferability
The specification for this project asked that there should be “an extrapolation of the results from the focus groups to the entire EU, thus providing an EU-wide analysis”. Given the qualitative nature of the data and the small scale of the project, the type of extrapolation that is possible is what is termed ‘transferability’. Typically qualitative
research - such as focus groups - is not amenable to the generalizability5 that is possible
with large random samples of the population; hence it is not possible to extrapolate from the results. However, one measure of the quality of qualitative research is that of “transferability” (Lincoln and Guba, 1985). This is the extent to which researchers consider the context in which the data has been gathered to be significantly similar to another context so that they feel able to suggest there would be similar findings in that context.
Therefore, in this project we have considered if findings from one country with a certain set of characteristics could be transferable and make sense for another European country.
5 The word 'generalizability' is defined as the degree to which the findings can be generalized from
QUANTITATIVE RESULTS
3
3.1
Expert assessment of environmental risks
3.1.1 Summary of survey results and expert rankingIn the first phase of the project, scientific experts were invited to participate in an online survey about environmental risks. Respondents were asked to make a scientific
assessment of each one of the 14 Eurobarometer environmental risks6, in terms of the
probability of the issue occurring and the significance of its impact if it should occur; and the results were used to create a ranking. This was achieved by firstly conducting separate analyses on experts’ assessments of potential negative impacts of all risks: 1) on the environment, and 2) on human health.
Applying the definition of risk, whereby risk is “a function of the probability and severity
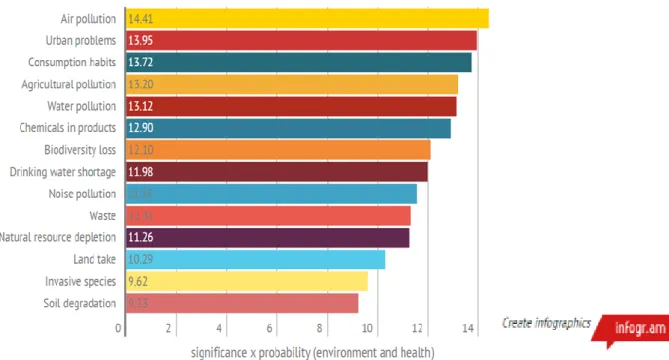
of an adverse effect/event”, the average value for the Significance (or severity) of negative environmental impacts was multiplied by the average value of its Probability. This calculation was undertaken to obtain a numerical value for the risk of environmental impacts. The same process was followed to obtain a numerical value for the risk of health impacts. This equation was applied to each risk (Appendix 5 presents the results for significance and probability of each risk with separate and aggregate calculations for the health and environmental impacts of each risk). The two values were added and divided by 2, to provide the expert assessment of risks overall. Figure 4 shows the ranking of the risks from the perspective of the scientific expert respondents.
Figure 4: Expert assessment of environmental risks overall
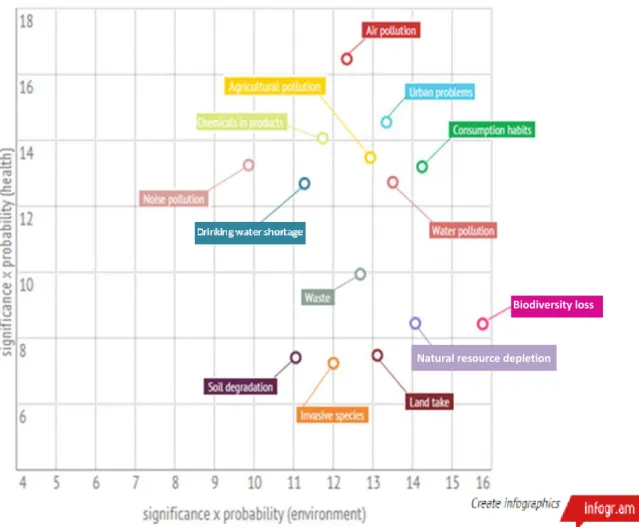
Projecting the mean values for the environmental and the health impacts of risks on a Cartesian coordinate system captures the spatial scattering of these values. Any given location on a Cartesian coordinate system is defined by its coordinates; a pair of values corresponding to either one of the axis. The horizontal axis in Figure 5 represents the mean values of the environmental impacts, while the vertical axis represents the mean values for the health impacts of each risk (both calculated as a function of significance and probability - see Appendix 6). Each dot on Figure 5 is therefore a risk defined by the
6 It is worth noting that the 14 environmental risks identified in the Eurobarometer survey do not
values of its environmental (horizontal axis) and health impact (vertical axis) assessments. Therefore, a risk located at the top right corner of Figure 5 was assessed high both in terms of its health and environmental impacts. If a risk is located lower on the vertical axis, this implies that its health impact was assessed as being lower, while any movement to the left along the horizontal axis would imply that its environmental impact was assessed as being lower. Considering the narrow range of the Likert scale (1-5) the differences in results can be perceived as relevant. Air pollution, Urban problems and Consumption habits are placed considerably further apart in the scale than risks such as Land take, Invasive species and Soil degradation. It is also interesting to note that some risks, such as Biodiversity loss and Depletion of natural resources, were assessed particularly high in terms of their environmental impact but considerably lower in terms of their health impact. On the contrary Noise pollution was assessed in the top five for its health impact but particularly low for its environmental impact.
Figure 5: Expert assessment of environmental risks overall on a Cartesian coordinate system (Horizontal axis: assessment of environmental impacts, Vertical axis: assessment of health impacts)
3.1.2 Comparing assessments of impact on the environment versus impact on health
Looking at the differences between the expert scores for the environmental and the health impacts of the risks, the ranking changes considerably, as shown in Figure 6. Air pollution, the environmental risk ranked highest overall by experts and the one that is most commonly considered as a cause of worry by members of the public, is clearly the top-scoring risk in terms of health impacts but appears in the bottom half of the experts’ ranking of environmental impacts.
Biodiversity loss
Figure 6: Expert assessment of risks in terms of significance and probability of environmental (left) and health (right) impacts
Environmental impacts assessment Health impacts assessment
Urban problems is the only risk in common in the top five risks for both human health impacts and environment impacts as assessed by survey respondents. Soil degradation and Invasive species are ranked in the bottom five and Waste in the middle for both categories of impact. The differences between rankings for risks based on human health or environmental impacts also present interesting findings, for example: Noise pollution and Chemicals in products both feature in the top five based on human health impacts but are in the bottom five for environmental impacts; Biodiversity loss and Natural resource depletion are in the top five risks for environmental impacts but in the bottom five for human health impacts.
There is considerably greater variation in the scores for the health impacts of risks than the variation in the scores for the environmental impacts or the composite scores. The scores for health impacts range from 16.45 – 7.22 (i.e. over 9 points) whereas the variation across both environmental and composite scores is less than 6 points.
Considering these findings, it would be useful for future research to explore whether the experts had a different way of conceptualising risks when evaluating their impact on the environment versus their impact on human health.
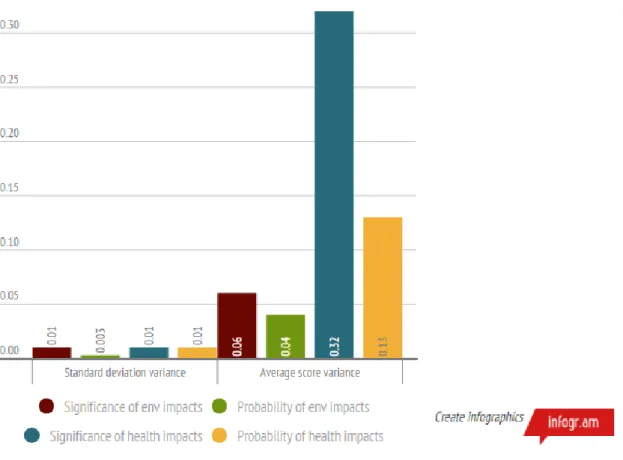
3.1.3 Comparing assessments among experts
Figure 7: Variance in standard deviation and average score
Level of consensusby area of expertise
Due to the high proportion of experts in the environment and in human health in the data set, analysis was undertaken to compare the differences in assessment of impacts on the environment and impacts on human health by area of expertise. The two expert groups compared were a group of experts who had selected ‘health’ as one of their areas of expertise and a group who hadn’t.
The mean values for both expert groups for the probability and significance of impacts on both the environment and human health were multiplied and the results of this analysis showed a minor change in assessment values across the risks. This result goes against the hypothesis that experts representing a particular area of expertise will cause higher probability and significance values for the risk associated with their area of expertise. This is not to say that there were no differences between the experts in terms of their assessments, but that the differences cannot be explained by bias in favour of the expert’s own discipline.
Some risk assessment literature advises against aggregating the results of different
experts’ assessment of risks7, arguing that different experts use different lenses to make
sense of the same information:
But, while some see a grand unification of all knowledge as an inevitable product of scientific advance (Wilson, 1998), thus far the growth of disciplinary scientific methods and bodies of knowledge results in an increasing disunity that translates into a multitude of different yet equally legitimate scientific lenses for understanding and interpreting nature. (Sarewitz, 2004: 390)
7 For example, Bedford, T. and Cooke, R. (2001) Probabilistic Risk Assessment. Cambridge:
The standard deviation variance observed in this survey supports the view that experts may have ‘different but equally legitimate’ ways of assessing risks. This is also endorsed by the findings of comparative analysis undertaken of the results for each risk to examine the potential bias inherent in a respondent’s area of expertise as a factor in how a risk was assessed.
Ultimately, as Sjöberg argues, “Risk assessment is not only a question of factual
judgment; values enter necessarily” (2002: 447). It is likely that a number of other personal and professional values and factors, in addition to area of expertise, are involved in each expert’s risk assessment. As human beings, experts cannot divorce themselves from the values they hold that will inevitably affect how they judge and conceptualise an environmental risk.
Level of consensus by European region
Analysis of data across the four predominant biogeographical regions in the European
Union8 (EEA, 2012) showed results of the assessments for the environmental risks of
Consumption habits and Agricultural pollution to be particularly interesting. For each region, the average values were calculated for significance and probability of impacts on both the environment and human health. The mean value for significance was multiplied by the mean value for probability to determine the overall assessment of impacts on both human health and the environment.
Overall, Air pollution and Urban pollution were included in the top five for all bioregions. While Consumption habits were included in the top five risks for experts in Northern and North-Western Europe, this was less of a concern for experts in the Central-Eastern and Mediterranean regions. Agricultural pollution was ranked highest in the Central-Eastern region, whereas it was assessed fifth in the rest of the regions. Detailed figures across each biogeographical regions are included in Appendix 7.
3.1.4 Other environmental risks identified by experts
The experts were invited to identify additional risks that should be included in the list of environmental risks. A total of 24 new risks were identified by 37 experts. The additional risk mentioned most frequently was climate change, which was suggested by 9 respondents. Flooding was suggested by three respondents. None of the other new risks were proposed by more than two experts.
3.1.5 Implications of the expert survey results for focus group research (Phase 2)
The analysis of the results of the survey of experts highlighted a number of differences between the experts’ assessments and the Eurobarometer survey of public attitudes and suggested some fruitful areas for exploration in the focus groups (see Figure 8).
8 For the analysis, the four predominant biogeographical regions in the European Union (Northern
Figure 8: Comparison of environmental risk assessment between experts and Eurobarometer respondents
Some key observations indicating interesting lines of investigation included:
Two of the top three in the expert ranking of environmental risks are not
commonly considered to be of concern by those responding to the Eurobarometer survey: these are Urban problems and Consumption habits.
Depletion of natural resources came out as one of five top risks in the
Eurobarometer survey, being mentioned by 36 per cent of respondents, whereas the same risk was in the bottom four risks for experts.
It does not appear that the assessment of either the health or the environmental
impacts of the issues is more important in determining the experts’ overall score.
The biogeographical region where the experts are working appears to have an
impact on their assessment of some of the environmental issues (Consumption habits and Agricultural pollution). No evidence was collected that would have made it possible to ascertain the reason for this influence.
This preliminary analysis informed the design of the focus group discussions.
3.2
Focus group assessment of environmental risks
The Eurobarometer survey developed a ranking of environmental risks by providing respondents from the general public with a list of 14 environmental issues and asking them to pick the five that they were most worried about.
The focus group participants were given a set of cards, each with one of the environmental issues from the Eurobarometer survey. They were asked to read through the cards and then pick out the five main environmental issues that they were worried about (this is the wording used in the survey).
3.2.1 Comparison between different levels of education
Table 5 presents the aggregate findings of the individual ranking of the participants, with the first five rows representing the overall top five priority environmental issues across the six partner countries. The third and fourth columns show the results by the level of educational qualifications of participants. The ‘Total’ columns refer to the total number of
0 2 4 6 8 10 12 14 16
Experts
responses while the ‘Ranking’ columns converts the total number of responses into a ranking of the risks, where 14 is the highest risk and 1 is the lowest risk. These rankings were extracted from the aggregation of results across levels of education and the subsequent conversion of the total number of responses to ranks. Where the number of total responses was the same for two or more risks, the risks have been ranked in the same position.
Table 5: Aggregate ranking of environmental risks
Environmental Risk
All participants (column 1)
Lower educational qualifications
(column 2)
Higher educational qualifications
(column 3)
Total Ranking Total Ranking Total Ranking
Air pollution 78 14 39 13 39 14
Water pollution 74 13 45 14 29 12
Chemicals in
products 58 12 27 10 31 13
Waste 54 11 31 12 23 10
Urban problems 46 10 28 11 18 7
Agricultural
pollution 44 9 20 9 24 11
Biodiversity loss 39 8 20 9 19 8
Natural resource
depletion 38 7 16 7 22 9
Consumption
habits 31 6 14 6 17 6
Drinking water
shortage 26 5 11 4 15 5
Land take 20 4 14 6 6 3
Soil degradation 14 3 4 2 10 4
Noise pollution 11 2 5 3 6 3
Invasive species 10 1 4 2 6 3
Base: Total (All 108 participants), Lower educational qualifications (58 participants), Higher educational qualifications (50 participants)