Article
Smart Pipe System for a Shipyard 4.0
Paula Fraga-Lamas *, Diego Noceda-Davila, Tiago M. Fernández-Caramés, Manuel A. Díaz-Bouza and Miguel Vilar-Montesinos
Unidad Mixta de Investigación Navantia-UDC, Universidade da Coruña, Edificio Talleres Tecnológicos, Mendizábal s/n, Ferrol 15403, Spain; [email protected] (D.N.-D.); [email protected] (T.M.F.-C.); [email protected] (M.A.D.-B.); [email protected] (M.V.-M.)
* Correspondence: [email protected]; Tel.: +34-98-116-7000 (ext. 6051)
Academic Editors: Dongkyun Kim, Houbing Song, Juan-Carlos Cano, Wei Wang, Waleed Ejaz and Qinghe Du Received: 31 October 2016; Accepted: 15 December 2016; Published: 20 December 2016
Abstract:As a result of the progressive implantation of the Industry 4.0 paradigm, many industries are experimenting a revolution that shipyards cannot ignore. Therefore, the application of the principles of Industry 4.0 to shipyards are leading to the creation of Shipyards 4.0. Due to this, Navantia, one of the 10 largest shipbuilders in the world, is updating its whole inner workings to keep up with the near-future challenges that a Shipyard 4.0 will have to face. Such challenges can be divided into three groups: the vertical integration of production systems, the horizontal integration of a new generation of value creation networks, and the re-engineering of the entire production chain, making changes that affect the entire life cycle of each piece of a ship. Pipes, which exist in a huge number and varied typology on a ship, are one of the key pieces, and its monitoring constitutes a prospective cyber-physical system. Their improved identification, traceability, and indoor location, from production and through their life, can enhance shipyard productivity and safety. In order to perform such tasks, this article first conducts a thorough analysis of the shipyard environment. From this analysis, the essential hardware and software technical requirements are determined. Next, the concept of smart pipe is presented and defined as an object able to transmit signals periodically that allows for providing enhanced services in a shipyard. In order to build a smart pipe system, different technologies are selected and evaluated, concluding that passive and active RFID (Radio Frequency Identification) are currently the most appropriate technologies to create it. Furthermore, some promising indoor positioning results obtained in a pipe workshop are presented, showing that multi-antenna algorithms and Kalman filtering can help to stabilize Received Signal Strength (RSS) and improve the overall accuracy of the system.
Keywords: IoT; RFID; Wi-Fi; Industry 4.0; Shipyard 4.0; smart pipes; identification; localization; tracking; indoor positioning; cyber-physical systems; RSS; multi-antenna techniques; Kalman filter
1. Introduction
After the triumph of the lean production systems in the 1970s, the outsourcing manufacturing phenomenon of the 1990s, and the automation that took off in the 2000s, the fourth major disruption in modern manufacturing is Industry 4.0. This industrial revolution can be defined as the next phase in the digitalization of the sector [1], driven by several emerging technologies: the ubiquitous use of sensors, the stunning rise in data volume, the increasing computational power, and connectivity; the emergence of analytics, cloud computing and business-intelligence capabilities; new forms of human-machine interaction such as augmented-reality systems; and advances in transferring digital instructions to the physical world, such as Cyber-Physical Systems (CPS), Internet of Things (IoT), robotics, and 3-D printing. Most of these technologies are mature and they have been present for some time. Although some of them are not yet ready for a broader application, many are now at a position where their greater reliability and cost-effectiveness are starting to be appealing for industrial applications.
In the short-term, Industry 4.0 is expected to have a major effect on global economies. PwC’s 2016 Global Industry 4.0 Survey [2] suggests that annual digital investments are expected to achieve US$907 bn per year through 2020. Survey respondents anticipate that those investments will lead to US$493 bn in additional revenues annually. Furthermore, savings are estimated at US$421 bn in costs and efficiency gains each year.
The foundations of the Industry 4.0 can be transferred straight to a Shipyard 4.0. The deployment of Cyber-Physical Systems in production systems gives birth to the “smart factory” and, analogously, to the “smart shipyard”. Products, resources, and business and engineering processes are deeply integrated making production operate in a flexible, efficient, and green way with constant real-time quality control, and cost advantages in comparison with traditional production systems. Machinery and equipment will have the ability to improve processes through self-optimization and autonomous decision-making. Shipbuilders face the same challenges as industry [3], which can be classified into three main concerns: the vertical integration of production systems, the horizontal integration of a new generation of networks that create added-value, and the acceleration of technologies that require the re-engineering of the entire production chain.
The vertical integration of production systems changes naval production chains. It entrusts the intelligent shipyards to ensure safe production. The smart ships, more environmental friendly, are capable of operating in network together with other ships and ground infrastructure. The horizontal integration of a new generation of value creation networks is critical as it provides an integrated way to satisfy the demands from the different stakeholders, allowing for the customization of ships in a short period of time.
The third challenge is the end-to-end digital integration of engineering across the entire value chain, ranging from design to after-sales service. This evolution implies introducing disrupting technologies that affect the entire life cycle of each piece of the ship, from acceleration technologies, such as artificial intelligence, robotics, virtual reality, driverless vehicles for the transport of parts, drones, remote sensing networks or 3D/4D printing, among others. The aim of these technologies is, primarily, to allow shipyards to collect more data and make better use of it, for example:
• Naval Command, Control, Communications, Computers, Intelligence, Surveillance and Reconnaissance (C4ISR) capabilities will be impacted by the development of a number of technologies based on the information extracted from the emerging data.
• Curved 3D organic light emitting diode (OLED) displays will be supported by form factors that take advantage of capabilities such as voice, handwriting, touch, gesture, eye movement, or even brain control. Designers will be able to interact with their designs without a keyboard or mouse, Human-Computer Interfaces (HCI) will encourage innovation and efficient design workflow. Such interfaces will be able to support more natural modes of interaction and will be more intuitive and therefore easier to operate, reducing the need for training.
• Data obtained from remote sensing and intelligent algorithms will accelerate the ship design process, and 2D design will be easily converted into 3D.
• Complex construction and inspection tasks will be supported by augmented reality.
• Graphene strips, with allocated sensors alongside the hull, will provide more accurate data about the hull’s working conditions. These will monitor external (seawater temperature, impacts, and fouling) and internal factors (stresses, microbial induced corrosion, and bending). This information will enable a new approach called Hull-Skin-Data centered decisions that would be adopted according to those working parameters.
• Instead of leaving the majority of outfitting tasks until the moment after launching, some outfitting, such as piping and heavy machinery, will be developed together with the hull structure speeding up the building process.
• Progressive sensorization process will enable automated casting, forging, rolling, cutting, welding or cleaning [4].
• Time spent on the outfitting along the quay will be minimized. Robotics will capture 3D images throughout the vessel and will establish a reference dataset to support real-time ship operations and life maintenance.
• Enhanced crane-lifting capabilities will speed up production time.
Furthermore, with the development of applications based on these emerging technologies, a Shipyard 4.0 can leverage smarter energy consumption, greater inbound/outbound logistics and information storage (asset utilization, supply/demand match, inventories, time to market), workforce safety and control (automation of knowledge work, digital performance management, human-robot collaboration, remote monitoring) and real-time yield optimization.
Navantia [5] is a Spanish naval company (Madrid, Spain) that offers integral solutions to its clients and which has the capacity required to assume responsibility over any naval program in the world, delivering fully operational vessels, and support throughout the service life of the product. Its main working areas are the design and construction of hi-tech military and civil vessels, the design and manufacturing of control and combat systems, overhauls and alterations of military and civil vessels, diesel engine manufacturing, and turbine manufacturing. Although Navantia has developed naval programs all around the world, at a domestic scale, Navantia’s main customer is the Spanish Navy (this collaboration dates back 250 years). The high level of the Spanish Navy, with a worldwide operating capacity and collaborations with the most modern navies, allows Navantia to offer value added products. Specifically, this article reviews the advances in one of the research lines of the Joint Research Unit Navantia-UDC (University of A Coruña).
Pipes are a key part of ships: a regular ship contains between 15,000 and 40,000 pipes, whose use goes from fuel transportation or coolant for engines, to carry drinking water or waste. With such a huge number and varied typology, it is important to maintain the traceability and status of the pipes, what speeds up their maintenance procedures, accelerates locating them, and allows for obtaining easily their characteristics when building and installing them.
This need for controlling and monitoring pipes can be approached by Cyber-Physical Systems (CPSs). A smart pipe system is a novel example of the benefits of CPS, providing a reliable remote monitoring platform to leverage environment, safety, strategic and economic benefits. While the physical plane focuses on the designs for sensing, data-retrieving, event-handling, communication, and coverage problems, the cyber plane focuses on the development of cross-layered and cross-domain intelligence from multiple environments and the interactions between the virtual and the physical world. In this paper, the physical plane is based on the concept of smart pipe, a sort of pipe able to transmit signals periodically that allows for providing useful services in a shipyard.
Today, the pipe management process varies depending on the shipyard, but, in general, it is performed in three different scenarios: the pipe workshop where they are built, and the block outfitting and the ship, where assembly takes place. This paper is focused on the pipe workshop, which is handled in a similar way in most shipyards.
In Figure1it is represented the floor map of the pipe workshop that Navantia owns in Ferrol (Galicia, Spain). The areas colored represent the main operative areas, while in white are offices and other secondary auxiliary areas. The following are the most relevant areas:
• Pipe reception. In this area raw pipes are stacked by the suppliers. It is divided into two different areas: small pipes are stored in a robotic storage, while large pipes are placed on the floor on diverse spots.
• Bending. Some pipes need to be bent to adapt them to the characteristics of the place where they will be installed on the ship.
• Manufacturing. These are actually three areas of the workshop where operators add accessories and where pipes made of multiple sub-pipes are joined.
• Provider’s outbound storage. In times of excessive production load, some is derived to external providers. The outbound storage area is where providers collect the pipes and return them after their processing.
• Welding. There are different booths where operators carry out welding tasks.
• Cleaning. Before manufacturing, pipes have to be cleaned. This area contains bathtubs to expose pipes to hot water, acids, or pressurized water.
• Main warehouse. This is where accessories and tool supplies are stored.
Main Warehouse Cleaning
Manufacturing Welding
Outbound Storage
Manufacturing Bending Cutting
Reception
Figure 1.Floor map of the workshop.
In this scenario, the way pipes are currently built (detailed next in Section2.1) can be improved and optimized. In this article it is proposed a system of smart pipes that avoids paperwork and automates pipe identification, tracking, and traceability control. The system consists of a network of beacons that collect information about the location of the pipes continuously. Such information is provided by RFID tags that also contain information that allows operators to identify each pipe and determine how to process it at every stage.
The present paper is aimed at applying the latest research and the best technologies to build a smart pipe system for a shipyard, but it also includes the following novel contributions, which, as of writing, have not been found together in the literature:
• It presents the concept of Shipyard 4.0, which consists in the application of the principles of Industry 4.0 to a shipyard.
• It describes in detail how a shipyard pipe workshop works and what are the requirements for building a smart pipe system.
• The paper indicates how to build a positioning system from scratch in an environment as harsh in terms of communications as a shipyard. Furthermore, it was not found in the literature any practical analysis on the application of RFID technology in any similar application and scenario. • It defines the concept of smart pipe and shows an example of its implementation and the
architecture that supports it.
The remainder of this paper is organized as follows. Section2describes the process of pipe manufacturing in a modern shipyard and analyzes the technologies that can be used for identifying pipes. Section3details the design of the system, including the operational and hardware requirements, and the communications architecture. Section4reviews the system modules and the RSS stabilization techniques proposed. Section5describes the experimental setup and the tests performed with the technologies selected. Finally, Section6is devoted to the conclusions.
2. Related Work
2.1. Pipe Manufacturing in a Modern Shipyard
The current procedure for managing the pipes in the workshop consists of the following steps: 1. Initially, pipes are placed in a storage area, where they will be collected by operators according
to production needs. In the case of the shipyard that Navantia owns in Ferrol, two zones can be distinguished: one for small pipes and another for the large ones. The area for small pipes is an intelligent warehouse where an operator registers the pipes that arrive and then extracts them on demand according to the characteristics specified. Figure2shows the stacking area for large pipes, whose occupancy level is not determined automatically.
2. The first pipe processing point is the cutting area (in Figure3). In production, as soon as the first cut of a pipe is made, operators place a plastic label that is attached using electric cable (this kind of cable is used because it has to resist being exposed to acids and hot water). This label contains alphanumeric identification information and includes a barcode. Pipes are stacked on pallets, which allow for moving them easily between the different stages of the production chain. Regarding such pallets, it is important to note that:
• Operators distinguish visually each pallet through an identifier painted on it.
• Pallets are moved by cranes through the workshop. They are not usually moved until they are considered to be full. When a pallet is moved to a new section, pipes are checked by operators who, by reading the label barcode with a scanner, get information on the process that should be carried out on the pipe. At the same time, the barcode reading operation allows for registering its location, since every scanner is associated with a specific place. • Each pallet carries paper documentation related to the pipes contained.
3. The second stage of the pipes is bending (if it is required). There are three benders in the workshop, which can be controlled from a Windows-based PC that is also able to receive and load design files from the engineering department.
4. Before manufacturing, pipes might need to be cleaned. For such a purpose, there is an area for degreasing and rinsing pipes by using water or certain acids.
5. Next, pipes are moved to the manufacturing area, where accessories are added. These elements are transported in metal pallets from the workshop warehouse. There is not a quick communication between the warehouse and manufacturing to indicate when the accessories associated with a pipe are available (i.e., operators have to walk to the warehouse and check the availability of the accessories).
6. After manufacturing, pipes are packed with others on pallets. This packaging is registered before the pallet leaves the manufacturing area.
7. Large pipes can be stored temporarily in a reserved area located at one end of the workshop. Although there are more stacking areas, both indoors and outdoors, there is no real-time control of the occupancy percentage of the areas (i.e., the number of pipes in them).
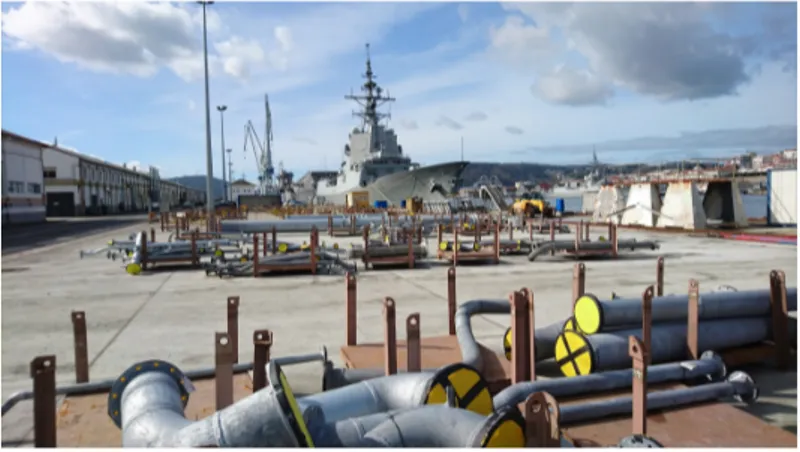
9. Once the pallet leaves the production area, the traceability of the pipes is lost, and there are no records of their movements and/or location in the different storage areas. The largest storage area is outdoors, next to the workshop, in a nearby dock (as it is shown in Figure4).
Figure 2.Stacking area for large pipes.
Figure 3.Cutting area of the workshop.
Figure 4.External storage areas in the dock.
2.2. Identification, Tracking and Location Systems for Shipyards and Smart Manufacturing
Similarly, the same authors propose the use of smart robots for welding in a shipyard [11], but in this case they design a display system for the recognition of the areas to be welded.
The problem of locating people in a shipyard has been studied by Kawakubo et al. in [12]. In such a paper, the authors use Bluetooth technology for the location by means of fixed and mobile stations. Thus, the authors achieve a precision of 1.2 m using a fixed network of readers in which each of the readers is placed at a distance of about 8 m.
Sensor networks have also been proposed for monitoring different construction tasks [13]. For instance, a practical example of a real-time monitoring system for the concentration of CO is described in [14]. A more specific development for the construction of ships and maritime platforms in a shipyard is detailed in [15]. There, the authors describe a system of hyper-environments that use sensor networks, virtual reality, and RFID to improve the process of supply tacking.
In environments where the presence of metals is high, radio frequency (RF) communications are clearly affected. This impact is well illustrated in [16], where a series of experiments with diverse tags showed that the signal strength decays when the tags are placed on a copper metal plate. In this regard, in [17] several techniques are analyzed to improve the performance of RFID tags on metal, showing that the length of the antenna is a variable that can improve impedance adaptation. In an environment close to the shipyard, the authors in [18] analyze the feasibility of adhering passive RFID tags on metal bent pipes.
In order to overcome harsh environments, multiple tags and components have been designed to enable RFID communications in metallic environments. Examples are [19,20] or [21], where UHF RFID tags are specifically designed to be used on various metal surfaces and containers. If conditions such as high temperatures are added to the presence of metals, RF communication is even more complicated. Therefore, components need to be adapted to harsh communications scenarios. An example is studied in [22], where the authors analyze some of the complications faced by hardware in the complicated conditions mentioned, such as data memory retention for long periods of time.
2.3. Technologies for Identifying Pipes
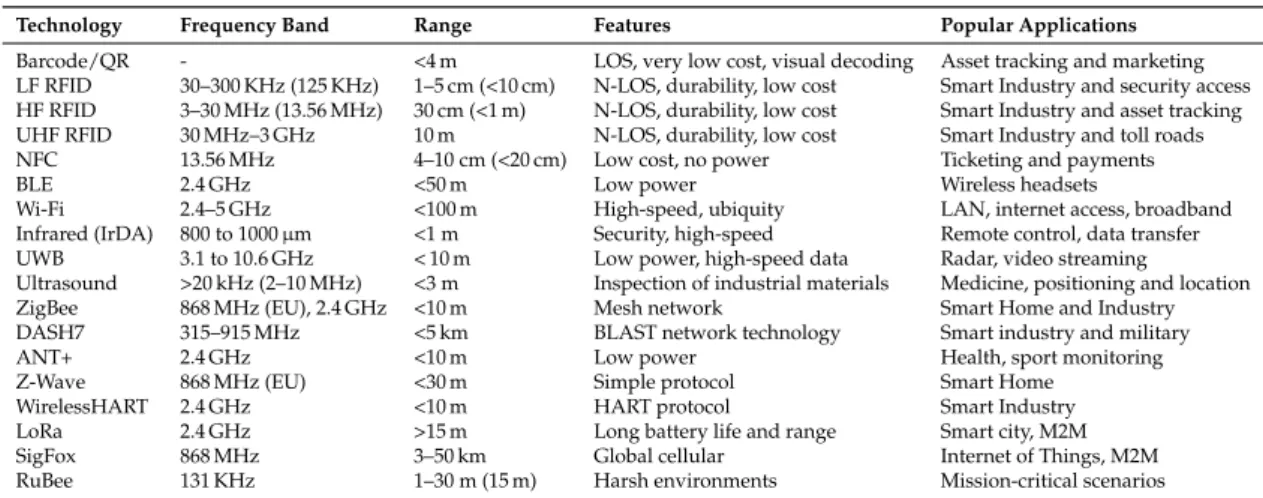
This subsection analyzes different technologies that can perform pipe identification and monitoring in a workshop. Only the most relevant tag-based identification technologies are cited, but other approaches (e.g., dead reckoning or image-based technologies) are available. The technologies selected are described briefly to indicate their general characteristics, before being analyzed and compared in Section3.3.1. A summary of the basic characteristics of the technologies is shown in Table1.
Table 1.Main characteristics of the identification technologies selected.
Technology Frequency Band Range Features Popular Applications
Barcode/QR - <4 m LOS, very low cost, visual decoding Asset tracking and marketing LF RFID 30–300 KHz (125 KHz) 1–5 cm (<10 cm) N-LOS, durability, low cost Smart Industry and security access HF RFID 3–30 MHz (13.56 MHz) 30 cm (<1 m) N-LOS, durability, low cost Smart Industry and asset tracking UHF RFID 30 MHz–3 GHz 10 m N-LOS, durability, low cost Smart Industry and toll roads NFC 13.56 MHz 4–10 cm (<20 cm) Low cost, no power Ticketing and payments
BLE 2.4 GHz <50 m Low power Wireless headsets
Wi-Fi 2.4–5 GHz <100 m High-speed, ubiquity LAN, internet access, broadband Infrared (IrDA) 800 to 1000µm <1 m Security, high-speed Remote control, data transfer UWB 3.1 to 10.6 GHz < 10 m Low power, high-speed data Radar, video streaming
Ultrasound >20 kHz (2–10 MHz) <3 m Inspection of industrial materials Medicine, positioning and location ZigBee 868 MHz (EU), 2.4 GHz <10 m Mesh network Smart Home and Industry DASH7 315–915 MHz <5 km BLAST network technology Smart industry and military
ANT+ 2.4 GHz <10 m Low power Health, sport monitoring
Z-Wave 868 MHz (EU) <30 m Simple protocol Smart Home
WirelessHART 2.4 GHz <10 m HART protocol Smart Industry
LoRa 2.4 GHz >15 m Long battery life and range Smart city, M2M
SigFox 868 MHz 3–50 km Global cellular Internet of Things, M2M
RuBee 131 KHz 1–30 m (15 m) Harsh environments Mission-critical scenarios
are devices that translate optical impulses into electrical signals, so it is essential to place the code so that good visibility and readability are achieved. The usual reading distance is tens of centimeters, although there is specialized equipment that can reach several meters.
There are two types of barcodes: linear and two-dimensional codes. Linear codes represent alphanumeric information (e.g., Code 39, Code 93) or numbers (EAN, European Article Number). Two-dimensional codes are able to encode more information per unit of area than linear codes. An example of two-dimensional codes are QR (Quick Response) codes, which were originally designed for the Japanese automotive industry. The code consists of black squares distributed through a grid with white background that can be read by an optical device. Large boxes at the corners allow to detect the code position, having a fourth one for the alignment and orientation.
QR code reading distance depends on the size of the code: increased distances are obtained thanks to increasing QR code size in proportion. It is usually assumed that code size has to be one tenth of the reading distance (for instance, if a code has to be read at about 20 m, it should have a size of at least 2 m). Regarding the storage capacity of a QR code, it depends on the type of data encoded, the version, and the error correction level.
Besides the automotive industry, it is easy to find nowadays QR codes applied in other fields. For example, a QR code traceability system for mitigating food supply chain risks is described in [23]. Another identification technology that has experienced a huge growth in the last years is RFID (Radio Frequency Identification). Such a technology consists of readers and electronic tag (also called transponders). These tags are very low power components that react to waves emitted by radio readers by providing the stored information.
RFID systems are usually classified according to two characteristics: their frequency of operation and the way they are powered. Depending on the frequency, RFID systems may be classified in radio bands. Each band differences from the others in its propagation behavior and spectrum regulations. There are three main RFID bands:
• LF (Low Frequency) RFID. According to the ITU (International Telecommunications Union), the LF band goes between 30 KHz and 300 KHz. Frequency and power in this band are not regulated globally in the same way: most systems operate at 125 KHz, but there are some at 134 KHz. The reading range provided is short (between 1 and 5 cm and, generally, up to 10 cm), so, in practice, LF devices are not usually sensitive to radio interference. The most popular LF RFID applications are access control and animal identification (mainly for pets and livestock). They can be used for communications in harsh environments (presence of metals and liquids) due to their long wavelengths. However, they present low reading speeds and they are not recommended for environments where many tags are together in a small space.
• HF (High Frequency) RFID. Although the HF band goes from 3 MHz to 30 MHz, most systems operate at 13.56 MHz. HF systems can reach a reading distance of up to 1 m (they usually reach roughly 30 cm), what can lead to interference and to the implementation of MAC (Medium-Access Control) mechanisms. This sort of RFID systems is massively used in transportation, payment, ticketing, and access control. HF systems present more interference than LF in unfavorable environments, but they allow for a larger reader range, more speed, and more space for information.
All these RFID systems can be also classified according to the way the tags are powered: • Passive systems. They do not need internal batteries to operate, since they rectify the energy sent
through the reader’s antenna. There are passive LF, HF, and UHF systems, which nowadays can be easily read at a 10-m distance.
• Active systems. They include batteries, what allow them to reach further distances (usually up to 100 m). Due to power regulations, almost all active systems operate in the UHF band.
• Semi-active, semi-passive or BAP (Battery-Assisted Passive) systems. They decrease power consumption by using batteries just for powering the tags for certain functionality. Commonly, batteries are used to power up the basic electronics, while the energy obtained from the reader is used for powering the communications interface. Tags have a battery to power part of the circuitry, thus, they are more reliable than passive, but require more maintenance.
As it was mentioned, RFID has been used previously for identifying and tracking items in different industries. For instance, an example of a RFID-enabled real-time manufacturing execution system is presented in [24]. There the authors describe devices that are deployed systematically to track manufacturing objects and that collect real-time production data. The paper also details a case study with a company that manufactures large-scale and heavy-duty machinery, whose efficiency (planning and scheduling decisions) is evaluated with real-life industrial data. Other applications of RFID include tracking protective equipment [25], appliances [26], or maritime freight containers [27].
NFC (Near-Field Communication) is a technology that evolves from RFID. NFC devices can be passive (tags) or active (for example, smartphones). The technology operates at 13.56 MHz, with a power that allows for the communication between elements at a distance of less than 20 cm. Different authors have studied the use of NFC for identification and positioning. A good example is described in [28], where it is proposed a navigation system for identifying and tracking tags indoors, where there are no GPS signals available.
Bluetooth Low Energy (BLE), also known as Bluetooth Smart, is a Wireless Personal Area Network (WPAN) technology oriented to short-range applications (around 10 m) and small devices that is optimized for energy efficiency. It works at 2.4 GHz, sharing the frequency band with other technologies like Wi-Fi. Bluetooth is not designed for a particular application: it defines a series of profiles representing a default solution for a particular use and establishes the requirements for interoperation between devices. Each Bluetooth device can support one or more of these profiles, being the most common the ones that establish links between devices and send data between them. Such devices include beacons (devices that broadcast certain information periodically), which serve as a reference in an indoor location scenario. An example of the use of beacons for tracking is detailed in [29]. The authors describe a real-time simulator using workers’ position data to support manager’s decision making in a manufacturing system. In such a system, BLE beacons are used to collect data easily in an experimental manufacturing line.
Similarly to Bluetooth, Wi-Fi (IEEE 802.11 a/b/g/n/ac) is also a widespread and popular technology. It may work at 2.4 GHz or/and 5 GHz. Due to its popularity, many researchers have studied its use for providing location and tracking services. There are several techniques for indoor location over Wi-Fi, which are based, in general, in determining the position of the clients respect to the access points using the angle or the time of arrival of the signals [30], the RSSI (Received Signal Strength Indicator) [14] or fingerprinting [31].
Ultrasounds have also been used extensively for positioning and tracking. As its name implies, ultrasounds are sound (mechanical) waves whose frequency is above the threshold of human hearing. Ultrasonic sensors are devices capable of converting sound signals to electrical signals. These devices operate like radar or sonar, evaluating the echo produced by the waves to estimate the distance between the reader and objects. A good overview of indoor ultrasonic positioning systems can be found in [33].
One of the latest technologies that can be applied to identification is Ultra-Wide Band (UWB). UWB is a short range radio technology that allows for the transmission of large amounts of information over a wide spectrum of frequencies, achieving a very low power density and very short duration pulses. A detailed review of UWB indoor positioning systems and algorithms is provided in [34].
ZigBee can be also used in positioning and tracking applications. ZigBee is a technology for creating low-power and low-cost wireless sensor networks. It is able create mesh networks of intermediate devices that allow for achieving large coverage distances. All ZigBee devices are designed for low consumption and high security (encryption). ZigBee transmission rate depends on the operating frequency, which may differ among regions, varying between 20 kbits/s and 250 kbits/s. An example of the use of ZigBee in smart manufacturing is provided in [35]. There the authors described a system that uses RFID devices as data collectors and a ZigBee wireless network to serve as the communication system to transmit the data to the different levels of the enterprise management.
DASH7 is a standard evolved from RFID that provides long range wireless communications and which is designed for low power applications that require low bandwidth (up to 200 kbits/s). It works at frequencies between 315 MHz and 915 MHz, and allows for the connection with objects on the move. In the literature there are not many well-documented DASH7-based developments. An exception is [36], where it is analyzed the DASH7 Alliance Protocol v1.0 specification and two practical applications are detailed: bird tracking and a greenhouse monitoring application.
ANT+ is a subsystem of the ANT base protocol (a technology designed for wireless sensor networks, similar to BLE, but oriented to the use with sensors) that defines a protocol stack that allows for the operation in the 2.4 GHz band. It is designed for interoperability and data transfer over a network. Most ANT+ developments are related to fitness and healthcare. An example is detailed in [37], where it is studied mobile health monitoring systems in elderly patients. Such a paper proposes a proof of concept solution that allows patients to measure their weight and blood pressure with ANT+ sensors connected to their Android smartphones.
Z-Wave is a specification for wireless communications oriented to home automation. Its aim is to minimize the consumption of the devices to make it suitable to use batteries, reaching transmission speeds of up 100 kbits/s. It works in the frequency rage around 900 MHz and it has a theoretical range (in open space) of up to 100 m. Z-Wave creates a mesh infrastructure with at least one controller and an end device. No academic sources that propose a Z-Wave based system for identification or tracking were found.
WirelessHART is a wireless technology based on HART (Highway Addressable Remote Transducer Protocol). HART is the implementation of a protocol of industrial automation. This wireless technology works in the 2.4 GHz band, creating networks through a mesh architecture capable of self-organization. An example of the use of WirelessHART in a CPS system can be found in [38], where it is presented a system simulator to evaluate the performance of wireless real-time mesh networks.
Another long-range technology is SigFox, which is actually a telecommunications network that follows the style of cellular networks. It is designed to provide low cost and low speed transmissions. Being a network operated by a company, a subscription must be paid for its service that allows up to 140 messages per device per day, 12 Bytes per message and a transmission rate of 100 bits/s at 868 MHz. In [40] it can be found a good reference for understanding the insights on the application of SigFox in industrial applications.
Finally, RuBee (IEEE 1902.1) is a point-to-point wireless communication standard based on magnetic waves. It works in low frequencies (131 KHz), what implies that it has a long wavelength (around 2000 m) and a low transmission speed (1200 baud). Its main feature is that it does not use radio waves, but it emits magnetic waves, allowing for the communication in unfavorable environments (with the constant presence of liquid, metal, and NLOS (Non-Line-of-Sight) communications). By using such a low frequency, RuBee consumes little power (a tag may last between 5 and 15 years) with a range of up to 15 m. An example of an end-to-end asset visibility model for military logistics using RuBee is described in [41].
3. Design of the System
3.1. Operational Requirements of Smart Shipyard Pipes
The military [42–44] and mission-critical infrastructures [45–47] have unique operational requirements. Security [48,49], safety, robustness, interoperability challenges, as well as bureaucratic and cultural barriers, stand in the way of the broad adoption of new CPS and IoT applications [50]. Based on the study of the real shipyard environment described in the previous section, different research lines have been detected to improve the efficiency in the pipe processing chain and have a significant impact on the shipyard productivity. In this section, a set of operational requirements grouped by functionality are assessed in order to cover the scenario previously described.
3.1.1. Automating the Identification of the Pipes in the Workshop
Nowadays, the identification of pipes is performed manually, which means that operators have to spend part of their working time reading barcodes. This process requires direct Line Of Sight (LOS) between the reader, and the tag and it is susceptible to reading errors. Likewise, this approach is burdensome and poses risks due to human errors (it is susceptible of not being performed or being performed at incorrect time instants). Nevertheless, operators require information on how to process pipes, thus they have to perform their identification and read the information associated with each of them. The system proposed should allow for carrying out the identification of the pipes with the smallest possible error in order to avoid manual tasks from the operators involved in the process. Additionally, the system should offer the operators dynamic information about the work to be done on the pipe.
3.1.2. Location of the Pipes
The present system can determine the location of a pipe in the workshop visually or at the instants in which the quality control processes are performed by middle management. However, the remaining time the pipe is in an unknown position. This unawareness of the exact or approximate position of the pipes causes loss of time due to the seeking for pipes. The system proposed should locate in real or near-real time the pipes circulating in the workshop, not only the ones being processed, but also those that are stored. Thus, the system should trace and monitor in real-time the pipes within the workshop and the ones that left the manufacturing area.
3.1.3. Pipe Tracking
The aim of pipe tracking is to find a system that identifies a pipe during the production process. Today’s operation faces many demands, the pipes can be on the workshop for many years and they suffer from very aggressive processes (e.g., treatment with acids) during its manufacturing. Pipes are made of metallic materials and they are grouped on pallets in significant amounts (tens of units), which makes difficult their visual and/or electronic identification.
3.1.4. Optimization of the Manufacturing Time
In the shipyard it has been observed that the pipes manufactured in the workshop have different storage times: the oldest pipe may rust at the time of assembly, while others (most of them) show no signs of external corrosion. Knowing the real needs of demand for construction, or the available pipes and the workshop capabilities, enhances the storage times to avoid problems of excess of stock (i.e., space problems) and corrosion (e.g., rust). Thus, the system should minimize part stock time, and consequently, it should decrease the likelihood of exposure to external elements.
3.1.5. Route Optimization
Once created a visualization system for locating the pipes, it will be possible to improve the system’s capacity for providing additional recommendations thanks to the identification information and the location data collected. A good example is the optimization of routes for the transfer of pipes. For instance, given a pipe placed in the cutting area, it would be interesting to know what is the fastest route to move it to its storage spot in the dock. The ultimate goal is to optimize manufacturing and assembly times by obtaining the best routes for the transportation and final installation of the pipes. 3.2. Technical Requirements of Smart Shipyard Pipes
3.2.1. Hardware Requirements
This subsection reviews the main hardware needs focusing on the tagging system and on the concerns regarding the deployment.
Tagging System
Electronic tags require a number of features to optimize their performance in aggressive environments in terms of electro-magnetic propagation and exposure to external interference (i.e., shocks, hits, pressure, acids, high temperature liquids, among others). The following are the main constraints faced by an electronic tag-based system when operating in the shipyard scenarios previously described:
• Deployment. Tags are deployed on a workshop, where there are different areas (a detailed description of the workshop is given previously performed in Section1). In addition, it must be emphasized that tags should be as small as possible so as not to cause problems during the treatment and handling of the pipes.
• Presence of metals. In the workshop there are many metallic elements that originate signal reflections and interfere in RF communications in the HF and higher bands. Therefore, only technologies prepared to tolerate the presence of a significant level of metallic elements should be considered.
• Presence of water. Navantia’s pipe workshop is not particularly cold, but it is next to the sea, so humidity levels are relatively high (between 40% and 95%).
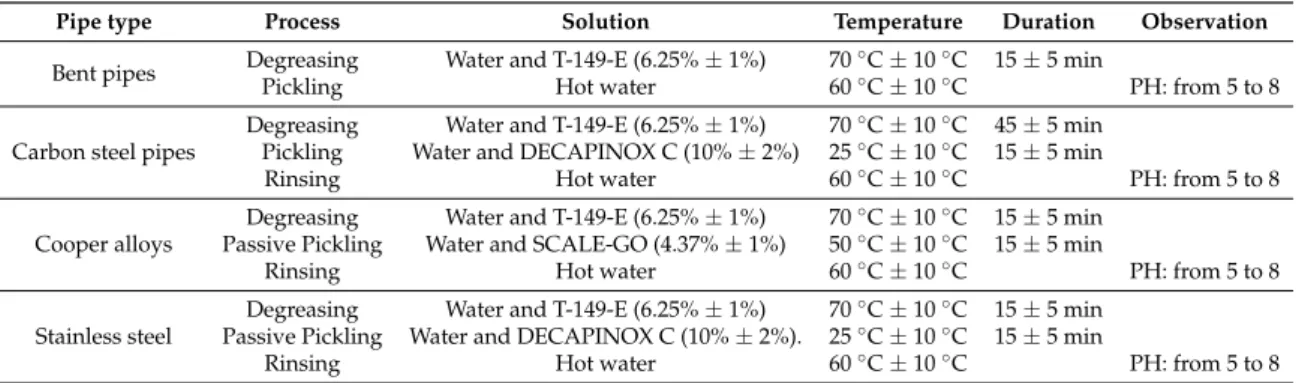
Table 2.Procedures for pipe cleaning.
Pipe type Process Solution Temperature Duration Observation
Bent pipes Degreasing Water and T-149-E (6.25%±1%) 70
◦C±10◦C 15±5 min
Additionally, the following situations should be considered:
– During cleaning, pipes might be exposed to pressurized water through a pressure washing machine.
– During testing, pipes could be also exposed to hot air, water and oil (in hydraulic systems). – If the tags do not support the aggressive processes described in Table2, it has to be considered
the addition of an external protection.
– The encapsulation of tags/readers must be able to resists acids, salinity, fuel and other substances that may corrode them.
• Potential communications interference. The technology selected must be able to transmit in the presence of the most common sources of electromagnetic interference (e.g., Wi-Fi, Bluetooth, the use of mechanical saws) and other unusual sources (e.g., radar tests, whose frequency ranges from tens of MHz to GHz, and their power can reach several KW).
• Reading distances. The monitoring system must be able to provide access to location data from a remote computer. Such identification/location information must be as accurate as possible, regardless of the distance required to read the pipes/pallets to be monitored. It is important to note that the workshop is 205 m long, so a network of readers would probably need to be created to cover the whole building.
• Tolerance to high temperatures. During manufacturing, pipes can be exposed to high temperatures in two processes: while washing them in water/acids, or during welding.
• Pressure. Both during the storage and the transfer of the pipes it is possible that they (and their tagging system) will be exposed to pressure due to the accumulation of weight and collisions. Pressure varies depending on the weight and strength supported by the base material. Note that, in general, between 30 and 35 pipes are moved into each pallet, and that such pallets support up to 2 T.
The following are the most common situations where external pressures are produced:
– When moving a pallet with other pipes on top. There is no standard criteria for stacking pipes, but, usually, the heaviest are placed at the bottom of the pallet.
– When lifting a block to its mounting position.
– During manufacturing, it may be necessary to round heads/ends, thus strokes can be applied, what involve deformations.
• Battery duration. Since pipes arrive to the workshop, up to three years may go by until they depart from the storage areas to be installed on a ship. Therefore, battery should last at least such a period of time.
Readers/Scanners Location
Readers should be located in places where there is access to both a data network and electricity. Similarly, those locations should be in places where they interfere the operator work as little as possible. • Electricity. The typical workshop usually has numerous electrical outlets in different locations,
thus it should not be a problem to power the hardware of the system.
• Data. Ethernet and Wi-Fi networks should be available to allow for receiving and sending data to the readers deployed. In Navantia’s workshop, while these networks are available in most of the workshop, the number of Ethernet sockets, except in certain locations, is scarce, and they are almost always associated to control equipment (e.g., the pipe storage robot or the bending machines). For such a reason, it is almost essential to place switches or hubs that allow for adding new Ethernet devices easily.
3.2.2. Software Requirements
The system should include the following basic functionality regarding user features:
• The system should display the location of the pipes in the workshop in real or near-real time. Ideally, the visualization should be implemented in a multi-platform system, which should allow for monitoring the whole workshop from a remote computer, a tablet, and even a smartphone. • Easy interaction with the basic pipe information. In addition to viewing pipes in a map, it is
desirable that users can access certain information about them.
• Filtering the pipes displayed. Once the system is operating, numerous pipes would be displayed while moving through the workshop. Therefore, it is convenient that a user can filter them in order to only show a specific pipe or a subset that meet certain criteria.
• The system should be able to issue different notifications about relevant events that happen in the workshop. For instance, a Business Intelligence (BI) module should issue a notification when a pipe goes from one workshop stage to another (e.g., from the cutting area to bending).
3.3. Selection of the Identification Technology
3.3.1. Analysis of the Technologies
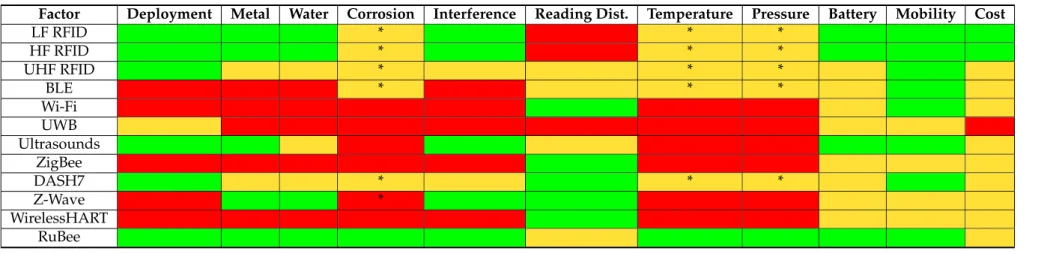
After exposing the requirements, the technologies best adapted to the application environment can be determined. A comparison that considers all the factors mentioned such as deployment, presence of metals, presence of water, exposure to liquids, acids, salinity, fuel or other corrosive substances, potential communications interference, reading distances, tolerance to high temperatures, pressure, battery duration, mobility, and cost, is shown in Table3.
At the view of the table, it can be observed that some of the technologies explained in Section2.3 can be directly discarded, since they do not fulfill any of the significant requirements of the system. The technologies that are fully compliant with the operational and technical requirements described in Sections3.1and3.2are in green color, the ones that partially fulfill the requirements are shown in yellow, and the non-compliant ones are colored in red.
Table 3.Comparison of the different identification technologies. Note that an asterisk means that custom tags available on the market are required. Color meaning: green (fully compliant with the operational and technical requirements), yellow (partial fulfillment) and red (non compliant).
Factor Deployment Metal Water Corrosion Interference Reading Dist. Temperature Pressure Battery Mobility Cost
LF RFID * * *
HF RFID * * *
UHF RFID * * *
BLE * * *
Wi-Fi UWB Ultrasounds
ZigBee
DASH7 * * *
Z-Wave *
3.3.2. Discussion
This subsection is focused on describing and choosing the technology more appropriate for automating the identification and location of the pipes in the shipyard workshop. First, a number of technologies were discarded following Table3, since they do not properly address some of the most relevant requirements of the system:
• LF and HF RFID: the reading distance they reach is not enough for building a ubiquitous real-time CPS system.
• 2.4 GHz RFID: due to its operating frequency, its performance decreases in the presence of metals, liquids, or the interference from other systems that work on the same frequency band.
• BLE and Wi-Fi: these technologies share operating frequency with the 2.4 GHz RFID, so they suffer from the same problems in terms of interference.
• ZigBee, Z-Wave, and WirelessHART. These technologies are aimed at creating sensor networks: their application in location is possible, but they are not suitable for the shipyard environment described in this paper. In addition, ZigBee and WirelessHART work in the 2.4 GHz band, which must be avoided.
Next, it is possible to discard technologies that, by their nature, they cannot be rejected at a first instance, but which pose risks:
• Ultrasounds. Its biggest disadvantage is the need for direct LOS between the reader and the tags. Although the frequencies used do not interfere directly with the test environment, they can interfere with sensor communications and/or armament of the ships, and even with marine animals.
• UWB. They obtain an excellent precision in location applications, but it is difficult to adapt to the shipyard environment described due to its short range and its problems with the presence of metal objects.
Finally, three technologies were chosen for their theoretical characteristics, and because they are suitable for the shipyard environment. These are:
• RuBee. It does not suffer from electromagnetic interference. Moreover, RuBee tags are designed to withstand adverse conditions and their battery lasts up to 15 years. It has been also tested in weapon control environments, where it was shown that its use is safe [51].
• DASH7/active UHF RFID. Both UHF RFID and DASH7 work in a frequency range to some extent sensitive to the interference present in the shipyard environment, but that it is slightly less aggressive than in the 2.4 GHz band. They have a theoretical reading distance of up to 100 m. • UHF RFID. As it has been already mentioned, the use of frequencies below 1 GHz decreases the
influence of the environment conditions. UHF technology has the advantage of having been tested thoroughly in location and tracking applications. In addition, tags are usually inexpensive. 3.4. Communications Architecture
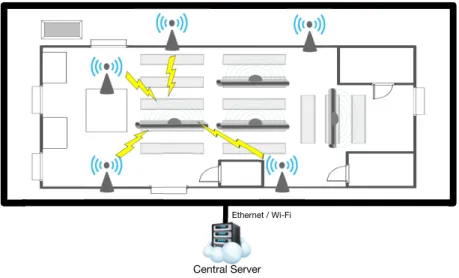
The communications architecture proposed relies on an infrastructure of beacons that identify pipes throughout different areas. Such an architecture is illustrated in Figure5.
Ethernet / Wi-Fi
Central Server
Figure 5.Communications architecture of the smart pipe system.
4. Implementation
In the previous Section it was concluded that there were three technologies with high potential to carry out the identification and location of the pipes: RuBee (IEEE 1902.1), DASH7 (active UHF RFID) and passive UHF RFID. After obtaining these conclusions, various suppliers of each of the technologies were contacted. In the case of RuBee an unexpected restriction arose: the only worldwide supplier refused to sell the hardware (as a distributor would do), because recently they had changed their business model (as of writing, they only sell completely closed projects, from design to implementation). Thus, the range of technologies was reduced to active and passive RFID.
4.1. System Modules
The system was designed assuming an RFID-based implementation and it consists of the software modules shown in Figure6. Such modules perform the following tasks:
• Location module: it is the core of the system. It obtains the coordinates of each tag after processing the signal strength.
• RSS acquisition module: it is the interface with the RFID readers. It allows for obtaining the signal strength from each tag.
• RSS collection module: it is in charge of storing the signal strength values in the RSS database. • Business Intelligence module: it decides which notifications should be launched depending on
the current position of a pipe, its historical position (where it has been in the past), and the states through which it has passed.
• Display module: it displays the positions of the pipes and the relevant notifications on a user screen. It allows operators to filter the pipes based on various parameters for easy viewing. • SAP/Manufacturing Execution System (MES) client: it allows for obtaining the data about the
characteristics of the pipes, which are stored in different remote repositories.
The processing and collection modules were implemented in the programming language Python. Django was used as a web framework and Nginx as a web server. The display module was implemented using websockets, Javascript, and jQuery.
There are also three databases that collect the information needed by the system (in the implementation presented in this paper, they all are SQLite databases):
• Pipe information database: it stores the information received about the pipes from third-party systems such as SAP or MES.
• Business intelligence rules database: it contains the necessary rules for the BI system to determine when to launch notifications.
Display Module Location
Module DatabaseRSS
RSS Collection
Module
Business Intelligence Module
BI Rules Database
Pipe Information Database
(Historical positions/states and cached information from SAP/MES) Notification
Client/Server
SAP/MES Client RSS Acquisition
Module
Figure 6.Modules of the smart pipe system proposed.
4.2. RSS-Based Location Techniques
This section describes the models and techniques used in the implementation of the Location module. Its experimental behavior will be analyzed in the tests performed in Section5. The algorithms include modeling RSS respect to the distance, a Kalman filter to reduce the noise, or spatial diversity techniques to increase RSS stability. Note that, in this paper, the term RSS is used instead of Received Signal Strength Indicator (RSSI): RSS is more generic than RSSI, which is commonly used for estimating signal strength in Bluetooth and Wi-Fi devices.
4.2.1. RSS Mathematical Model
RSS can be used to determine the location of each tag by relating it directly to the signal propagation. However, this method depends on the variability of RSS, which is influenced by obstacles and by the presence of metallic elements. In fact, indoors, the propagation of radio waves is mainly affected by two types of losses: the path loss and the losses due to small and large scale fading. Fading is usually associated with reflections, diffraction or absorption, commonly present in real environments. The small scale fading arises due to the multipath propagation effect, while large scale fading is related to the shadowing effect. From the RSS values it is possible to derive the mathematical model that allows us to relate them with the distance. The simplest approach is to average the RSS values for each distance. Another approach is based on the construction of a mathematical formula that model the system behavior. The proposed formula which closely reflects the path loss in the indoor environment is the log distance path loss model. This model can be seen as a generalization of both the free space propagation model and the two-ray ground propagation model. Thus, the behavior of the signal can be simplified through the following model [52]:
PL(d)[dB] =PL(d0) +10n log(d) +Xσ (1)
where:
• PL(d0)[dB] is the attenuation in decibels at a reference distance d0. Typically obtained through measurements.
• nis a calculated value that minimizes the Minimum-Squared Error (MSE) difference between the model and the empirical results.
• Xσis a Gaussian variable with mean zero and standard deviationσ.
Considering the model and using the RSS as inputs, the distancedcan be easily obtained with the expression:
d=10
RSS−RSSd0
10×n (2)
4.2.2. Kalman Filtering
The fundamental problem that faces the RSS indoors is the noise, which causes inaccuracies when determining the location. There are different methods to filter noise, among which it was chosen one that is popularly used for guidance, navigation and control of vehicles (mainly spaceships): the Kalman filter. A detailed explanation of how Kalman filtering works is out of the scope of this paper, but the interested reader can check [53] for a detailed description of the theory behind it. For the experiments shown in Section5, Kalman filtering was adapted to reduce noise on RSS, based on the work described in [54].
First, it should be clarified that a regular Kalman filter assumes that its model is linear (there is an extended version for non-linear models), so the transition from the current state to the next state should be performed through a linear transformation. Hence, it can be formulated first the general Kalman filter expression for a transition:
xt= Atxt−1+Btut+et (3)
wherextand (xt−1) are the current and previous states, respectively,Ais a transformation matrix,utis a control input,Bis the control input model, andeis the noise.
This general expression can be simplified by assuming that pipes remain in specific places during the measurements performed. Thus, RSS is expected to be constant, having a varying contribution from the noise. Then, the control inpututcan be ignored and it can be assumedAtto be the identity matrix, what results in the following expression:
xt=xt−1+et (4)
Regarding the observation model, in general, it is expressed as:
zt=Ctxt+δt (5)
where C is a transformation matrix and δ the noise related to faulty measurements. Since RSS
observations and states are equal (RSS is estimated by using old RSS values), the transformation matrix C becomes the identity matrix, so the expression ends up being as follows:
zt=xt+δt (6)
Once transitions have been defined, the prediction step can be formulated. Such a step indicates what is expected for the next state without taking measurements into account. Since RSS is expected to be constant, the expression is simple:
µt=µt−1 (7)
In contrast tox, which is the true value,uis the value predicted.Σis the certainty of the prediction. Such a certainty depends on the previous certainty and on the noiseR. In addition, the bar overutand
Σtmeans that it is still needed to incorporate the information added by the measurement.
With the prediction estimateΣit is possible to calculate the Kalman gain, which is defined as:
Kt=Σt(ΣtQt)−1 (9)
whereQis the measurement noise. Then, the update step can be obtained, where it is calculated the predictionµand the certaintyΣ:
µt=µt+Kt(zt−µt) (10)
Σt=Σt−KtΣt (11)
From this equation it can be observed that, the larger the Kalman gain, the bigger the influence of the measurement on the estimation. In the same way, if the Kalman gain is low, it is trusted more the prediction than the measurement.
4.2.3. Spatial Diversity Techniques
Multiple-input Multiple-output (MIMO) technology offers substantial performance gains in wireless links [55]. Thanks to the use of multiple antennas for transmission and/or reception, the serious effects produced by fading on the RSS can be decreased. Likewise, it is possible to use spatial diversity to improve the stability of the mathematical model proposed thanks to the fact that there are several receiving antennas. To reduce the impairments caused in the signal by these environments, spatial diversity takes advantage of the fact that there exists a low probability of getting simultaneously a deep fading on all the signal paths. Then, assuming uncorrelated channels and using spatial diversity techniques, it is possible to combine the RSSs in such a way that the effects of fading and multipath can be reduced.
These techniques are based on the classic algorithms of combination and selection, typically used in systems that try to increase the capacity or to stabilize the signals received. Although in this article the same names as the ones used in the traditional algorithms are used, this is not totally precise, because the implementations made are adapted to the RSS parameter [56], modifying the principles of the classic schemes, which are focused on data processing.
Combination Methods
• Equal Gain Combiner (EGC). This method weights equally all the antennas, performing the average of all the RSSs, following the equation:
EGC= 1
whereNis the number of antennas andRSSiis the level of received signal for thei-th antenna. For the sake of clarity, in the curves shown in the experiments section, the term “Mean” was used instead of “EGC”, but its computation is identical.
• Maximum-Ratio Combiner (MRC). Unlike EGC, this method weights each RSS depending on its signal quality. That is, it gives more weight to the most positive RSSs than to the lower ones. To carry out this computation the following expression was chosen:
MRC=
Selection Methods
• Selection Combiner (SC). This technique consists in sorting the available measurements from higher to lower, choosing only one value. The aim of this method is to achieve the best RSS level for each instant, without considering the RSS fluctuations. In practical applications, the highest value is usually chosen, which is the criterion used in the implementation evaluated in the Experiments Section.
• Switch-and-Stay Combiner (SSC). This algorithm first chooses one antenna, through which the RSS is received until it falls under a threshold, which has been previously set. In that moment, the algorithm switches to the next antenna without verifying its RSS. There exists the possibility of changing the threshold dynamically, but in the present paper it is only considered the case when the threshold remains constant. It is important to emphasize that the switching between antennas is performed in a blind way, so it is not guaranteed to get a better RSS with the switching. Without a doubt, the most important issue for this method is the calibration of the optimum switching threshold. To carry out this task, the optimum threshold was decided according to an estimator of the signal dispersion. Specifically, in the experiments, the threshold was set depending on the signal variance.
• Scanner Combining (ScanC). This method is similar to SCC, but instead of making a blind switching when the threshold is exceeded, it checks each antenna until it finds one over the threshold. If there are not any antennas above the threshold, the method keeps on using the same antenna. Like with SCC, the value of the switching threshold is very important, because it decides the system behavior. Besides, as in the SCC algorithm, during the experiments, it was considered a switching threshold that minimizes the variance.
5. Experiments
This Section presents the results of several tests conducted to validate the technologies selected and the CPS software developed. Regarding the tests, they were performed to determine which of the two technologies selected, passive and active RFID, adapted better to the peculiarities of the environment and the characteristics of pipe workshop.
5.1. Selected Hardware
Based on the requirements enumerated in Sections3.1and3.2, the most promising readers and tags for both technologies were selected. They are described in the next subsections.
5.1.1. Passive RFID Hardware
The passive UHF reader selected was a Speedway Revolution R420 from Impinj (Seattle, WA, USA) [57]. The reader has connections for up to 4 antennas (four panel high-gain antennas were used during the tests) and the ability to exchange data via Ethernet, USB, RS-232, or a GPIO port. Reader data is accessed through its native REpresentational State Transfer (REST) Application Programming Interface (API). Similarly, a mobile reader (A6-UHF Long Range) based on Windows CE was chosen to provide mobile identification to operators [58].
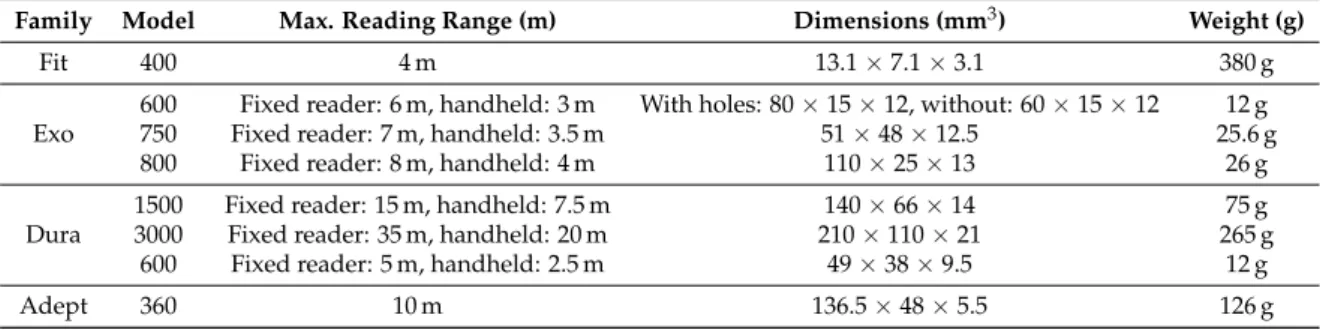
A wide range of tags allows for carrying out a reliable validation of the technology thanks to its diverse nature/objectives. Specifically, the following models from Omni-ID [59] were selected: Fit 400 UHF Tag on-metal, Exo UHF Tag on-metal family (Exo 600, Exo 750, and Exo 800), Dura UHF Tag family (Dura 600, Dura 1500, and Dura 3000), and Adept 360◦-ID UHF Tag on-metal. Its main physical specifications can be seen in Table4.
RFID tag capable of being read on, off, and near metal surfaces. Designed in a surprisingly small form factor, it features a rugged design for long term use outdoors and in industrial environments.
Table 4.Specifications of the passive Radio Frequency Identification (RFID) tags selected.
Family Model Max. Reading Range (m) Dimensions (mm3) Weight (g)
Fit 400 4 m 13.1×7.1×3.1 380 g
Exo
600 Fixed reader: 6 m, handheld: 3 m With holes: 80×15×12, without: 60×15×12 12 g
750 Fixed reader: 7 m, handheld: 3.5 m 51×48×12.5 25.6 g
800 Fixed reader: 8 m, handheld: 4 m 110×25×13 26 g
Dura
1500 Fixed reader: 15 m, handheld: 7.5 m 140×66×14 75 g
3000 Fixed reader: 35 m, handheld: 20 m 210×110×21 265 g
600 Fixed reader: 5 m, handheld: 2.5 m 49×38×9.5 12 g
Adept 360 10 m 136.5×48×5.5 126 g
In the Omni-ID Dura family, Dura 600 is a small form factor RFID tag, with extreme impact resistance, and superior on-metal performance. Omni-ID Dura 1500 is a durable and long range tag. Designed with heavy industry in mind, it features extreme impact resistance and high temperature ratings. Omni-ID Dura 3000 is designed for heavy industry and outdoor applications. Its features include high impact resistance, water proof, and a durable case (it is optimized for tracking large assets in open storage environments, without worrying about batteries).
The Omni-ID Adept 360◦is an UHF RFID tag for the harshest environmental applications. The tag is encased in an industrial steel frame with a tether attachment designed to meet the needs of heavy industry applications.
5.1.2. Active RFID Hardware
The active reader chosen was NPR ActiveTrack-2 [60], that, according to the manufacturer, has a coverage radius of 45 m with standard antennas. High gain antennas were acquired to extend its coverage to about 90 m.
Different tags can be used with the chosen reader (i.e., different sizes, different features). Among all the models, the Active RuggedTag-175S [61] was chosen, since it is designed to stand aggressive environments and is sonically welded (what helps to resist the effects of maritime environments). According to the manufacturer, its lithium CR2032 battery lasts more than 4 years. Its dimensions are 63.75×37.72×25.4 mm3and a weight of 51 g.
5.2. Test Methodology
The tests were conducted with the readers inside Navantia’s pipe workshop. These tests were focused primarily on assessing the most favorable cases for determining how far RFID tags can be read in the best case scenario: if the results for the best case are not as good as expected, then, obviously, the system will perform worse in more complex situations.
Two different kinds of experiments were performed. First, it was obtained the maximum reading distance, taking diverse factors into account (e.g., the type of tag, the number of reading antennas, type of antennas, or the shape of the antenna array). The second kind of experiments were associated with obtaining a mathematical function that relates signal strength with distance in order to locate accurately the tags.
5.3. Passive RFID Tests
5.3.1. Maximum Reading Distance
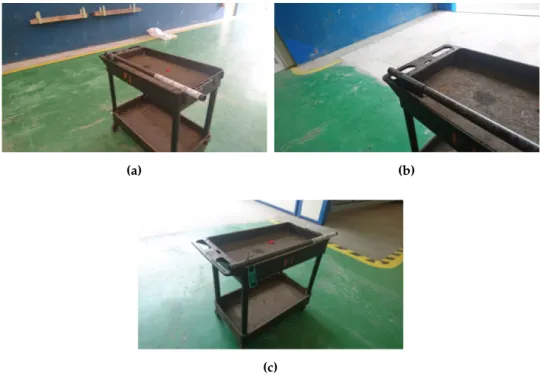
antennas). Specifically, these tests were carried out in a side of the pipe workshop, taking advantage of its width (about 17 m). At one end of the workshop, the passive UHF reader was placed with their antennas and a pipe of 31 mm diameter with the different tags adhered was placed in a wheel cart.
The layout of the different elements used in the measurements can be seen in Figures7and8. In these first measurements, which were focused on the determination of the maximum reading distance, only two antennas were used. When tests were performed to include spatial diversity, four antennas were used (with more antennas distributed over the reading area, it is more likely to capture the signal or some reflections). Thus, on the left of Figure9it is shown the system while capturing with an array of four antennas.
Table5shows a summary of the reading distances achieved when reading the passive tags selected at different distances through the two panel antennas. The distances at which a good percentage of the readings is achieved (i.e., when readings are obtained more than 95% of the time) are colored in green. The distances where no readings were obtained, or where a reading was achieved sporadically, are in red. Table5allows us to conclude that Exo 800, Dura 1500, Dura 3000 and Adept 360◦are the tags that can be read further. However, Dura 3000, and Adept 360◦have to be excluded from the final selection for this specific application: the former is so big (210 mm×110 mm×21 mm) that it would hinder the operator work on the pipe, while the latter has an inadequate form factor (it is designed to be hanged).
(a) (b)
Figure 7.Measurements with passive UHF reader with two antennas. (a) At 17 m; (b) At 2 m.
(a) (b)
(c)
Table 5.Reading distances achieved with the different tags.
Tag
Reading Distance
1 m 2 m 3 m 4 m 5 m 6 m 7 m 8 m 9 m 10 m 11 m 12 m 13 m 14 m 15 m 16 m 17 m
(a) (b)
Figure 9.Measurements with passive UHF reader with four antennas. (a) Linear array; (b) L-shaped array.
In the rest of the paper, for the sake of brevity, most of the curves represented will refer only to Exo 800 tags, since the conclusions draw from the experiments are identical to the ones obtained with the Dura 1500.
5.3.2. Improving the Antenna’s Reading Angle
The beam of the panel antennas of the UHF system is relatively narrow on purpose, in order to increase reading distance. However, in exchange, the maximum reading angle in which a tag can be read is reduced. To quantify such an angle, two antenna configurations were tested: a linear array (on the left in Figure9) and an ’L-shaped’ array (in Figure9, on the right). The study of the system coverage was performed for the two tags that offered a better balance between range and physical size (i.e., Exo 800 and Dura 1500).
Table6a shows the reading range for the Dura 1500 when using the linear array. Table6b shows the results of the experiment for the Exo 800 tag. In the horizontal axis of the table it is indicated the tag movement respect to the array of antennas, being 90◦the existing angle when facing the four antennas. The conclusions drawn are identical for both: it can be clearly seen that, when moving the tag to obtuse angles (between 90◦and 180◦), reading distance decreases. Some improvement in reading may be achieved at certain distances, but this is due to punctual reflections that occur in the specific location where the measurements were performed. Therefore, the table indicates that a configuration of antennas aligned obtains a good maximum distance as long as tags are located preferably frontwards, but, as the tag moves toward more obtuse angles (and similarly to more acute angles), the system loses much of its reading range. This means that the system would also work in places to control the movement of the tags through certain areas (for example, when moving from one room to another), but it would not work for a constant monitoring of all the workshop tags.
The results for the ’L-shape’ array are shown in Table6c: they show that, in exchange for losing reading distance (because two frontal antennas are used instead of four), the probability of the reading one side of the array is improved significantly.
5.3.3. Modeling RSS vs. Distance
As it was concluded previously, the two most promising tags are the Dura 1500 and the Exo 800 tags. It was evaluated their performance in a LOS scenario. Figure10shows the distribution of RSS (measured for this Figure and for the others presented in this paper in dBm) in relation to the distance when evaluating the Exo 800: it can be seen how the signal levels decline as the distance with the reader increases. From these RSS values it is possible to look for the mathematical model that allows us to relate them with the distance between the reader and the tag. Therefore, in order to determine the location of a pipe in the workshop, it has to be found a mathematical function that takes as an input the received signal level of a tag and that returns, as an output, the estimated distance to the reader.
1 2 3 4 5 6 7 8 9 10 11 12 13 14 15
Distance (m)
-110 -100 -90 -80 -70 -60 -50 -40 -30
RS
S
RSS Antenna 3 RSS Antenna 4 RSS Antenna 1 RSS Antenna 2
Figure 10.Exo 800: Received Signal Strength (RSS) for each antenna.