Fast and sensitive capillary electrophoresis method to quantitatively monitor ibuprofen enantiomers released from polymeric drug delivery systems / C Barbas [et al ]
9
0
0
Texto completo
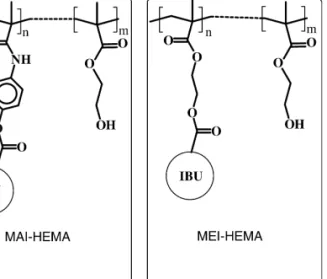
(2) 36. C. Simo´ et al. / J. Chromatogr. B 767 (2002) 35–43. high dose-dependent treatments, particularly in chronic diseases as rheumatoid arthritis. In this sense, several research groups have devoted attention to the preparation of polymeric devices bearing IBU covalently linked to the polymeric backbone and comonomeric hydrophilic components [1–7]. Enantiomers of IBU, like most non-steroidal antiinflammatory drugs, have been shown to possess different pharmacokinetic and pharmacological effects [8]. Concerning IBU, it has been described that the S(1)-enantiomer displays most of the anti-inflammatory activity [9]. In fact, S(1)-IBU is available in some European countries. However, the demonstrated unidirectional bioinversion of R(2)- to S(1)-IBU in vivo [10,11] maintains the usual administration of the racemate. Therefore, the evaluation of the enantioselectivity of a given IBU formulation or the controlled release of both enantiomers, together with the accepted bioinversion occurring in vivo, are important issues to address during the design of new DDS. In order to adequately address such issues, fine and quantitative analytical procedures have to be used for monitoring both the preparation of these devices and the satisfactory release of the drug. Capillary electrophoresis (CE) is a relatively new analytical tool that, due to its high efficiency and short analysis times, has been used for the separation of a huge variety of compounds [12]. The simplicity of this technique, together with its minimal operating costs and separation power have made CE an important tool in analytical laboratories. Among the numerous applications of this technique [12], CE has also been applied for quantitative evaluation of the simultaneous processes of drug liberation and polymer degradation during release studies using different DDS [13–16]. Moreover, CE has been shown to be well suited for enantiomeric separations of multiple compounds [17]. Therefore, it can be concluded that CE can be an adequate tool for the quantitative study of controlled release of IBU enantiomers from polymeric devices. The capability of CE to separate enantiomers of IBU has been extensively demonstrated [18–32]. However, for quantitatively monitoring the controlled release of the R(2)- and S(1)-IBU molecules from DDSs, several constraints have to be taken into account. First, the large number of samples and,. therefore, separations that have to be usually carried out in this type of drug-release studies (more than 200 separations in this work), which makes it advisable to develop a method as fast and inexpensive as possible. Secondly, the very low concentrations of the drug that are expected in such samples (i.e. usually few mg / ml), which makes it necessary to pay special attention to the sensitivity of the CE method. Thirdly, the possible interference in the separation due to the polymer matrix, the in-vitro medium used and / or its degradation products, which makes it necessary to find a selective CE procedure. In addition, apart from being fast, inexpensive, sensitive and selective, the reproducibility of the CE method has to be demonstrated prior to being used for quantitatively monitoring drug release. The goals of this work are, therefore: (a) to develop such a quantitative CE method, (b) to demonstrate that it can be used for monitoring the release of IBU from polymeric devices and (c) to analyze if such devices provide controlled release and / or enantioselectivity during the liberation of the R(2)- and S(1)-IBU forms.. 2. Experimental. 2.1. Chemicals The synthesis of the monomeric acrylic derivatives of IBU, precursors of the copolymeric structures drawn in Fig. 1, were carried out by well-known organic reactions [7]. In particular, N-h4-[2-(4-isobutylphenyl)propionyloxy]phenylj methacrylamide (MAI) and 2-[(4-isobutylphenyl)propionyloxy]ethyl methacrylate (MEI), were prepared in good yield by a sequence of two or three organic reactions (preparation of acid chlorides, esterification, amidation, etc.) under mild conditions to avoid the polymerization of the acrylic double bond. Details of the synthetic route for the specific compounds are described elsewhere [33,34]. 2-Hydroxyethyl methacrylate (HEMA) was purified according to the literature [35]. N,N-Dimethylformamide (DMF) was dried over anhydrous magnesium sulphate for 2 days and later with phosphoric anhydride overnight. After drying, DMF was distilled under reduced pressure of nitrogen. 2,29-Azobisisobutyronitrile was purified by.
(3) C. Simo´ et al. / J. Chromatogr. B 767 (2002) 35–43. 37. sponding non-solvent and dried at reduced pressure to constant weight.. 2.3. Plasma obtaining Blood from ether anaesthetized male Wistar rats weighing 250–300 g was collected by cardiac puncture and mixed with a 3.1% citrate solution as anticoagulant [10:1 ratio]. Plasma was separated by centrifugation of blood at 3000 rpm at room temperature and used immediately.. 2.4. In vitro release experiment. Fig. 1. Chemical structure of the copolymeric systems bearing ibuprofen used in this work.. fractional crystallization from methanol (m.p.5 1048C). All other chemicals were of analytical reagent grade and used as received. Dextrin 10 and bcyclodextrin from Fluka, 2-N-morpholino-ethanesulfonic acid (MES) from Sigma (St Louis, MO), 2-hydroxyethyl cellulose (HEC) (Mw av 90 000), phosphoric acid, boric acid and sodium tetraborate hydrate from Aldrich (Milwaukee, WI) were used for the CE running buffers at the different concentrations and pHs indicated. The buffers were stored at 48C and warmed at room temperature before being used. Acetonitrile, sodium dodecyl sulfate (SDS) and sodium hydroxide were from Merck (Darmstadt, Germany). Distilled water was deionized using a Milli-Q system (Millipore, Bedford, MA).. Films with an average thickness of 1 mm were prepared by casting from solutions of polymer in dimethylformamide / isopropanol (1:1) using Teflon moulds. Films were finally vacuum dried. Pieces of approximately 0.2 cm 2 of copolymer films were engaged in a polyester mesh and immersed in 1 ml of buffered solutions (20 mM sodium phosphate at pH 7.4 containing 2% of Tween) or plasma and incubated at 378C in a thermostated oven or in a Infors incubator shaker UNITRON, respectively; 50 ml of the buffer or plasma were collected at appropriate times and replaced by fresh medium. Buffer samples were directly injected into the CE system. Plasma samples (50 ml) were precipitated with 100 ml of acetonitrile, centrifuged at 15 000 rpm for 10 min and the supernatant injected into the CE instrument. The recovery of this procedure was the same for both IBU enantiomers and equal to 103% (%RSD n54 510.4%). All the samples were injected in triplicate in CE.. 2.5. CE conditions 2.2. Copolymerization The comonomers were polymerized at 508C in a thermostatic bath regulated with a precision of 60.18C, using 2,29-azobisisobutyronitrile as initiator ([I]51.5310 22 mol / l) and dimethylformamide as solvent ([M]51 mol / l) (M5monomer). The reactions were carried out in Pyrex glass ampoules over 5 h in a nitrogen atmosphere. The polymer was isolated by pouring the reaction mixture into a large excess of diethylether or methanol. The precipitated samples were filtered off, washed with the corre-. The analyses were carried out in a P/ACE 2050 (Beckman Instruments, Fullerton, CA, USA) CE apparatus, equipped with a UV–Vis detector working at 200 or 230 nm. Bare fused-silica capillaries with 50 mm or 75 mm I.D. were purchased from Composite Metal Services (Worcester, UK). Injections were made at the anodic end using N 2 pressure of 0.5 p.s.i. for a given time (1 p.s.i.56894.76 Pa). Before first use, a new capillary was preconditioned by rinsing with 0.1 M NaOH for 30 min. At the start of each day, the capillary was conditioned.
(4) 38. C. Simo´ et al. / J. Chromatogr. B 767 (2002) 35–43. by carrying out three consecutive separations of a standard dissolution containing racemic IBU. Between injections, the capillary was rinsed using different routines as indicated at each case. At the end of the day, the capillary was rinsed with deionized water for 5 min and stored overnight with water inside.. 3. Results and discussion. 3.1. Development of the CE method Although numerous methods have been proposed for the separation of IBU enantiomers [18–32], some of these methods had poor sensitivity [18,26,30], long analysis time [28,29], or were expensive protocols requiring coated capillaries and / or costly chiral selectors [20–26,29–31]. Moreover, except for one work [19], in the rest of the methods mentioned, the reproducibility of the CE separation of R(2)- and S(1)-IBU was not tested. Studies concerning reproducibility and quantification are scarce in CE chiral analysis, where the main efforts are put on the method development (i.e. to find a chiral selector, type of capillary, running buffer, etc., adequate to separate the enantiomers under study). Therefore, it seems interesting to pay some more attention to these less studied points. Different strategies were explored in order to find a reproducible CE method that can permit the quantitative analysis of released IBU enantiomers in. a fast, inexpensive, sensitive, and selective way (i.e. fulfilling the conditions imposed above). Initially, we developed a CE method based on that described from Rawjee et al. [28], but intending to reduce the long analysis time that their method required to separate IBU enantiomers (ca. 30 min). The effect of pH on the resolution of IBU enantiomers is shown in Fig. 2. After optimizing different separation parameters we arrived at the next separation conditions: bare silica capillary l d 520 cm, l t 527 cm (75 mm I.D.); separation voltage: 222 kV, detection at 230 nm using as running buffer: 200 mM MES with 15 mM b-CD and 0.3% HEC at pH 4.40 and 358C for temperature of separation. This optimization allowed us to obtain the separation of R(2)- and S(1)-IBU in less than 10 min. The threefold analysis time decreasing (from 30 to 10 min) is mainly due to the larger electric field, higher temperature and shorter capillary length used in our method. However, using this method the relative standard deviations (%RSD) for the analysis times of the R(2)- and S(1)-forms were in the same day (%RSD n56 ) equal to 6.9 and 7.3, respectively, and in three different days (%RSD n518 ) were 21.6 and 22.3, respectively. This low reproducibility is probably due to the different coverage of the capillary wall between injections provided by the HEC polymer, which modifies the electroosmotic flow value and, as a consequence, the analysis time of the solutes. Although different conditioning protocols and washing routines of the capillary wall were tested, the reproducibility between days did not improve sig-. Fig. 2. Effect of pH on R(2)- and S(1)-IBU resolution. Conditions: bare silica capillary with 40 cm of effective length (l d ) and 47 cm total length (l t ) (75 mm I.D.). Run voltage: 225 kV, detection wavelength at 230 nm. Injection at 0.5 p.s.i. for 2.5 s. Running buffer: 200 mM MES with 15 mM b-CD and 0.3% HEC at the indicated pH. Separation temperature: 238C..
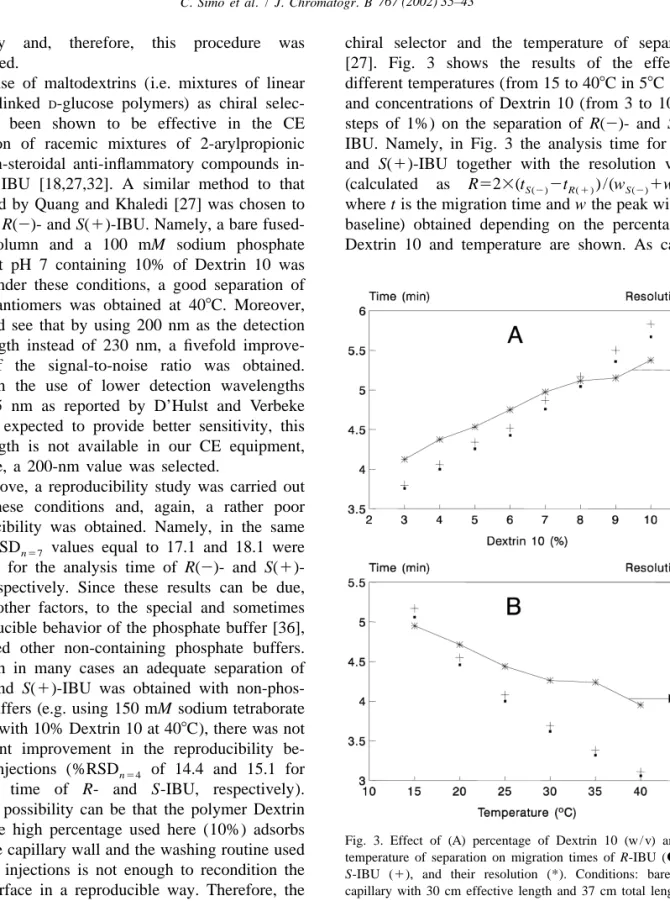
(5) C. Simo´ et al. / J. Chromatogr. B 767 (2002) 35–43. nificantly and, therefore, this procedure was abandoned. The use of maltodextrins (i.e. mixtures of linear a-(1-4)-linked D-glucose polymers) as chiral selector, has been shown to be effective in the CE separation of racemic mixtures of 2-arylpropionic acid non-steroidal anti-inflammatory compounds including IBU [18,27,32]. A similar method to that described by Quang and Khaledi [27] was chosen to separate R(2)- and S(1)-IBU. Namely, a bare fusedsilica column and a 100 mM sodium phosphate buffer at pH 7 containing 10% of Dextrin 10 was used. Under these conditions, a good separation of both enantiomers was obtained at 408C. Moreover, we could see that by using 200 nm as the detection wavelength instead of 230 nm, a fivefold improvement of the signal-to-noise ratio was obtained. Although the use of lower detection wavelengths (i.e. 185 nm as reported by D’Hulst and Verbeke [19]) is expected to provide better sensitivity, this wavelength is not available in our CE equipment, therefore, a 200-nm value was selected. As above, a reproducibility study was carried out using these conditions and, again, a rather poor reproducibility was obtained. Namely, in the same day %RSD n57 values equal to 17.1 and 18.1 were obtained for the analysis time of R(2)- and S(1)IBU, respectively. Since these results can be due, among other factors, to the special and sometimes irreproducible behavior of the phosphate buffer [36], we tested other non-containing phosphate buffers. Although in many cases an adequate separation of R(2)- and S(1)-IBU was obtained with non-phosphate buffers (e.g. using 150 mM sodium tetraborate at pH 9 with 10% Dextrin 10 at 408C), there was not significant improvement in the reproducibility between injections (%RSD n54 of 14.4 and 15.1 for analysis time of R- and S-IBU, respectively). Another possibility can be that the polymer Dextrin 10 at the high percentage used here (10%) adsorbs on to the capillary wall and the washing routine used between injections is not enough to recondition the inner surface in a reproducible way. Therefore, the use of different washing routines together with lower concentrations of Dextrin 10 added to non-phosphate buffers and temperatures was tested. The effect of temperature was also considered because there can be some relation between the concentration of the. 39. chiral selector and the temperature of separation [27]. Fig. 3 shows the results of the effect of different temperatures (from 15 to 408C in 58C steps) and concentrations of Dextrin 10 (from 3 to 10% in steps of 1%) on the separation of R(2)- and S(1)IBU. Namely, in Fig. 3 the analysis time for R(2) and S(1)-IBU together with the resolution values (calculated as R523(t S(2) 2t R(1 ) ) /(w S(2) 1w R( 1 ) ) where t is the migration time and w the peak width at baseline) obtained depending on the percentage of Dextrin 10 and temperature are shown. As can be. Fig. 3. Effect of (A) percentage of Dextrin 10 (w / v) and (B) temperature of separation on migration times of R-IBU (d) and S-IBU (1), and their resolution (*). Conditions: bare silica capillary with 30 cm effective length and 37 cm total length (50 mm I.D.). Separation voltage: 120 kV, detection at 200 nm. Injection at 0.5 p.s.i. for 1.5 s of 0.05 mg / ml of R- and S-IBU. Running buffer: (A) 150 mM sodium tetraborate at pH 9 with the percentages of Dextrin 10 indicated. Separation temperature: 208C; (B) 150 mM sodium tetraborate at pH 9 with 6% (w / v) Dextrin 10 at the temperatures indicated..
(6) 40. C. Simo´ et al. / J. Chromatogr. B 767 (2002) 35–43. seen, the higher the percentage of Dextrin, the higher both the resolution and the analysis time (Fig. 3A). Also, the lower the temperature, the higher are both the resolution and the analysis time (Fig. 3B). The use of a 150 mM sodium tetraborate buffer at pH 9, containing 6% of Dextrin 10 together with a separation temperature of 208C were chosen as adequate conditions in terms of speed of analysis (t,5 min) and baseline separation of R(2)- and S(1)-enantiomers of IBU (resolution.1.25). It is clear from Fig. 3 that if higher resolution or analysis speed is required, other more convenient percentages of Dextrin and / or separation temperatures can be selected.. 3.2. Some figures of merit of the CE method Using the mentioned separation conditions and washing the capillary between injections with 0.1 M NaOH (containing 50 mM SDS) and water, both for 1 min, and running buffer for 2 min, the reproducibility values given in Table 1 for the analysis time and peak area of R(2)- and S(1)-IBU were obtained. As can be seen, under these conditions the worst %RSD values for migration times and peak areas were of 0.45 and 3.09% respectively, which makes possible the use of this method with quantitative purposes in a reproducible way. The limit of quantification (LOQ) was established considering a signal-to-noise ratio of 4. Since the LOQ value and the enantiomers’ resolution were shown to depend in an inverse fashion on the injection time (data not shown), a time of 3 s was chosen as a good compromise. Under these conditions, successive dilutions of a racemic IBU standard dissolution were injected and the LOQ value determined to be 0.001 mg / ml for both R(2)- and. S(1)-IBU (corresponding to 20310 215 mol detected of each compound). Using the optimized CE conditions given in Table 1, calibration curves were obtained by injecting known concentrations of racemic IBU into the solvent used for in vitro assays (i.e. 20 mM sodium phosphate plus 2% Tween solution at pH 7.4, see Section 2.4). Calibration curves were attained after injecting for 3 s R(2)- and S(1)-IBU concentrations ranging from 0.001 to 0.04 mg / ml (n56) in triplicate. After least squares fitting, r 2 -values equal to 0.999 and 0.998 were obtained, respectively. These values allow us to carry out with confidence the quantitative monitoring of the in vitro release described below. In addition, the method provides efficiencies typically higher than 300 000 plates / m for both R(2)and S(1)-enantiomers in the concentration range (0.001–0.04 mg / ml) and injection times (1–3 s) tested. Moreover, resolution values higher than 1.2 are obtained under these conditions. This method also allows one the adequate determination of the so-called enantiomeric excess where stringent requirements have to be met, i.e. baseline separation at overload conditions together with low detection limits [19]. This method fulfils these requirements and allows the determination of 0.5% of the R(2)enantiomers in the presence of 99.5% of the optical antipode, as can be seen in Fig. 4.. 3.3. Following the release of IBU from polymeric DDSs ( in-vitro assays) In vitro experiments were performed at 378C using two copolymers of 2-hydroxyethyl methacrylate, HEMA, with two type of methacrylic monomers that incorporate in the side structure an aliphatic (oxy-. Table 1 Relative standard deviation values (%RSD) for analysis time and peak area obtained within the same day and four different days in the CE separation a of R(2)- and S(1)-IBU. Same day (n59) Four different days (n536). Analysis time %RSD values. Peak area %RSD values. R(2)-IBU. S(1)-IBU. R(2)-IBU. S(1)-IBU. 0.13 0.45. 0.13 0.45. 2.15 3.09. 2.63 2.67. a Separation conditions: Bare silica capillary with 30 cm effective length and 37 cm total length (50 mm I.D.). Separation voltage: 120 kV, detection at 200 nm. Injection at 0.5 p.s.i. for 1.5 s of 0.04 mg / ml of R- and S-IBU dissolved in 20 mM sodium phosphate buffer at pH 7.4 containing 2% Tween. Running buffer: 150 mM sodium tetraborate at pH 9 with 6% (w / v) Dextrin 10. Separation temperature: 208C..
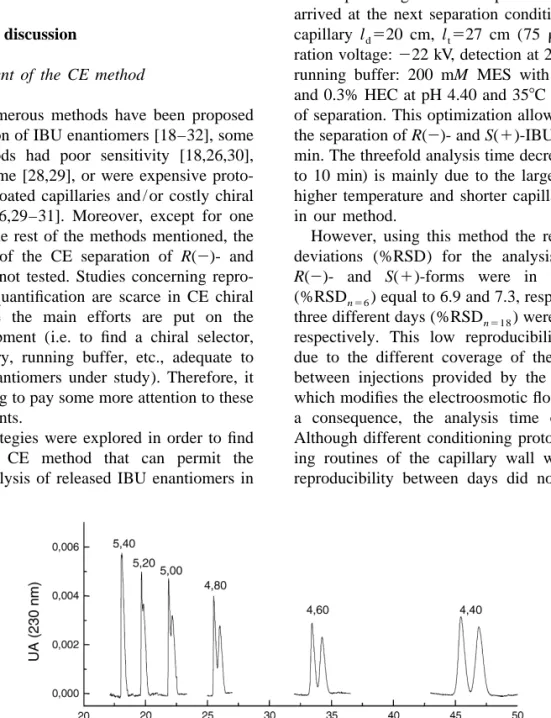
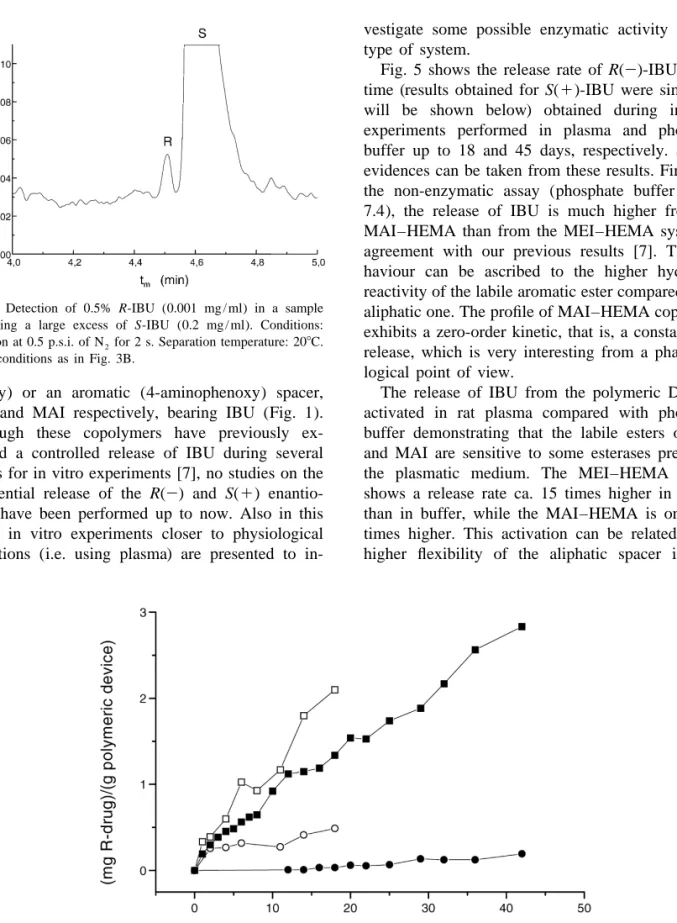
(7) C. Simo´ et al. / J. Chromatogr. B 767 (2002) 35–43. Fig. 4. Detection of 0.5% R-IBU (0.001 mg / ml) in a sample containing a large excess of S-IBU (0.2 mg / ml). Conditions: Injection at 0.5 p.s.i. of N 2 for 2 s. Separation temperature: 208C. Other conditions as in Fig. 3B.. ethoxy) or an aromatic (4-aminophenoxy) spacer, MEI and MAI respectively, bearing IBU (Fig. 1). Although these copolymers have previously exhibited a controlled release of IBU during several weeks for in vitro experiments [7], no studies on the differential release of the R(2) and S(1) enantiomers have been performed up to now. Also in this work, in vitro experiments closer to physiological conditions (i.e. using plasma) are presented to in-. 41. vestigate some possible enzymatic activity on this type of system. Fig. 5 shows the release rate of R(2)-IBU versus time (results obtained for S(1)-IBU were similar as will be shown below) obtained during in vitro experiments performed in plasma and phosphate buffer up to 18 and 45 days, respectively. Several evidences can be taken from these results. Firstly, in the non-enzymatic assay (phosphate buffer at pH 7.4), the release of IBU is much higher from the MAI–HEMA than from the MEI–HEMA system in agreement with our previous results [7]. This behaviour can be ascribed to the higher hydrolytic reactivity of the labile aromatic ester compared to the aliphatic one. The profile of MAI–HEMA copolymer exhibits a zero-order kinetic, that is, a constant drug release, which is very interesting from a pharmacological point of view. The release of IBU from the polymeric DDSs is activated in rat plasma compared with phosphate buffer demonstrating that the labile esters of MEI and MAI are sensitive to some esterases present in the plasmatic medium. The MEI–HEMA system shows a release rate ca. 15 times higher in plasma than in buffer, while the MAI–HEMA is only two times higher. This activation can be related to the higher flexibility of the aliphatic spacer in MEI. Fig. 5. Drug release given as (mg R(2)-IBU) /(g device) versus time for both copolymeric systems during in vitro assays at pH 7.4 and plasma. MAI–HEMA at pH 7.4 (j), MEI–HEMA at pH 7.4 (d), MAI–HEMA at plasma (h) and, MEI–HEMA at plasma (s)..
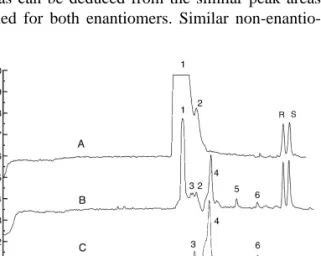
(8) 42. C. Simo´ et al. / J. Chromatogr. B 767 (2002) 35–43. compared to the aromatic residue in MAI where in addition the side chain is linked to the backbone by means of a rigid amide group. Therefore, it is clear that the steric hindrance associated with the enzymatic interaction with the polymeric DDS, influences noticeably in the release process of the IBU molecules. The adequate selectivity provided by the CE method can be deduced from Fig. 6, where some typical electropherograms of the R(2) and S(1) forms released from the MAI–HEMA system at pH 7.4 (Fig. 6A) and plasma (Fig. 6B), are shown. For comparison an electropherogram of a blank (obtained from rat plasma) is also given as Fig. 6C. Peaks 1 and 2 mainly contain the products of the polymer degradation (peak 1 of Fig. 6A also contains Tween); peaks 3, 4 and 6 are some impurities coming from the plasma, and peak 5 is probably a degradation product due to the action of plasma on the DDS. As shown, the procedure provides a good separation of the R(2)- and S(1)-IBU forms from these interferences. Also in Fig. 6, it is demonstrated that the release of ibuprofen from MAI–HEMA does not have enantioselective character for these highly hydrophilic copolymers with relatively low content in IBU, as can be deduced from the similar peak areas obtained for both enantiomers. Similar non-enantio-. selective release of IBU forms was observed with MEI–HEMA. Regarding this point, it is necessary to take into consideration that according to both the average composition of the copolymer systems analyzed here and the statistical distribution of MAI and MEI units in the corresponding copolymer systems, these units are isolated by long sequences of the hydrophilic HEMA comonomer. Therefore, the enzymatic behavior could also be related to the number of active units, their distribution and the polarity of the system. In this sense, we are now studying DDSs containing higher compositions of MAI and MEI units, which bring about much higher hydrophobicity. In such DDSs the influence of the stereoregularity R(2)- or S(1)- of the IBU residues and the stereochemical configuration of the comonomer units along the copolymer chains could influence the enantioselectivity of the IBU release. This study is in progress and the results will be the subject of a forthcoming paper.. Acknowledgements Financial support from the CICYT (MAT19980964-C02-01) is acknowledged.. References. Fig. 6. Release of R(2) and S(1)-IBU from MAI–HEMA system: (A) in 20 mM phosphate solution with 2% Tween at pH 7.4 for 8 days, and (B) in plasma for 17 days. (C) Electropherogram of a blank obtained from rat plasma extracted with acetonitrile (see Experimental). Separation conditions: Injection at 0.5 p.s.i. for 3 s. Other conditions as in Fig. 4.. ´ Rodrıguez, ´ [1] L.A. Garcıa H. Jick, Lancet 343 (1994) 769. [2] M.J.S. Langman, J. Weil, P. Wainwright, D.H. Lawson, M.D. Rawling, R.F.S. Logan, M. Murphy, M.P. Vessey, D.G. Colin-James, Lancet 343 (1994) 1075. [3] L. Sartore, I. Perone, P. Ferruti, R. Latini, R. Barnasconi, J. Biomatter. Sci. Polym. Ed. 8 (1997) 741. [4] S. Davaran, A.A. Entezami, Eur. Polym. J. 34 (1998) 187. [5] R. Cecchi, L. Rusconi, H.C. Tauzi, F. Danusso, P. Ferruti, J. Med. Chem. 24 (1981) 622. [6] C. Larsen, M. Johansen, Acta Pharm. Nordica 2 (1989) 57. ´ J. Controlled Release [7] A. Gallardo, C. Parejo, J. San Roman, 71 (2001) 127. [8] F. Jamali, W.I. Wainer (Eds.), Drug Stereochemistry, Marcel Dekker, New York, 1993, p. 375. [9] S.S. Adams, P. Bresloff, C.G. Mason, J. Pharm. Pharmacol. 28 (1976) 256. [10] R.D. Knihinicki, K.M. Williams, R.O. Day, Biochem. Pharmacol. 38 (1989) 4389. [11] N.M. Davies, Clin. Pharmacokinet. 34 (1998) 101..
(9) C. Simo´ et al. / J. Chromatogr. B 767 (2002) 35–43 [12] M.G. Khaledi (Ed.), High Performance Capillary Electrophoresis. Theory, Techniques and Applications, Wiley, New York, 1998. ´ Lemus, J. San Roman, ´ A. Cifuentes, [13] A. Gallardo, A. Rocıo ´ J.C. Dıez-Masa, Macromolecules 32 (1999) 610. ´ ´ P. Bermejo, M. [14] F. Fernandez, A. Gallardo, J. San Roman, ´ Rebuelta, A. Cifuentes, J.C. Dıez-Masa, Biomaterials 21 (2000) 915. ´ [15] A. Cifuentes, J.C. Dıez-Masa, C. Montenegro, M. Rebuelta, ´ J. Biomatter. Sci. A. Gallardo, C. Elvira, J. San Roman, Polym. Ed. 11 (2000) 993. ´ A. Gallardo, F. Fernandez, ´ [16] J. San Roman, A. Cifuentes, J.C. ´ ´ Dıez-Masa, P. Bermejo, M. Rebuelta, A. Lopez-Bravo, J. Controlled Release 72 (2001) 1. [17] K. Verleysen, P. Sandra, Electrophoresis 19 (1998) 2798. [18] A. D’Hulst, N. Verbeke, J. Chromatogr. 608 (1992) 275. [19] A. D’Hulst, N. Verbeke, Electrophoresis 15 (1994) 854. [20] S. Fanali, Z. Aturki, J. Chromatogr. A 694 (1995) 297. [21] S. Fanali, C. Desiderio, Z. Aturki, J. Chromatogr. A 772 (1997) 185. [22] A. Guttman, Electrophoresis 16 (1995) 1900. [23] Y. Ding, X. Zhu, B. Lin, Electrophoresis 20 (1999) 1890. [24] I. Bjornsdottir, D.R. Kepp, J. Tjornelund, S.H. Hansen, Electrophoresis 19 (1998) 455.. 43. ´ [25] M. Blanco, J. Coello, H. Iturriaga, S. Maspoch, C. PerezMaseda, J. Chromatogr. A 793 (1998) 165. ´ I.M. [26] F. O’Keeffe, S.A. Shamsi, R. Darcy, P. Schwinte, Warner, Anal. Chem. 69 (1997) 4773. [27] C. Quang, M.G. Khaledi, J. High Resolut. Chromatogr. 17 (1994) 609. [28] Y.Y. Rawjee, D.U. Staerk, G. Vigh, J. Chromatogr. 635 (1993) 291. [29] P. Sun, N. Wu, G. Barker, R.A. Hartwick, J. Chromatogr. 648 (1993) 475. [30] Y. Tanaka, N. Matsubara, S. Terabe, Electrophoresis 15 (1994) 848. [31] X. Zhu, B. Lin, U. Epperlein, B. Koppenhoefer, Chirality 11 (1999) 56. [32] H. Soini, M. Stefansson, M. Riekkola, M.V. Novotny, Anal. Chem. 66 (1994) 3477. ´ JMS Mater. Med. 9 [33] C. Parejo, A. Gallardo, J. San Roman, (1998) 803. ´ Polymer 34 (1993) 394. [34] A. Gallardo, J. San Roman, [35] R.J. Fort, T.M. Polyzoidis, Eur. Polym. J. 12 (1976) 685. [36] P. Gebauer, P. Bocek, Electrophoresis 21 (2000) 2809..
(10)
Figure
+2
Documento similar
The success of computational drug design depends on accurate predictions of the binding free energies of small molecules to the target protein. ligand-based drug discovery
In the previous sections we have shown how astronomical alignments and solar hierophanies – with a common interest in the solstices − were substantiated in the
± SEM, n=6) of healthy cells. C) Control and SCaMC-1-KD COS-7 and 143B cells are equally sensitive to 1 μM staurosporine induced cell death. Cells were treated with the drug for 0,
We compute the maximum of the condition numbers of the linear systems that appear in the application of the Steffensen method (4) (||A|| · ||A −1 ||) and the maximum of the
For calculating of the shallow geothermal potential with G.POT method for location 1 and 2, the BHE length required for heating and cooling modes to cover the H&C energy
No obstante, como esta enfermedad afecta a cada persona de manera diferente, no todas las opciones de cuidado y tratamiento pueden ser apropiadas para cada individuo.. La forma
without color information, with high spatial resolution (1 m pixel). The goal is to achieve a fused image containing both color information and high spatial resolution. This method
A simple, rapid, and sensitive method has been developed and validated for the simultaneous detection and quantification of a mixture of relevant contaminants in
