Carbures Europe, S A Economic and financial analysis
41
0
0
Texto completo
(2) ABSTRACT The objective of this work is to study the evolution of the economic and financial situation of the group Carbures Europe, S.A. and its subsequent diagnosis. The information contained in the drafting of the project can be useful for external agents who must make decisions regarding the project, such as investors, creditors, suppliers, lenders, etc. The study has been carried out mainly through the analysis of the balance sheet, the profit and loss account and the activity report of the group in the last four years: 2013, 2014, 2015 and 2016. Also to support the analysis ratios on profitability, liquidity, solvency and probability of bankruptcy of these years have been calculated and it has also been complemented with a small study of the evolution of the group's quotations in the Alternative Stock Market and the changes its relevant shareholders. Evidence found after the study has been carried out is that Carbures Europe, S.A. is an indebted company, yet investors are willing to take a high risk with the expectation of achieving large returns in the future.. 2.
(3) CONTENT ABSTRACT ..................................................................................................................... 2 EUROPE CARBURES, S.A. ...................................................................................... 5 HISTORICAL EVOLUTION OF CARBURES .......................................................... 7 ANALYSIS OF FUNDAMENTAL LIQUID ASSETS ............................................. 11 FINANCIAL STRUCTURE ...................................................................................... 11 Net Worth ................................................................................................................... 14 Non-current liabilities ................................................................................................. 16 Current Liabilities ....................................................................................................... 17 ECONOMIC STRUCTURE....................................................................................... 18 Non-current Assets ..................................................................................................... 18 Current assets.............................................................................................................. 19 PROFIT AND LOSS ACCOUNT .............................................................................. 19 Operating result .......................................................................................................... 20 Financial results .......................................................................................................... 22 Profit before tax .......................................................................................................... 23 Profit after tax ............................................................................................................. 24 FINANCIAL RATIOS .................................................................................................. 25 Profitability analysis ................................................................................................... 25 Liquidity and solvency analysis ................................................................................. 27 Bankruptcy analysis .................................................................................................... 29 SIGNIFICANT SHARES ............................................................................................ 30 EVOLUTION OF THE ASM QUOTATION ............................................................. 35 CONCLUSION ............................................................................................................. 37 REFERENCES ............................................................................................................ 38. 3.
(4) LIST OF FIGURES Figure 1: Comparative table of the economic structure. ................................................................... 12 Figure 2: Comparative table of net assets .......................................................................................... 15 Figure 3: Comparative table of non-current liabilities. ..................................................................... 16 Figure 4: Comparative table of current liabilities. ............................................................................. 17 Figure 5: Comparative table of the economic structure. ................................................................... 18 Figure 6: Comparative table of the profit and loss account. .............................................................. 20 Figure 7: Reports clipping: turnover evolution ................................................................................. 21 Figure 8: Reports clipping: evolution of the expenditure on provisioning........................................ 21 Figure 9: Reports clipping: evolution of personnel expenses............................................................ 21 Figure 10: Reports clipping: breakdown of financial expenses and revenues 2014 and 2013. .................................................................................................................................................. 22 Figure 11: Reports clipping: breakdown of financial expenses and revenues 2016 and 2015. .................................................................................................................................................. 23 Figure 12: Comparative table of profit before tax ............................................................................. 23 Figure 13: Comparative table of profit after tax ................................................................................ 23 Figure 14: Graph ROA and margin. .................................................................................................. 26 Figure 15: Graph: turnover ................................................................................................................ 26 Figure 16: Graph: ROE...................................................................................................................... 27 Figure 17: Table maneuver fund comparative. .................................................................................. 27 Figure 18: Comparative table of the current ratio ............................................................................. 28 Figure 19: Comparative table of the short-term debt ratio. ............................................................... 28 Figure 20: Comparative table of the long-term debt ratio. ................................................................ 28 Figure 21: Comparative table of the evolution of Z-Score. ............................................................... 29 Figure 22: Table relevant shares of 2012. ......................................................................................... 30 Figure 23: Table relevant shares of 2013. ......................................................................................... 31 Figure 24:Table relevant shares of 2014. .......................................................................................... 32 Figure 25: Table relevant shares of 2015. ......................................................................................... 33 Figure 26: Table relevant shares of 2016. ......................................................................................... 33 Figure 27: Table relevant shares of 2017. ......................................................................................... 34. 4.
(5) EUROPE CARBURES, S.A.. Europa Carbures, S.A. was established on November 28, 2002 as Easy Industrial Solutions S.L.. Years later, in 2011 merged absorbing the company Atlántica Composite, S.L., which carried out activities in the same sector: aeronautics. The current Carbures was created from the merger, and its fiscal residence and its place of business are both in El Puerto de Santa María, Cádiz.. According to the report published in the consolidated annual accounts for 2016, its corporate purpose “is to provide services and supplies of products to companies in the industry sector through knowledge management, the use of cutting-edge technology and processes of permanent innovation". Carbures is the dominant matrix of a group of 23 companies, which are distributed among different countries like China, Germany, Poland, USA, Mexico and Spain. Although it should be noted that the number of companies belonging to the group is not static, it changes from year to year: in 2015 the group was made up by 25 companies; in 2014 the companies that were part of the group were 31, and in the previous year 2013, the first year in which consolidated annual accounts were presented, there were 10 companies in the group.. Their mission statement, vision and values announced on the company's website are (mission) "to add value through technological innovation structures", (vision) "to be leaders in advanced technology for vehicle structures" and their Carbures brand values are compliance, ethics, proactivity and innovation.. The business lines developed by the group are related to the manufacture of parts and structures made of carbon fiber and other composite materials for the sectors listed below: . Aerospace and Defense: sector where Carbures began its activity and continues to produce parts for different kinds of aircrafts, both civil and defense. Serves companies like Airbus, Airbus Military, Boeing, Bombadier, Xcor and others.. . Carbures Engineering: allocated to the research and innovation of new technologies. Provides engineering services to equipment and systems with. 5.
(6) PECAL, CMMI and ISOS quality certifications, in addition to other standards issued by NATO, Ministry of Defense and the company Lockheed Martin. . Automotive: this line of business is developed mainly in the USA, manufacturing carbon fiber parts for automobiles, providing a competitive advantage as they are lighter, less polluting and more efficient vehicles.. . Civil works: in this sector produces structures of composite materials for the construction of buildings, bridges, towers, ports and parking lots among others.. . Rail: it is the last sector in which Carbures is involved, thanks to its acquisition of the Spanish company MAPRO. Thus, it has started building trains of all type of route, elevators, subways and trams.. The development of its own know-how and technology for industrial production is the competitive advantage that has allowed it to enter the wide range of sectors for which it works. At present Carbures has its own patents as RMCP —Rapid Multiinjection Compression Process—, RTM —Resin Tranfer Molding— and VARTM — Assisted Resin Tranfer Molding—, 20,000 square meters for manufacturing, 6 autoclaves, technology that allows to manufacture carbon fiber parts, more than 807 employees and 18 distributors in three continents, America, Europe and Asia.. As a note on the economic results that the group presented in 2016, the company has increased its turnover by 11 %, reaching a turnover of 72.4 million euros against the negative result with losses of 15.07 million euros. The closing price of the shares in the alternative stock market on June 12, 2017 has been Morningstar sets a market value of. 0.52€/share whereas. 0.63€/share, which is why according to the. independent financial analysis provider leader, the group is undervalued in the market.. 6.
(7) HISTORICAL EVOLUTION OF CARBURES. Below is a brief description of the milestones of the company, which also indicate the different stages of this group.. STAGE 1: RESEARCH GROUP (1999-2002). In 1999 a university spin off was born at the University of Cádiz. The university received a request from the multinational Airbus, previously known as CASA: the company required advice on some of the parts of its aircraft, in addition to solving inefficiencies in its production process. From this request a group of three academic experts and researchers put their knowledge in common giving rise to the spin off which became the starting point of the current Carbures.. STAGE 2: CREATION OF EASY INDUSTRIAL SOLUTIONS, S.L. (2002-2004). After three years of research, the innovation group took the first steps towards the business world, setting-up the company Easy Industrial Solutions at the end of 2002, thanks to the support of the University Foundation of Cádiz. The new company began to develop its technology-based activity at the Technological Center of Cádiz. Soon it underwent good results with which during its first year of life already had 15 employees. Its first services were for the aeronautical sector.. STAGE 3: CONSOLIDATION AND DEVELOPMENT (2005-2006). At this stage the company laid its foundations and began to create different lines to work the composite materials. In order to do this, it had to expand its facilities and move from the Technological Park in the bay of Cádiz to El Puerto de Santa María, where they initially had a 300 square meters industrial plant of where to produce goods and a 200 square meters mezzanine where to provide engineering services and business consulting. In 2006 they built a second 800 square meters plant for production.. 7.
(8) STAGE 4: EXPANSION (2007-2010). In this period the company plans to expand its business by creating new strategic business units and introducing its output in international markets. The four pillars in which the company sustained its expansion were: 1. Diversifying the sectors for which it produced, creating business strategy units in the transport and civil works sectors. 2. Promoting research on composite materials that could be applied to the civil engineering sector, building structures such as bridges, piers or walkways. 3. Seeking to position itself among the manufacturers of carbon fiber. 4. Beginning of international expansion within the aeronautical sector, analyzing the environment and designing possible strategies for entering the American and Chinese markets.. STAGE 5: FUSION OF ATLÁNTICA COMPOSITE AND ESTABLISHMENT OF EUROPE CARBURES (2011).. Atlántica Composite, S.L. developed its activity in the aeronautical sector. In 2008 it signed a transfer of land contract with the public company AENA, thanks to which it obtained 15,000 m 2 inside the airport of Jerez de la Frontera, certainly an strategic location to provide services to aeronautical companies.. In October 2011 Easy merged with Atlántica through the procedure for merger by absorption, so the whole Easy became the assets and legal entity for Atlántica Composite, SL. At the very same moment there was a transformation process for the company, and it changed its status from limited society to Stock Corporation, and it became Carbures, S.A. The company name is named after “CARBon structURES”.. The merger of both companies resulted in the synergy of both, positioning and consolidating their place in the aeronautical sector and multiplying by three the production capacity. This helped the company to achieve its goal: international expansion.. Another operation that helped the company expand was the creation of its subsidiary, American Carbures USA, which is established Florida’s coast and in the. 8.
(9) coast of Washington’s coast. Also joining this is the beginning of a joint venture with a Chinese partner with the aim of creating an Asian subsidiary Carbures China.. STAGE 6: ALTERNATIVE STOCK MARKET ENTRY (2012).. On March 23, 2012 Carbures was admitted to trading on the ASM with a shares exit price of € 1.08 per share. The ASM is a multilateral trading system aimed at small cap companies that have financing needs to meet their expansion target. Within this framework, the system offers them regulation that can be translated into security and lower costs that are adapted to the conditions of medium-sized enterprises.. The reasons that the company exposed to justify its desire to contribute in the ASM were: 1. Natural step in the growth process of any company. It provided transparency and recognition to society in order to compete in international markets. 2. Making its leadership position visible in the production of carbon fiber and composite. 3. Strengthening the brand Carbures abroad. 4. Starting an approach strategy towards other companies of the sector in order to expand markets and attract new clients. 5. Increasing the Company's own funds. STAGE 7: SUSPENSION OF THE LISTING (2014).. On October 8, 2014, the National Securities Market Commission suspended the Carbures listing at ASM after PricewaterhouseCoopers (PwC) auditors showed concern about the authenticity in the formulation of the annual accounts, because they considered that they had recorded revenues and profits that did not correspond to the group but to other companies belonging to the technological cluster established in El Puerto de Santa María. The newspaper La Expansión Digital published on November 30, 2014 an interview with two of the most important board members of Carbures, Rafael Contreras and José María Tarragó, in which both recognized that "it is true that there have been accounting errors in Carbures, but in no case there are any irregularities".. 9.
(10) On January 5, 2015, the company re-listed in the ASM after the reformulation of the accounts on request of its own board of directors. In the new accounts the company admitted 6 million euros losses in the first quarter of 2014 and also corrected the benefit given in 2013 of 4.7 million euros to 1.9 million euros. This mistake had an impact on its listing: at the close of trading on October 8, 2014, the day of the suspension of the listing, shares were trading at 5.32 and when there reentered the stock market they tumbled to 1.8 €/share: they were worth 66 % less than the day before the suspension.. 10.
(11) ANALYSIS OF FUNDAMENTAL LIQUID ASSETS. At this point, we will examine and comment on equity weightings by comparing the amounts that have accrued Europe Carbures' financial statements over the last four years: 2016, 2015, 2014 and 2013, which are the fiscal years used to analyze the financial situation of Carbures. The documents that have been used are the balance sheets, profit and loss accounts, all of them consolidated, their corresponding reports and the relevant facts published on the ASM website. As some data to take into account, the company began to fill the consolidated financial statements as of 2013, reason why the years chosen to carry out this study are the most coherent, since they are the most recent and can be compared with more precision due to their similarity. The tool used to analyze the liquid assets has been vertical percentages and horizontal percentages.. The vertical percentages show the proportion that each item represents of the total of the assets or the liabilities. And in the profit and loss account they reflect the proportion of each income or expense in turnover or sales.. The horizontal percentages show the proportion in which each item has changed compared to the previous year or any other year to be compared. It is used both for the analysis of the balance sheets and for the analysis of the profit and loss account.. FINANCIAL STRUCTURE Liabilities and Net Equity reflect the sources of external financing and own the company. Looking only at the variation of the percentages that weigh each item compared to the total, we can intuit that the way of financing of the group has changed significantly.. 11.
(12) Figure 1: Comparative table of the economic structure.. In 2013, the first year in which the group presented consolidated annual accounts, almost half of its debt was long-term, which is commonly considered by economists more suitable than short-term financing. A year later the external financing was gaining ground to the own-resources funding and the short term debt reached 50 % of the total.. In 2015 the financial situation still followed this trend. There was a variation between the proportion of short-term debt and long-term debt, increasing the latter to the detriment of the former, but the inclination to lower own funds persisted. The last balance presented by the company, in 2016, own-resources financing was nil, and short-term debts represented 61 %, and long-term debt the remaining 41 %. This circumstance caused the debt indicators to skyrocket.. Most of its debt was financial, since the items with higher amounts are for noncurrent liabilities II Long-term debt and current liabilities III Short-term debt. In 2013, the sum of these two headings reached 49 % of the total financing; in 2014, 60 %; in 2015, 64 %; and in the last year 74 %, which was the largest increase in financial debt.. The growth of its financial debt made the company has less and less credibility with lenders, and it had to pay higher interest, so its financial expenses grew at a faster. 12.
(13) rate than its debt did. Carbures was continually in negotiations to refinance its debt and get more funds.. On December 23, 2014, a private financing operation through a public document was executed, obtaining 16.33 million euros. The lenders were four different companies, two of which were Carbures shareholders: Rafcom Economist, S.L. and Neuer Gedanke, S.L. The capital repayment term was 3 years, reason why it will expire in 2017, and the type of interest which the operation was signed with was 6 % per year. This agreement was signed while Carbures was suspended from trading in the ASM. Although it was going through a crisis of confidence, there were investors who trusted in the company’s strategic plan, so the group stated that it was able to continue with its expansion strategy.. On January 20, 2015 another financing agreement was executed with Black Toro Capital through an investee company: BCT Dos, S.A.R.L. It lent 8 million euros, at an interest rate of 6 % per annum to a term of 3 years, so that it will expire in 2018. As published by the ASM when explaining the operation development, BCT Dos did not demand guarantees beyond the personal responsibility of Carbures, but it did point out that the loans of 2014 and the current one were granted for them to be used in the necessary investments to be made to carry out the business plan and for the organic growth of the company.. On May 28, 2015, there were two more privately financed operations. Anangu S.L.U. provided four million euros and BTC Dos, S.A.R.L. eight million, with the same conditions as the previous ones: 3 years term and annual interest rate of 6 %.. On June 1, 2015, a debt restructuring agreement was executed with its main banking entities: with BBVA a loan of four million euros, and with Bankia a loan of three million euros that matured in 2015. After its restructuring, Carbures got a postponement of 4.4 million euros until 2016.. On September 1, 2015, Black Toro Capital, which already had almost 7 % of the capital of Carbures, once again injected funds through a loan of thirty million, with a repayment term of two years and an interest of 6 % per year.. 13.
(14) On September 25, 2015, the financing operation was formalized by Emerging Markets Intrinsic, amounting to seven million euros. These were delivered in two terms: the first delivery was made in October 2015, for an amount of three million euros.. During 2015 five financing operations were carried out by the company. These operations justify the increase in the proportion of non-current and current liabilities, which accounted for the total financing, leaving the own-resources financing at 9 %. In addition its increase in value in 2015 if compared to 2014 was for the non-current liabilities a 7% and for current liabilities -26 %.. In. 2016,. refinancing. and. extension. of. funds. continued. with. the. Reindustrialization and Development Program managed by the Ministry of Industry, Energy and Tourism, which granted the company a loan of 8.9 million euros, with a repayment term of 10 years, with a grace period of 3 years and an interest rate of 4.09 %.. Recently in January 2017, Carbures has signed yet another refinancing agreement with its four main financial institutions: Sabadell, BBVA, Bankia and Targobank. Through this agreement it has refinanced 75 % of its bank debt. It has extended short-term financing by 13.7 million and has also changed the amortization schedule and the interest rate and now it will pay the Euribor plus a 4 % differential. In addition it will have to pay a 1 % commission for the restructuring amount. On the other hand, at the General Meeting of February 2 approved capital increases for debt compensation. With this operation the equity in red increased.. In addition, in 2016 the company filled together with the financial statements information on the financial situation, in which it shows a second balance sheet in which it expresses its financial situation in the event the impact that the capital increase by compensation of credits that took place the past 9 February of 2017 would have on the liabilities and the net equity had been included. The company tries to improve its financial image, ensuring that they are meeting their financing needs.. Net Worth Net worth is the assets that include the group's own sources of financing. With the existing funds in the equity the investments of the asset are dealt with, but these. 14.
(15) funds are not debt: they do not have to be returned, they do not generate interest expenses.. Figure 2: Comparative table of net assets. The most important item of net worth is the Shareholders' Equity. In 2013 they accounted for 30 % of the financing, accumulating 12.95 million euros of capital distributed in 19,056,841 shares with a nominal value of € 0.68, the sum of 14.02 million euros accumulated in the issue premium plus 9.04 million euros of reserves and losses from 2012 of 1.23 million euros. This was the tax year with better data regarding own funds.. In 2014 own funds started to decrease with more than 18 million euros less than in 2013 and they already represented only 8 % of the financing of the company. Although the subscribed capital and the issue premium were the same as for 2013, the accumulated losses of 2013 were more than 19 million. This was the reason for an equity reduction. In 2015 and 2016 the situation of the company’s own funds did not improve. In 2014 losses were more than 36 million euros, which resulted in reducing own funds to 5 % of total funding in 2015. Regarding the last year with available data, 2016, own funds are 0 %, but in this case not all the responsibility goes to the previous year losses, which, although still being 15 million euros, had been significantly reduced if compared to the 36 million euros losses of 2015, but also to the accumulation of 47.5 million euros of negative reserves. The current financing of Carbures is 100 %. external.. 15.
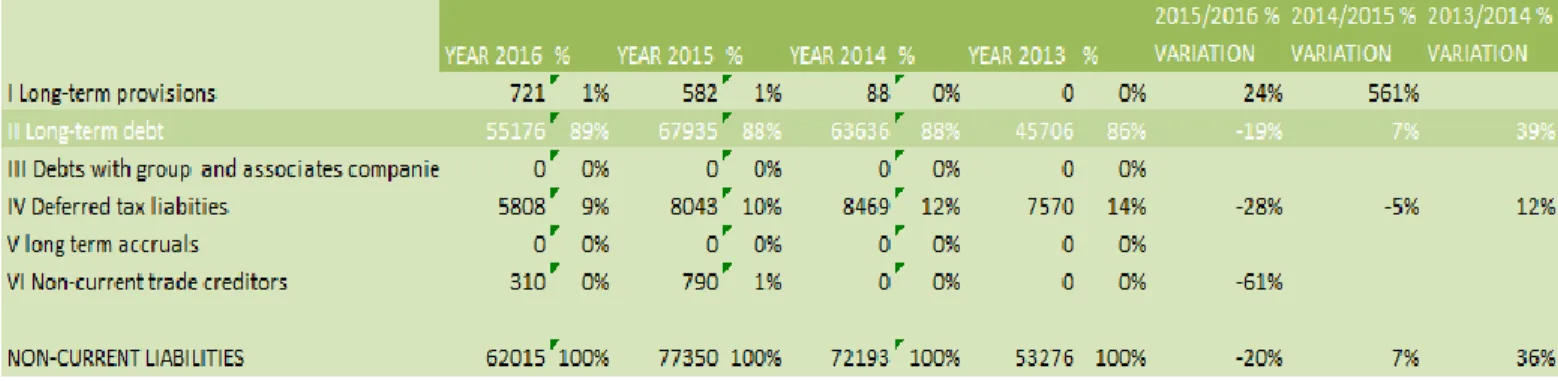
(16) Non-current liabilities The non-current liabilities include the company's sources of financing, which are expected to be repaid over a longer period than a year. As we have already stated in the previous section, the largest amount of Non-Current Liabilities is the II long-term debt. In the following table we can see that the weight taken by this item is between 86 % and 89 %. That is, almost all long-term debt is financial.. Figure 3: Comparative table of non-current liabilities.. Within this heading we can differentiate two subgroups: credit institutions such as Santander, Bankia, Bankinter, Caixabank, Sabadell and other financial liabilities, which for the first 2016 had an amount of 13,643 thousand euros and the second 41,228 thousand euros. What we can clearly see is that the debt to other financial liabilities is more than twice that to financial entities. In other financial liabilities we find reimbursable incentives granted by public entities and debts to non-financial entities. This division of the debt in the long term has been similar in all the years analyzed.. The other most significant item of non-current liabilities is IV deferred tax liabilities, heading where debts with the public finance are reflected, which are not currently required, but will be in the future. After commenting on the debt to public finances, pointing out that the companies of the group have pending main taxes inspections from the years from 2012 to 2016 is also interesting: corporation tax, value added tax, personal income tax and economic activity tax, in addition to social security; note 21 of the 2016 financial report.. 16.
(17) Current Liabilities Current liabilities include other sources of financing, in which the repayment of borrowed capital term is less than one year. In the current liabilities, the higher amounts are grouped in item III short-term debt. Its weight within the equity group increased from year to year. In 2013 this represented 46 % and in the following year increased its value by 366 % and its weight within the total current liabilities reached 52 %. In the following years there was not a bizarre variation such as in 2013/2014, but although the increase in the weighting has not stopped, in 2016 short-term debts are 72 % of current liabilities.. Figure 4: Comparative table of current liabilities.. III short-term debt accumulates short-term debt to credit institutions and other financial liabilities, with the latter being the largest with non-current liabilities, repayable incentives granted by public entities and debts with non-financial entities. The debt weighting within this heading followed the same trend in all the tax years analyzed.. The second most important item of current liabilities is IV trade and payables, where credit with suppliers and creditors is set. This is directly related to the average period of payment to suppliers that for 2016 was 76 days, in 2015, 110 days; in 2014, 39 days; and in 2013, 89 days.. 17.
(18) ECONOMIC STRUCTURE. The assets of the company show its economic structure. They are divided into two major groups: the non-current assets, in which the productive capacity of the company materializes, and the current assets, in which the operating cycle can be seen.. Figure 5: Comparative table of the economic structure.. In 2013 non-current assets accounted for three quarters of the total assets. This percentage reduced in the following years, and in 2016 it was 55 % of the total. This reduction, as it cannot be otherwise, has increased in favor of current assets, balancing the economic structure. If paying attention to the figures of total non-current assets from 2014 to 2016, we can see that the group's investments are reducing or that the company is not increasing its productive capacity.. Non-current Assets. Non-current assets include items that are intended to serve in a lasting way in the business of the company. They are the tangible and intangible infrastructure. Longterm financial investments are also included within this equity pool.. 18.
(19) The largest item within the non-current assets is the I intangible assets, which they alone accumulate more than a quarter of the total assets in all the years evaluated. Intangible assets include the following accounts: development, patents and licenses, computer applications, customer portfolio and goodwill. The most significant of them are the development and goodwill accounts as a result of the acquisition of companies by the group.. The second most relevant item of non-current assets is the II tangible fixed assets. The elements included in this heading weigh an average of 22 % of the total assets. Within them we can find the accounts including land, constructions, technical installations and machinery, tools and other fixed assets, the most valuable in Carbures being the constructions, technical installations and machinery.. Current assets. Current assets are the net assets of the asset. They comprehend the assets and rights controlled by the company for a term less than one year. The item with the greatest weight within current assets is III trade and other receivables. These accumulate between 15 % and 19 % of total assets. The accounts that increase the volume of the game are the customers receivables for sales and service rendering.. Other items that also have a leading role in assets are the II stocks with a weighting of 6 % for four years and VII cash and other equivalent liquid with an average of 7 % of the average weight of the total assets.. PROFIT AND LOSS ACCOUNT The profit and loss account reflects the result for the year. In it the income and expenses accrued during the year are outlined, determining how much profit or loss the economic unit has achieved. The structure of the profit and loss account distinguishes between operating results, financial results and total profit before and after tax. To examine the profit and loss account of Carbures we will follow the same structure.. 19.
(20) Figure 6: Comparative table of the profit and loss account.. Operating result The operating result is the difference between the income that the company has had thanks to its activity and the expenses it has had to face in order to carry it out. In the case of Carbures, the operating result was negative from 2013 to 2016.. The volume of business did increase year by year. In 2014 was when it had a stronger increase in revenues, the company almost tripled them if compared to 2013, thanks to the new line of business, manufacturing of linear, as you can see in the reports clippings. However, the operating result for 2014 continued to be negative, with. 20.
(21) higher losses of around 18 million euros. The turnover in 2016 increased 11 % compared to 2015. It also seems important to highlight that for all the exercises around half of the turnover comes from Spanish investments.. Figure 7: Reports clipping: turnover evolution. When looking at the items of 4. Supplies and 6. Staff costs, we see that they alone use the total operating income, since supplies have an average percentage of expenditure over turnover of 41.5 % in the four years studied, and personnel expenses are still higher, averaging half of the operating result by 50.25 %.. Figure 8: Reports clipping: evolution of the expenditure on provisioning.. Figure 9: Reports clipping: evolution of personnel expenses.. 21.
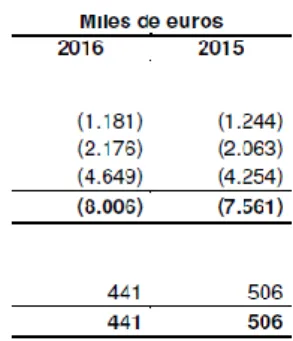
(22) In the case of personnel costs, it may be interesting to note that the number of employees has grown in 2013, with 528 employees. In 2014 there were 795 employees; in 2015, 841; and in 2016 they decreased to 807. The increase in staff is a positive fact for the company, but the counterpart is that only the personnel cost uses half of the income.. Financial results The financial result is the difference between the financial income generated by the financial investments of the company and the financial expenses arising from the financing of the commercial and financial operations necessary to maintain the structure of the asset.. For all the income statement accounts we are evaluating, the financial result is negative because the financial expense is much higher than the financial income. In addition, it becomes higher each year. In the reports clippings that describe financial income and expenses, we see that in the first table, where it refers to 2014/2013, interest expenses are higher in loans that come from credit institutions. And in the second table, that refers to the 2016/2015 financial year, the financial expenses for loans to other companies are about three times the expenses for loans to credit institutions. Also in this period there are the loans to related entities that did not exist during the 2014/2013 period.. Figure 10: Reports clipping: breakdown of financial expenses and revenues 2014 and 2013.. 22.
(23) Figure 11: Reports clipping: breakdown of financial expenses and revenues 2016 and 2015.. Profit before tax The profit before tax is one of the last lines of the profit and loss account, which takes into account the total of both operating and financial income, and the same happens for expenses. It is also known as the gross profit of the company. In the case of Carbures as we can predict after visualizing the operating result, the financial result must be negative.. Figure 12: Comparative table of profit before tax. In a horizontal analysis of the Carbures profit before tax, we see that the losses of 2013 if compared to 2014 increased by 1,441 %, an extraordinary increase as a consequence of the increase in expenditure on provisioning, personnel and financial cost. In 2015 the increase in losses continued, by 40 % if compared to 2014, until in 2016 the company managed to put the brakes and these dropped by 39 %. Although it continued to have a negative result, at least they were almost half of the previous year.. Figure 13: Comparative table of profit after tax. 23.
(24) Profit after tax In the table above we have the final result of the company after deducting the cost of corporation tax. In recent years corporate tax is not being a cost for Carbures, but an income, as it compensates credit from previous years to the Public Treasury, with which the profit after tax reduces the losses of the company being these lower than the profit before tax. In this case the charge rate of the corporation tax is 0 % since the group has losses.. 24.
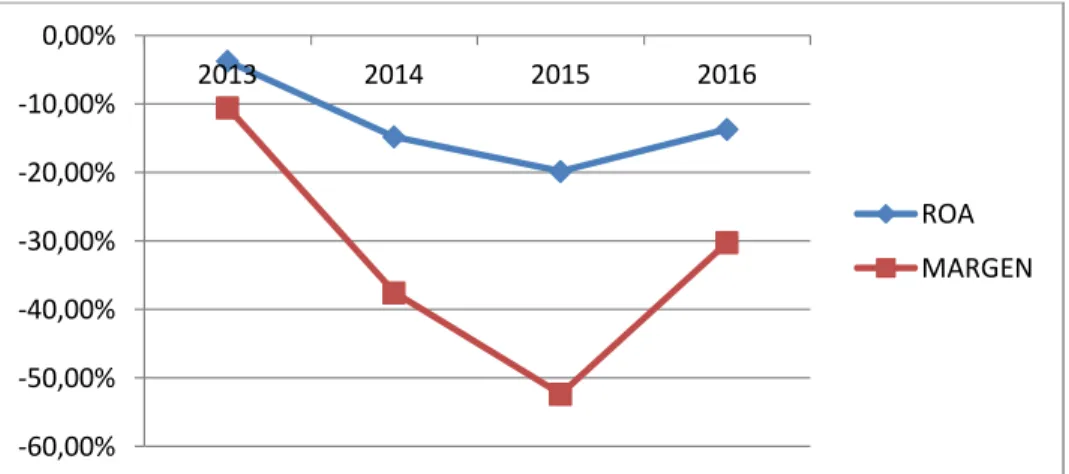
(25) FINANCIAL RATIOS. Calculating financial ratios to know the economic-financial situation of a company is something customary. The ratio is a quotient between two magnitudes, and for it to be useful in the financial forecast has to compare two magnitudes between which there is a relationship, and also has to be predictive, that is, useful for preparing forecasts.. The ratios are a fundamental tool in the financial analysis for several reasons: they allow to reduce the variables to be taken into account to carry out the analysis, they make possible the comparison between companies with different sizes, and finally they are accepted by the analysts so that they are part of their jargon.. Different ratios have been calculated to measure different aspects of the company, which have been classified in the traditional way: profitability, liquidity and solvency and likelihood of bankruptcy.. Profitability analysis Profitability ratios measure the company's ability to create wealth. In order to measure the economic profitability of Carbures, the index known as ROA has been used. This gives information on the profit obtained by the company for each euro that has been invested in its assets. ROA can be broken down into two other ratios: margin and turnover. Margin measures the relationship between profits and revenues and turnover measures the ratio between income and average assets. In order to compare the ratios of the different tax years, we can take a look at the following graphs.. 25.
(26) 0,00% -10,00%. 2013. 2014. 2015. 2016. -20,00% ROA. -30,00%. MARGEN. -40,00% -50,00%. -60,00%. Figure 14: Graph ROA and margin.. As we can see in the graph above, the ROA ratio is negative for all years, which translates into losses for the company. This happened because the margin takes negative values. In 2015 we can see the worst data for ROA, which reached almost 20 % in negative, since that is the year the company had the worst result in its history with losses of more than 36 million euros. In 2016 it experienced a slight recovery obtaining ROA and margin percentages closer to 0.. As for the turnover, it has taken positive values in all the years, but its turnover has a low level that does not allow to increase the ROA.. 0,50 0,40 0,30. ROTACIÓN. 0,20 0,10 2013. 2014. 2015. 2016. Figure 15: Graph turnover. To measure the profitability of Carbures shareholders, the ROE ratio has been used. This percentage will indicate the profit or loss that the shareholder will get for each euro invested in the company. ROE is made up of the ROA percentage and financial leverage.. 26.
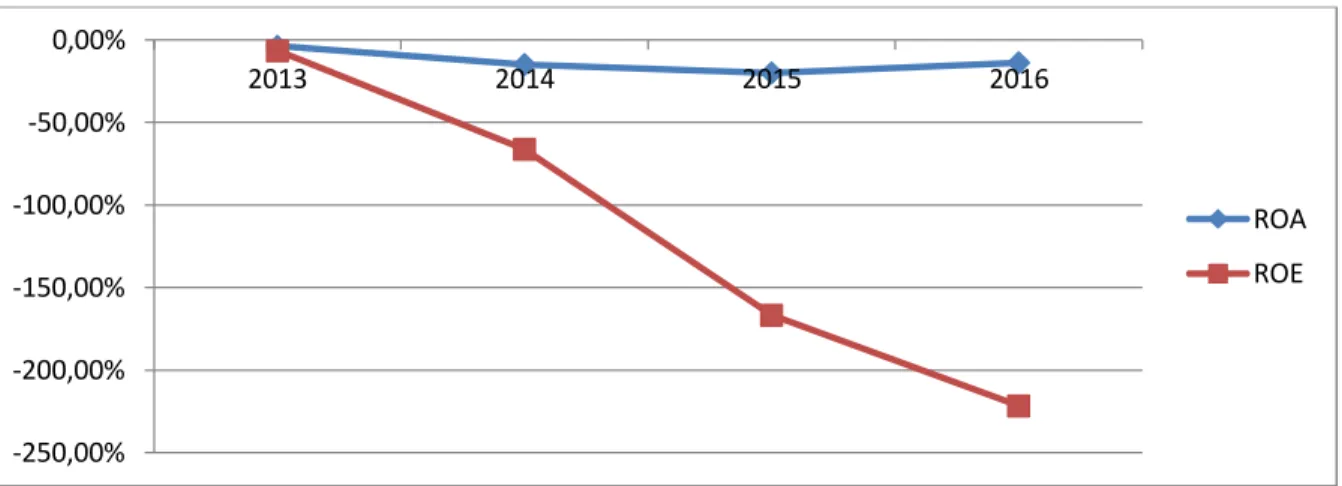
(27) 0,00% 2013. 2014. 2015. 2016. -50,00% -100,00%. ROA. -150,00%. ROE. -200,00% -250,00%. Figure 16: Graph ROE. The GAP between the ROE line and the ROA reflects the financial leverage, which as seen in the graph it increased each year since 2013 and has not stopped growing. In 2016 the percentage of ROE reaches a negative percentage of 220 %; the ratio exploded as a result of the increasing financial leverage. The company signed a refinancing agreement for its financial debt at the end of 2016. In addition to this the board members themselves bought bundles of Carbures shares; they likely did it in order to lower leverage and improve the image of their financial situation.. Liquidity and solvency analysis Liquidity refers to the ability of the company to meet short-term debt and solvency to the ability to cope with long-term debt.. The maneuver fund is an indicator of liquidity. This is the difference between current assets and current liabilities.. Figure 17: Table maneuver fund comparative.. In the recent exercises Carbures obtained a negative working capital, which indicates that the company has no liquidity. It does not have capacity to cover its short-. 27.
(28) term debts, which points out that a company is not succeeding. In addition, the negative figures of the maneuver fund last year have increased compared to 2015 by 346 %.. Another liquidity indicator is the current ratio, the ratio of current assets and current liabilities. Creditors prefer the current ratio to be above the unit, which means that it is easier to convert the assets into cash when meeting payments in less than a year. Carbures only shows a current ratio higher than the unit in 2013; the remaining years are below the unit, which as well as the indicator of the maneuver fund predicts poor liquidity.. Figure 18: Comparative table of the current ratio. The short-term debt ratio, which is the quotient of current liabilities and the sum of non-current liabilities and net equity, reflects how the debt is increasing in the short term, growing by more than 100 % from 2015 to 2016.. Figure 19: Comparative table of the short-term debt ratio.. Finally, the long-term debt ratio, which is the quotient between non-current liabilities and the sum of non-current liabilities and equity, which is an indicator of the company's solvency level. The results show that Carbures is more indebted each year, and that its solvency is also weaker.. Figure 20: Comparative table of the long-term debt ratio.. 28.
(29) Bankruptcy analysis. In order to analyze the probability of bankruptcy of Carbures we have used the indicator known as Z-Score. This was designed by Edward Altman, professor of New York University in 1969. It is a simple way to analyze the financial strength of the company. Through an econometric formula one can obtain a decision rule that allows to predict the bankruptcy of the company in advance. It is recognized as a very precise formula; the data previous to the crisis of 2007 verified that it obtained a precision of 95 %.. Z-Score predicts that companies that get a result below 1.81 in the application of their econometric formula have a high probability of bankruptcy. This is the case of Carbures that, since it went to the stock market, never got a Z-Score greater than 1.81, which would take it away from the shadow of over-indebtedness.. Figure 21: Comparative table of the evolution of Z-Score.. In the previous table we see the Carbures Z-Score for the different years. The exercise with a more robust Z-score is 2013, while the rest is below the unit. In 2016 we can see an improvement over the previous year, because as the company announced revenues increased and debt was renegotiated, yet Carbures is far from the comfort zone according to Edward Altman.. 29.
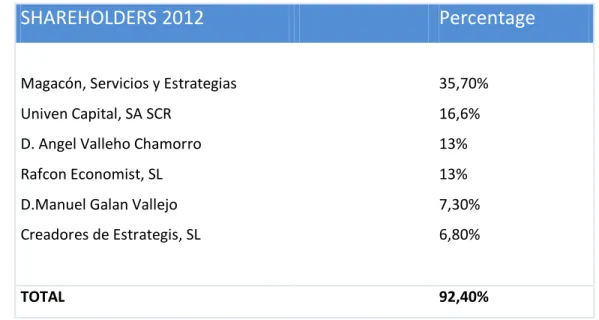
(30) SIGNIFICANT SHARES When Carbures began trading on the ASM, March 2012, shareholders with a significant stake, more than 5 % of the share capital, were those listed in the table below.. SHAREHOLDERS 2012. Percentage. Magacón, Servicios y Estrategias. 35,70%. Univen Capital, SA SCR. 16,6%. D. Angel Valleho Chamorro. 13%. Rafcon Economist, SL. 13%. D.Manuel Galan Vallejo. 7,30%. Creadores de Estrategis, SL. 6,80%. TOTAL. 92,40%. Figure 22: Table relevant shares of 2012.. Magacón Servicios y Estrategia S.L. is allocated to the advising of industrial projects. Its only administrator was Mr. Rafael Jesús Contreras Chamorro, who is one of the founders and executive director of Carbures. Univen Capital, S.A. S.C.R., a venture capital company allotted to investing in technology-based companies. Its president is Cristina Romero Morenilla, also a member of the board of directors of Carbures.. Rafcon Economist, S.L. is allocated to advice, planning and development of projects within the scope of business and economy. It was founded in 2007 by Rafael Jesús Contreras Chamorro, who served as sole administrator until in 2014, when he quitted and Mr. Ignacio Díaz Charlomanuel was appointed new sole administrator of the company.. Creadores de Estrategia, S.L. develops its activity in the sector of business advice. Founded in 2008, its president is Manuel García Pacheco and its managing director is Rafael Jesús Contreras Chamorro.. 30.
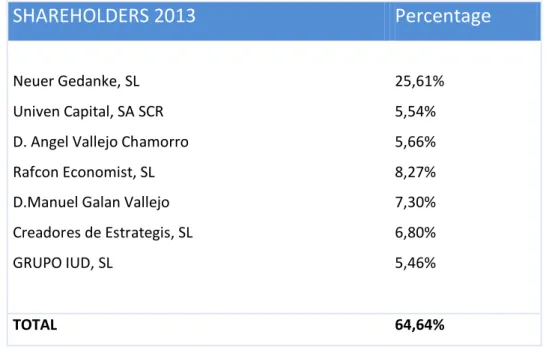
(31) In June the company made an increase of 6,159,695 shares. The nominal value of the new shares was € 0.01/share and its issue premium € 1.29, with a maximum cash value of € 8,007,603. In December of the same year, the general meeting of shareholders agreed to carry out a new capital increase of € 10,080,061 by raising the value of the existing shares to € 0.68, without altering the number of shares, which at the moment of this increase was 15,044,812.. In June 2013 Carbures made another capital increase: this time the number of shares was increased by 1,002,992, the issue value of the new shares was 0.68 €/share and the issue premium was of 5.32 with a maximum cash value of € 6,017,952. And in August the company made another capital increase with the same characteristics.. At the end of 2013 the significant stake shareholder chart in Carbures remained as it can be seen in the following table. At the forefront of the society is Neuer Gedanke, S.L., which is the old Magacón, Servicios y Estrategias, S.L. The rest of shareholders have a percentage less than 10%, so Univen, Angel Vallejo and Rafcon Economist, lost prominence. However, a new company, Grupo IUD, S.L., became a shareholder.. SHAREHOLDERS 2013. Percentage. Neuer Gedanke, SL. 25,61%. Univen Capital, SA SCR. 5,54%. D. Angel Vallejo Chamorro. 5,66%. Rafcon Economist, SL. 8,27%. D.Manuel Galan Vallejo. 7,30%. Creadores de Estrategis, SL. 6,80%. GRUPO IUD, SL. 5,46%. TOTAL. 64,64%. Figure 23: Table relevant shares of 2013.. 31.
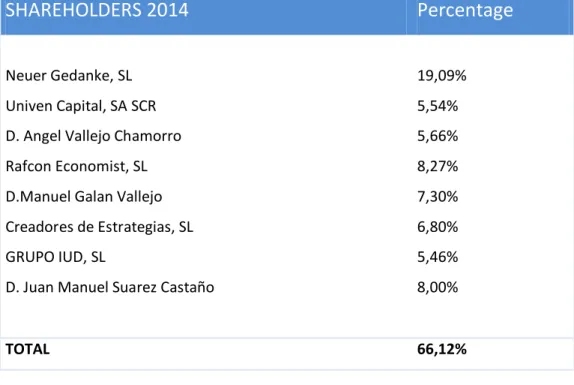
(32) In 2014 Carbures did not make any capital increase. As a result of the purchase-sale of shares, the significant shareholder group remained with the following percentages: the novelty was the entry of Juan Manuel Suárez thanks to the shares he directly owned and those that he owned through the society that he is in charge of. It is also relevant that that Rafael Jesús Contreras Chamorro was directly and indirectly in charge of Carbures thanks to the increase of its stake increase in the companies Neuer Gedanke, S.L. and Rafcom Economist, S.L.. SHAREHOLDERS 2014. Percentage. Neuer Gedanke, SL. 19,09%. Univen Capital, SA SCR. 5,54%. D. Angel Vallejo Chamorro. 5,66%. Rafcon Economist, SL. 8,27%. D.Manuel Galan Vallejo. 7,30%. Creadores de Estrategias, SL. 6,80%. GRUPO IUD, SL. 5,46%. D. Juan Manuel Suarez Castaño. 8,00%. TOTAL. 66,12%. Figure 24:Table relevant shares of 2014.. In 2015 there was another capital increase, this time through the offsetting of credits. 20,644,720 shares of a nominal value were issued, each of them at € 0.17 and a share premium of 1.33 €. The share capital after the capital increase was 16,468,254 distributed in a total of 96,872,084 shares.. The significant shareholders at the end of 2015 were Neuer Gedanke, S.L., BTC DOS, S.A.R.L and Anangu Grup, a company controlled by Neuer Gedanke, S.L., both controlled by Rafael Jesús Contreras Chamorro, Carbures CEO and majority shareholder of it by participating in third companies.. 32.
(33) SHAREHOLDERS 2015. Percentage. Neuer Gedanke, SL. 16,81%. BTC DOS, Sarl. 7,04%. Anangu Grup. 9,47%. TOTAL. 33,32%. Figure 25: Table relevant shares of 2015.. In 2016 the relevant shareholder composition did not change significantly, but BTC DOS, S.A.R.L. had more and more weight within the company. This company belongs to the Black Toro Capital group, a company that is dedicated to invest in medium-sized companies which are considered to have a potential business plan and through their strategic investment happens to control them.. SHAREHOLDERS 2016. Percentage. Rafael Contreras Chamorro. 13,90%. BTC DOS, Sarl. 10,09%. Anangu Grup. 10,92%. TOTAL. 34,91%. Figure 26: Table relevant shares of 2016.. The last capital increase took place last May. The total amount was € 55,186,147.36, through the issuance of 115,043,040 shares with a nominal value of € 0.17/share and an issue premium of € 0.30. At present Carbures is controlled by Rafael Contreras Chamorro through his direct and indirect participations in the society.. 33.
(34) SHAREHOLDERS 2017. Percentage. Rafael Contreras Chamorro. 8,18%. BTC DOS, Sarl. 10,09%. Participaicon. indirecta. de. Rafael. Contreras. Chamorro. 6,94%. TOTAL. 25,21%. Figure 27: Table relevant shares of 2017.. 34.
(35) EVOLUTION OF THE ASM QUOTATION The Alternative Stock Market (ASM) is designed to finance, increase visibility and brand awareness and boost the international expansion of companies with a certain profile. The main characteristic to be quoted in the ASM is that the company has an innovative project that allows it to be a leader in the sector. They are not companies of a certain sector or with a high turnover, but with a significant latent value that comes from their products and technology. But they are not Start Ups; the companies that are listed in the ASM is possible that they were Start Ups when they were established, but they have already surpassed that phase, and at the moment they are consolidated companies. Carbures began trading on the ASM on March 23, 2012. Its starting price was € 1.08/share. On the same day the stock reached the price of € 1.13/share. During its first months in the market the stock price remained constant. Below we show a graph with data about the evolution of its quotation from its flotation to the month of May 2017.. Figure 28: Graph evolution of the quotation in the ASM 2012-2017. In 2013 its capitalization reached 249,263 thousand euros and a volume of 43,522 thousand shares. The value of the share began to increase, reaching the maximum of 3.62 €/share; the number of shares in the market were 19,057. The following year Carbures reached its historical peak, this was € 10/share and its minimum € 2.68/share. During this year Carbures experienced success with the acquisition of major companies such as MAPRO and the discovery of new technologies, but also the failure, since in the last quarter of 2014 the company was suspended from listing on the ASM, a fact that plunged its shares below € 2/share. Also the company was compared to Gowex, sowing distrust within the group's shareholders. Its. 35.
(36) capitalization for this year was 405,530 thousand euros and its volume 99,103 thousand shares.. In 2015 the suspension was lifted and it quoted again in the share market, but the trend was bearish throughout this year: its maximum for this year reached € 3.54/share and its minimum € 0.39/share, worse data of its history until that moment. Its capitalization was 74,592 thousand euros and its volume 140,574 thousand shares.. The following graph shows the Carbures price for the last two years, from June 2015 to June 2017. What we can see after the end of 2015 is that Carbures' price stabilized and its price fluctuated between € 0.95/share and € 0.38/share, being this its historic low. In 2016 its capitalization was 52,311 thousand euros and its volume 140,574 thousand shares. And in 2017 the capitalization is 103,838 thousand euros and it has a volume of 73,391 thousand shares.. Figure 29: Graph evolution of the quotation in the ASM of 2015-2017.. 36.
(37) CONCLUSION. The study carried out tries to illustrate the financial situation of Carbures from 2013 to the present through the analysis of its financial structure, economic structure, financial ratios on profitability, liquidity, solvency and likelihood of bankruptcy, and also making a review on the changes in its shareholders with significant participation and lastly by examining the evolution of its share in the ASM.. Once the financial structure and financial ratios have been evaluated, there is no doubt that the company has an important debt and liquidity problem, which is the reason for the numerous capital increases and debt negotiations. It is important to note that most of Europe Carbures' funding comes not from financial institutions, but from private investors.. Despite the dire financial situation, Carbures is able to lend money to both financial institutions and private investors, such as Black Toro Capital, in addition to the support of public entities granting grants and loans. The explanation for this escapes financial analysis, but it is clear that the expectations of investors is to recover their capital and obtain some return.. Carbures' revenues depend to a large extent on the signing of contracts. It is quite possible that the technological competitive advantage not captured in the financial analysis is what drives the investors to place their trust and money in it. It is a high-risk company, from which high profitability is expected.. 37.
(38) REFERENCES . Carbures Europe, S.A.(2015) Informe de auditoría independiente de cuentas anuales consolidadas e informe de gestión consolidado al 31 de diciembre de 2014. [online]. available. at. file:///C:/Users/Usuario%201/Downloads/16162_InfFinan_20150430.pdf. . Carbures Europe, S.A. (2016) Cuentas anuales consolidadas e informe de gestión del ejercicio 2015 junto con el informe de auditoría. [online] available at < file:///C:/Users/Usuario%201/Downloads/16162_InfFinan_20160430.pdf>. . Carbures Europe, S.A.(2017) Cuentas anuales consolidadas e informe de gestión del ejercicio 2016 junto con el informe de auditoría.[online] available from < file:///C:/Users/Usuario%201/Downloads/16162_InfFinan_20170428.pdf>. . Carbures Europe, S.A.(2017) Información financiera del ejercicio 2016. [online] available. at. <. file:///C:/Users/Usuario%201/Downloads/16162_InfFinan_20170428.pdf>. . Carbures Europe, S.A. (2012) Documento informativo de incorporación al MABEE. de. Carbures. Europe,. SA.. [online]. available. at. https://www.bolsasymercados.es/mab/documentos/Otros/2012/03/16162_Follet o_20120323.pdf . Carbures Europe, S.A. (2012) Documento de ampliación reducido para el MABEE. de. Carbures. Europe,. S.A.. Junio. 2012. [online]. avaible. at. <. https://www.bolsasymercados.es/mab/documentos/Otros/2012/06/16162_Follet o_20120618.pdf>. 38.
(39) . Carbures Europe, S.A. (2012) Documento de ampliación reducido para el MABEE de Carbures Europe, S.A. Diciembre 2012 [online] avaible at < https://www.bolsasymercados.es/mab/documentos/Otros/2013/01/16162_Follet o_20130102.pdf>. . Carbures Europe, S.A. (2013) Documento de ampliación reducido para el MABEE. de. Carbures. Europe,. S.A.. Junio. 2013. [online]. avaible. at. <. https://www.bolsasymercados.es/mab/documentos/Otros/2013/07/16162_Follet o_20130705.pdf>. . Carbures Europe, S.A. (2013) Documento de ampliación reducido para el MABEE. de. Carbures. Europe,. S.A.. Agosto. 2013. [online]. avaible. at. <. https://www.bolsasymercados.es/mab/documentos/Otros/2013/10/16162_Follet o_20131015.pdf>. . Carbures Europe, S.A. (2015) Documento de ampliación reducido para el MABEE de Carbures Europe, S.A. Septiembre 2015 [online] avaible at < https://www.bolsasymercados.es/mab/documentos/Otros/2015/09/16162_Follet o_20150929.pdf>. . Carbures Europe, S.A. (2017) Documento de ampliación reducido para el MABEE. de. Carbures. Europe,. S.A.. Mayo. 2017. [online]. avaible. at. https://www.bolsasymercados.es/mab/documentos/Otros/2017/05/16162_Follet o_20170519.pdf . Carbures Europe, S.A. (2013) Hecho relevante: Participaciones significativas 09/01/2013. [online]. avaible. at. <. https://www.bolsasymercados.es/mab/documentos/HechosRelev/2013/01/1616 2_HRelev_20130109.pdf>. 39.
(40) . Carbures Europe, S.A. (2013) Hecho relevante: Participaciones significativas 05/07/2013. [online]. avaible. at. <. https://www.bolsasymercados.es/mab/documentos/HechosRelev/2013/07/1616 2_HRelev_20130705.pdf> . Carbures Europe, S.A. (2014) Hecho relevante: Participaciones significativas 07/07/2014. [online]. avaible. at. <. https://www.bolsasymercados.es/mab/documentos/HechosRelev/2014/07/1616 2_HRelev_20140707_1.pdf . Carbures Europe, S.A. (2015) Hecho relevante: Participaciones significativas 30/11/2015. [online]. avaible. at. https://www.bolsasymercados.es/mab/documentos/HechosRelev/2015/11/1616 2_HRelev_20151130.pdf . Carbures Europe, S.A. (2016) Hecho relevante: Participaciones significativas 19/09/2015. [online]. avaible. at. https://www.bolsasymercados.es/mab/documentos/HechosRelev/2016/09/1616 2_HRelev_20160918_1.pdf . Carbures Europe, S.A. (2017) Hecho relevante: Participaciones significativas 11/05/2015. [online]. avaible. at. https://www.bolsasymercados.es/mab/documentos/HechosRelev/2017/05/1616 2_HRelev_20170511.pdf . Carbures ha cometido errores contables pero no irregularidades (2014) in Expansión. [online]. 30. April.. Avaible. from. <. http://www.wordreference.com/es/en/translation.asp?spen=abril> . Carbures, suspendido en el MAB ante las dudas de su auditor (2014) in Expansión. [online]. 8. November.. Avaible. from. <http://www.expansion.com/2014/10/08/mercados/1412755634.html> . Carbures declara pérdidas de 6 millones tras la auditoria de PwC (2015) in Expansión. [online]. 3. January.. Avaible. from. <. http://www.expansion.com/2015/01/02/mercados/1420219046.html> . . Carbures se desploma más de un 66% en el MAB despúes de reformular sus cuentas (2015) in elEconomista [online] 5 January. Avaible from <. 40.
(41) http://www.eleconomista.es/mercadoscotizaciones/noticias/6368334/01/15/Carbures-cae-un-50-en-la-subasta-depreapertura-del-MAB.html>. . Jiménez, S.,García-Ayuso, M., Sierra, G.(2000) Análisis Financiero. Madrid: Ediciones Pirámide, S.A.. 41.
(42)
Figure


+7
Documento similar
In this paper, we study the evolution of the revisions, period by period, until reaching the final estimate, with the objective of analyzing the impact of any economic event on
rous artworks, such as sonorou s poetry; d) instances of nOlHu1islie music, such as sonorous activiti es with soc ial, bu t not necessarily aes thetic, funct ions. Lango
On the other hand at Alalakh Level VII and at Mari, which are the sites in the Semitic world with the closest affinities to Minoan Crete, the language used was Old Babylonian,
As in the main results, there is an initial negative impact on development on the year immediately after the flood event, which becomes larger in the following years, reaching
The following figures show the evolution along more than half a solar cycle of the AR faculae and network contrast dependence on both µ and the measured magnetic signal, B/µ,
The resulting profiles were essentially identical, thus show- ing that the nucleus is the preferential accumulation site of the PSTVd (+) mc and linear (ml) genomic forms, in
What is perhaps most striking from a historical point of view is the university’s lengthy history as an exclusively male community.. The question of gender obviously has a major role
Financial decision-making should be based on the level of economic development, guided by the goal of macroeconomic development, and ensure the realization of
