Do Public Private Partnerships improve road safety?
Rangel, Thais: Transport Research Centre (TRANSyT), Universidad Politécnica de Madrid. E-mail: [email protected]
Vassallo, José Manuel: Transport Research Centre (TRANSyT), Universidad Politécnica de Madrid. E-mail: [email protected]
Arenas, Blanca: Automobile Research Institute (INSIA), Universidad Politecnica de Madrid. E-mail: [email protected]
Pérez de Villar, Pablo: Road Safety Department – Spanish Ministry of Public Works. E-mail: [email protected]
ABSTRACT
Public Private Partnerships (PPPs) are mostly implemented for three reasons: to circumvent budgetary constraints, encourage efficiency and improvement of quality in the provision of public infrastructure. One of the ways of reaching the latter objective is by the introduction of performance-based standards tied to bonuses and penalties to reward or punish the performance of the contractor. One of the most important indicators adopted are defined in terms of the safety performance of the road.
The aim of this paper is to identify whether the incentives to improve road safety in PPPs are ultimately effective in improving safety ratios. To that end we have calibrated several econometric models using information of toll motorways in Spain.
We found that, even though road safety is highly influenced by variables that are not much controllable by the contractor such as the Average Annual Daily Traffic and the percentage of heavy vehicles in the motorway, the implementation of safety incentives in PPPs has a positive influence in the reduction of fatalities, injuries and accidents.
INTRODUCTION
Many countries around the world are seeking new means to involve the private sector in managing and financing infrastructure through Public Private Partnerships (PPPs). Three reasons lay behind this trend: the growing budgetary constraints, the search for greater productivity efficiency, and the improvement of quality through a better allocation of risks and incentives (OECD, 2008). One of the most common ways of implementing PPPs in managing infrastructure is through the concession approach, which consists basically in transferring final design, construction, maintenance, and operation of the infrastructure to a private consortium, in exchange for which that consortium receives the right to charge a fee to the user or to the government on behalf of the user, for a period of time contractually agreed in advance (Vassallo and Gallego, 2005).
Concession contracts should include the necessary provisions in order that the relationship between the public and the private sector work at their best throughout the life of the contract. To this end, the bidding terms and contracts should comply with two requirements: first, ensuring that the most efficient bidder in terms of price and quality will be granted the contract; and second, providing incentives to the contractor to render the highest quality level compatible with a reasonable cost.
One of the key aspects of PPPs is precisely to allow freedom to the private sector to manage and operate the infrastructure in the best way. To that end, in the last few years, PPPs are evolving from mere demand-based contracts to service-based contracts. Consequently, the revenues of the contractor tend to depend more and more on performance-based standards rather than on traffic demand. Two reasons lie behind this trend. First, PPP contractors can manage better the service performance they offer than the traffic flows in the infrastructure. And second, encouraging the PPP contractors to provide a better service by aligning the social and the private benefits will end up producing a more efficient outcome to the society.
Traditionally, most of the infrastructure management contracts, including PPPs, have not introduced explicit incentives to increase quality. Rather they have usually set up a minimum quality in such a way that if the contractor performs below this quality level, he will be penalized. However, if he performs above at level, he will not be rewarded. These types of contracts have the problem that they do not incentivize the contractor to reach an optimal quality level. This is the reason why nowadays most PPP contracts are encouraging the introduction of incentives tied to bonuses and penalties to foster the contractor to provide the optimal quality level.
The approach explained above has moved many countries to introduce performance-based indicators tied to bonuses and penalties in their PPP contracts. Some countries, such as the United Kingdom has mostly replaced the demand-based approach (Debande 2002) by the performance-based approach. Some other countries, such as Spain, have incorporated bonuses and penalties tied to performance-based standards in many of their PPP contracts (Delgado et al. 2007).
Performance-based indicators have been selected in many countries on the basis of their manageability by the private contractor and their impact on social welfare. These performance-based standards often refer to different aspects such as technical and safety issues. This paper focuses on the implementation of safety-performance incentives in PPPs.
In the last few years, Spain begun introducing performance-based indicators in both toll and shadow toll motorways (Vassallo and Pérez de Villar 2010). Toll motorway concession contracts include a provision to extend the contract duration up to four years if several performance-based indicators tied to quality aspects like queuing in toll plazas, congestion, state of the pavement and satisfaction of the users are ultimately fulfilled. Other PPP’s awarded recently in Spain also include incentives in terms of annual bonuses to be incorporated to the periodic fee paid by the government to the contactor linked to performance-based indicators such as availability, state of the pavement, road safety and so on.
The aim of this paper is to identify whether the incentives to improve road safety in PPPs are ultimately effective in improving safety ratios. We found that there are more fatalities, injuries and accidents on road segments without incentives when they are compared with other segments with incentives in Spain.
ANALYSIS OF EXPERIENCES IN THE INTRODUCTION OF ROAD SAFETY INCENTIVES IN EUROPE
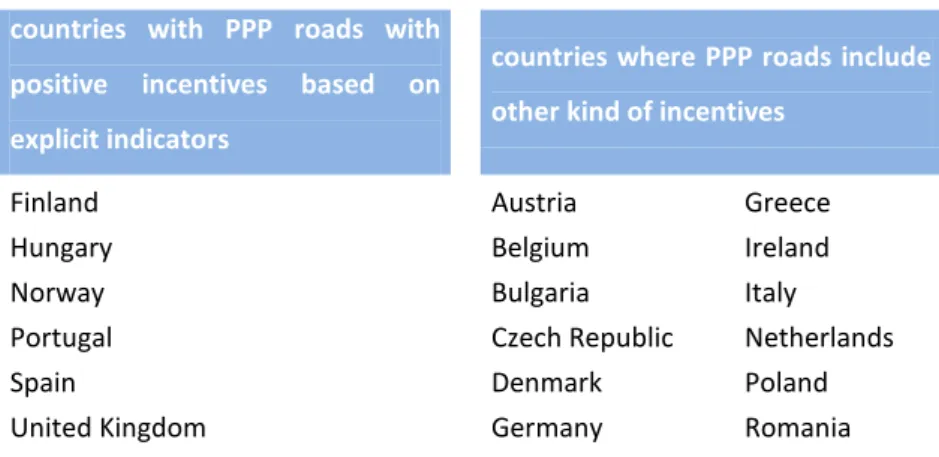
In this section we gather the information of how road safety incentives are being introduced in PPP contracts within the EU countries. In EU, which is the world’s region with the greater tradition of incorporating performance-based incentives in PPPs, we have identified 18 countries (see Table 1) with PPP roads and we have collected information of more than 50 contracts.
First of all, it must be pointed out that all the PPPs analysed adopt mechanisms to improve road safety in different ways, but not necessarily through incentives tied to performance-based indicators. The reason is that road safety is always present, in the management of roads, even in an indirect way. In fact, all the contracts introduce conditions related to design, maintenance or operation to achieve, at least, a standard of road quality considered as “safe”.
kinds of indicators are quite simple and they are the consequence of the result of many other road performance indicators. This property simplifies PPP contracts, something that is becoming essential.
It must also be taken into account that, in this research, the term “incentive” refers to any kind of economic profit with which the road operator is rewarded in terms of its performance. We have then excluded those PPP contracts where the regulations only impose road safety minimums with penalties if they are not fulfilled but without bonuses if they are exceeded. The importance of highlighting those incentives with bonuses lies in the fact that they encourage the road operator to go “beyond” the expected standards of road safety. These expected standards are usually equal to the minimums mentioned above. In short, it is interesting to enhance those incentives linked to explicit road safety indicators and that include bonuses for the road operator (positive incentives).
Table 1 Breakdown of the introduction of Road Safety Incentives by country
countries with PPP roads with
positive incentives based on
explicit indicators
countries where PPP roads include other kind of incentives
Finland Austria Greece
Hungary Belgium Ireland
Norway Bulgaria Italy
Portugal Czech Republic Netherlands
Spain Denmark Poland
United Kingdom Germany Romania
As can be observed in Table 1, there are few countries with PPP roads that introduce positive incentives based on explicit road safety indicators. Nevertheless, these countries where this was done, it became a normal practice and the latest PPP contracts continue to introduce and improve these incentives. This happens in Spain, Finland, Hungary, Norway, Portugal and United Kingdom. On the other hand, in France, despite being a country with a large tradition in concession contracts does not include any safety indicators in their contracts. Italy introduced price-caps tied to road safety indicators in such a way that the concessionaire is allow to set higher tolls if the safety ratios are better. In Ireland, PPP road contracts include some interesting road safety indicators but they do not provide bonuses. In other countries, like Denmark, the Netherlands and Belgium, there are new and sophisticated PPP contracts, but they do not have positive incentives based on explicit road safety indicators.
the fact that they have not found a formula to evaluate improvement in road safety rather than with scepticism about their effectiveness.
Apart from that, we have identified two kinds of incentives in the analyzed PPP contracts: (1) incentives related to the deadline of the projects and (2) incentives related to payments. Both of them have an effect on the economics of the road operator.
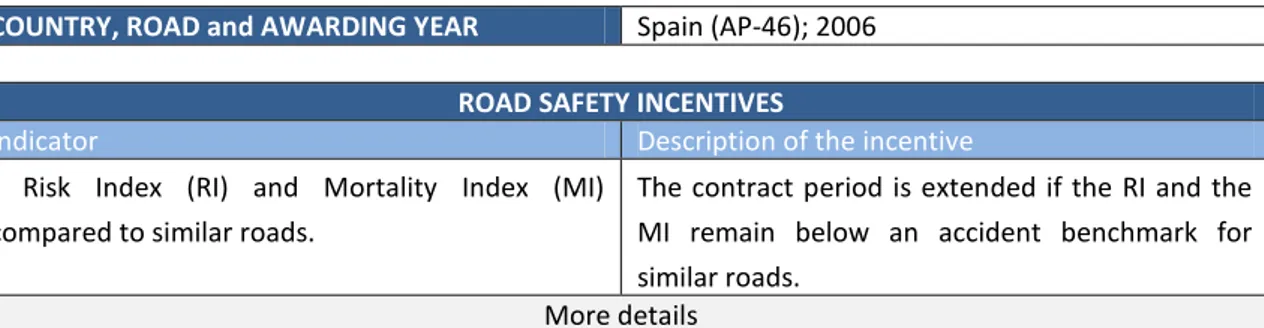
In the latest toll roads awarded by the Spanish Government, we found incentives related to deadline. In these PPPs, the road operator can be granted one or two additional years of operation of the road if safety indicators remain below an accident benchmark for similar roads, as can be seen in Table 2.
Table 2 Design of incentives in the latest toll roads awarded by the Spanish Government
COUNTRY, ROAD and AWARDING YEAR Spain (AP-46); 2006
ROAD SAFETY INCENTIVES
Indicator Description of the incentive
- Risk Index (RI) and Mortality Index (MI) compared to similar roads.
The contract period is extended if the RI and the MI remain below an accident benchmark for similar roads.
More details
- The concessionaire is awarded with one more year of concession if, at least, 90% of time during the first 35 years period of the concession, the mortality index and the risk index remain between 90% and 75% of average value of those toll motorways with similar Average Annual Daily Traffic (AADT) (+/- 5,000 vehicles/day).
- The concessionaire is awarded with two more years of concession if, at least, 90% of time during the first 35 years of the concession, the mortality index and the risk index remain below 75% of average value of those toll motorways with similar Average Annual Daily Traffic (AADT) (+/- 5,000 vehicles/day).
CHARACTERISTICS OF MOTORWAYS IN SPAIN
Three different periods regarding the implementation of motorway concessions in Spain can be identified: from 1967 to 1975, from 1976 to 1995, and from 1996 to the present. Between 1967 and 1975, 2,042 km of toll motorways were granted by the central government of Spain. There are three reasons for the Spanish government’s decision to start a toll motorway programme as a means of expanding and improving the Spanish motorway network. First, the economic growth that Spain experienced during these years prompted a large increase in traffic, which suddenly made better motorways a necessity. Second, the public budget in Spain was unable to sustain such a huge investment, so private funding was the only available way to reach this goal.
The results of the implementation of concession contracts in Spain during this period were rather controversial. On the one hand, motorway concessions achieved the goal of providing the country with a modern motorway network at a time when the public budget of Spain was not sufficient to afford such a huge cost. On the other hand, the guarantees made by the government to facilitate concessions’ funding over time became very costly for the country (Izquierdo and Vassallo, 2004).
The second stage of motorway concessions is from 1976 to 1995. In this period, no motorway concessions were awarded. There were several reasons for this. First, the two petroleum crises in the 1970s destabilized the Spanish economy. Second, after Franco’s death, the political atmosphere in Spain was uncertain. Third, and most important, the Socialist government, which took office in 1982 and remained until 1996, was politically opposed to promoting private concessions as a means to finance motorways. Instead, the socialist government opted for modernizing the Spanish road network by widening and upgrading the most important roads, turning them into dual-roadway fast lanes (autovías) with quality standards set well below those for toll motorways. This new programme was completely funded by the public sector.
The term “autovías” was used in Spain in the early years of 80s for identifying any free motorway with physically separated lanes in each direction. The first autovías in Spain were built by duplicating lanes out of single carriageways. The design standards of these motorways (known as first generation
autovías) had design standards well below those of the toll motorways.
Since 2000 now, the quality standards in the construction of autovías improved notably to make comparable with toll motorways. These are called second generation autovías. At the time, the main difference between toll motorways and autovías is that the legislation prohibits mopeds, tractors and bicycles from entering toll motorways. The first generation autovías and second generation
autovías were built, funded and managed by the Spanish government.
Until recently, the motorway PPPs implemented by the central government of Spain had always been
greenfield tolled motorways. However, a few years ago the central government started implementing concessions for the upgrading, refurbishment, maintaining, and operating existing infrastructure (brownfield projects) through an approach that combined both shadow toll and performance-based payments. The objective of those contracts was to increase the design standards of the first expressways (autovías) built by the Socialist government in the early 1980s and, at the same time, to enhance the quality of their maintenance and operation during the concession period.
Another novelty of the period since 1996 is that not only the Spanish central government, but also the regional and even the local governments have started using the concession approach to implement both toll and shadow-toll motorways. In the late 1980s an important devolution process took place, with the intent of transferring part of the former network of the central government to the regional governments. In addition to that, the regional governments were given greater powers to manage and finance their own networks. This is the reason why many regional governments passed specific legislation intending to implement motorway concessions. From 1996 up to now, the regional governments of Spain (called Comunidades Autónomas) have in total awarded 1,246 km of shadow toll motorways plus 416 km of toll motorways, which means a larger amount of kilometers than the central government awarded in the same period.
Toll motorways in Spain always have a free alternative road. This is the reason why the percentage of heavy good vehicles on toll motorways is much lower than the others types of road operation analyzed in this study.
Apart from road operation, we considered the introduction of incentives in toll and shadow-toll concessions contracts in Spain. As previously explained, Spain begun introducing performance-based indicators linked to bonuses or penalties in toll and shadow toll motorways. These mechanisms are based on indicators related to technical, environmental and safety factors. None of the public motorways (autovías) has economic incentives to improve road safety though the government is committed to building and maintaing the autovías with socially expected quality standards.
LITERATURE REVIEW
This paper analyzes whether the incentives to improve road safety in PPPs are effective. For this purpose, we applied a Poisson regression model for the case of Spain.
The relationships using the Poisson distribution have been developed by means of the technique of Generalized Linear Models (GLMs). The Poisson distribution represents a significant advance to describe traffic accident data. However, it contains certain weaknesses. It assumes that the variance of the dependent variable is equal to its mean but in practice the variance of the traffic accident data tend to be larger than the mean. This extra variation is known as overdispersion and if it is present, the estimated coefficients may result biased and inefficient. In this case, the more indicated model could be the negative binomial regression.
The Poisson and Negative Binomial regression models have been widely used to analyze count data where the dependent variable is discrete and defined for non-negative integers corresponding to the number of events occurring in a given interval (Miaou and Lum, 1993; Noland and Oh, 2004; Chang, 2005; Caliendo et al, 2007; Arenas et al., 2009).
Many studies have found the relationships between accident rates and traffic flow expressed both as Average Annual Daily Traffic (AADT) and as percentage of heavy good vehicles (%HGV). Results showed that accidents rate increases with increasing AADT (Lundy, 1965; Hadi et al., 1995; Hauer, 2004) and %HGV (Hiselius, 2004; Arenas et al., 2009).
Other studies have been carried out in recent years to establish relationships between accident rates with traffic characteristics and the frequency of intersections (Ivan and O’Mara, 1997), with environmental factor (Fridstrøm et al., 1995; Shankar et al., 1995; Chang, 2005; Caliendo et al, 2007), with geometric infrastructure characteristics (Hauer, 2004; Chang, 2005), with number of lanes (Milton and Mannering, 1998; Noland and Oh, 2004; Chang, 2005), with speed limits (Fridstrøm et al. 1995; Ossiander and Cummings, 2002).
This paper focuses on variables related to traffic flow, infrastructure geometry, road operation and incentives given to the PPP contractors. The next section describes the data set used and the process of preparing it for analysis.
DATA
The models that we calibrated in this paper cover only the year 2006. We chose this year because it is the most recent year where a complete database is available. In 2006, there were 12,075 km of high-capacity motorways (Annual Report of the Spanish Ministry of Works, 2006).
The data used for our empirical model came from two different sources: police-reported accident data supplied by the Ministry of Internal Affairs (Ministerio del Interior) and traffic data supplied by the Ministry of Public Works (Ministerio de Fomento). Using these databases we built our final database combining both accident data and traffic data. The population for the models were made up of road stretches of the Spanish high-capacity network both PPP motorways (toll motorways and shadow toll) and public motorways (autovías). The average length of the road stretches is 7km.
Percentage of heavy goods vehicles (%HGV), (2) Number of intersections for each stretch (INT). We also selected two variables that may explain any relation between PPPs and accidents: (4) Road operation (RO) and (5) Incentives (INC). Furthermore, in order to fit the model we considered the vehicle exposure (vk).
Data for AADT, %HGV and vk in stretches was available from the Ministry of Public Works (Traffic Map, 2006). Traffic flow is counted as the number of vehicles through a fixed section in both directions, portable counting instrument and permanent inductive loop were used to count the number of vehicles. The number of intersections for each stretch (INT) was obtained from the Geographic Information Science (GIS), the analyses was performed using ArcGis 9.2. The GIS application was used as a tool to integrate the information in two databases by a common characteristic. The first database included the alphanumeric information about intersections and the second one included geographical information in a digital map of toll motorways and dual carriageways in Spain. Each stretch of the sample was analysed using the GIS application to count the number of intersections.
Data for Road operation (RO) was obtained from the Traffic map 2006 (Ministry of Public Works) and from a research done by Sánchez et al (2006). RO can be: autovías (AV), first generation autovías
(1AV), toll motorways (TM) or shadow toll motorways (ST). TM and ST are PPPs, AV and 1AV are public motorways.
To know which segments had road safety incentives (INC) we analyzed each concession contract in force in 2006. The first Spanish concession contract awarded with implementation of road safety incentives was in 2002. We analyzed all of the contracts from 2002 to 2006.
The vehicle exposure (vk) was measured in millions of vehicle-kilometres as vkj = 365 lj AADTj/106, where AADTj and lj are respectively the average annual daily traffic and length (Km) of road section j obtained from traffic database.
Data for accidents was supplied by the Ministry of Interior (Accidents database, 2006). For this study, the road safety was measured by the number of fatalities, injuries and accidents.
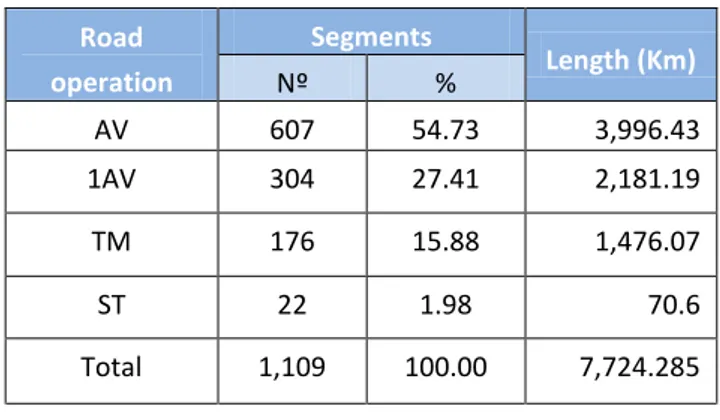
1,109 road segments were extracted out of a total of 6,293 from the 2006 traffic map, after selection criteria based on complete information for traffic flow, infrastructure variables and reported accidents. The study includes PPPs (both toll and shadow-toll motorways) and public motorways (first and second generation autovías). The final data base represents 64% of the total Spanish high-capacity network.
Table 3 Road segment data
Road operation
Segments
Length (Km)
Nº %
AV 607 54.73 3,996.43
1AV 304 27.41 2,181.19
TM 176 15.88 1,476.07
ST 22 1.98 70.6
Total 1,109 100.00 7,724.285
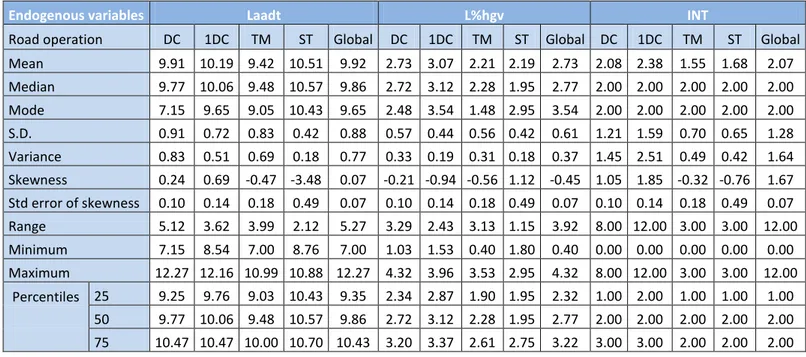
The first descriptive statistics for the traffic variables AADT and %HGV indicated the need to use the logarithm transformation to expand or contract the distances to extreme values. The measures of central tendency take similar values through logarithm transformation. The natural logarithms of the explanatory variables (except for INT) were used to minimize heteroskedasticity. After transformation, the range values (maximum and minimum) of AADT and %HGV variables were greatly reduced. The standard deviation is very low compared with the mean; therefore, the distribution was further improved. However, the logarithm transformation reduced the skewness coefficient and in some cases it was negative. This means that after transformation, the AADT and %HGV variables had a left-skewed distribution and near normal distribution. The chi square goodness of fit test rejects the null hypothesis that the variables follow a normal distribution.
The descriptive statistics after transformation are represented in Table 4. Laadt is the logarithm transformation of AADT and L%hgv is the logarithm transformation of %HGV. The descriptive statistics indicate that there are more heavy good vehicles traffic in public motorways (DC and 1DC) than PPPs (TM and ST). On DC, the range and the variance are higher than 1DC, TM and ST, which indicates more heterogeneity in traffic flow. ST has higher homogeneity compared with the other categories.
The mean traffic intensity (Laadt) is higher on 1DC and ST. The high traffic intensity in ST could be explained because the users do not pay tolls and the motorway has a good quality standard.
Table 4 Descriptive statistics of exogenous variables by road operation. Year 2006.
Endogenous variables Laadt L%hgv INT
Road operation DC 1DC TM ST Global DC 1DC TM ST Global DC 1DC TM ST Global
Mean 9.91 10.19 9.42 10.51 9.92 2.73 3.07 2.21 2.19 2.73 2.08 2.38 1.55 1.68 2.07
Median 9.77 10.06 9.48 10.57 9.86 2.72 3.12 2.28 1.95 2.77 2.00 2.00 2.00 2.00 2.00
Mode 7.15 9.65 9.05 10.43 9.65 2.48 3.54 1.48 2.95 3.54 2.00 2.00 2.00 2.00 2.00
S.D. 0.91 0.72 0.83 0.42 0.88 0.57 0.44 0.56 0.42 0.61 1.21 1.59 0.70 0.65 1.28
Variance 0.83 0.51 0.69 0.18 0.77 0.33 0.19 0.31 0.18 0.37 1.45 2.51 0.49 0.42 1.64
Skewness 0.24 0.69 -0.47 -3.48 0.07 -0.21 -0.94 -0.56 1.12 -0.45 1.05 1.85 -0.32 -0.76 1.67 Std error of skewness 0.10 0.14 0.18 0.49 0.07 0.10 0.14 0.18 0.49 0.07 0.10 0.14 0.18 0.49 0.07
Range 5.12 3.62 3.99 2.12 5.27 3.29 2.43 3.13 1.15 3.92 8.00 12.00 3.00 3.00 12.00
Minimum 7.15 8.54 7.00 8.76 7.00 1.03 1.53 0.40 1.80 0.40 0.00 0.00 0.00 0.00 0.00
Maximum 12.27 12.16 10.99 10.88 12.27 4.32 3.96 3.53 2.95 4.32 8.00 12.00 3.00 3.00 12.00
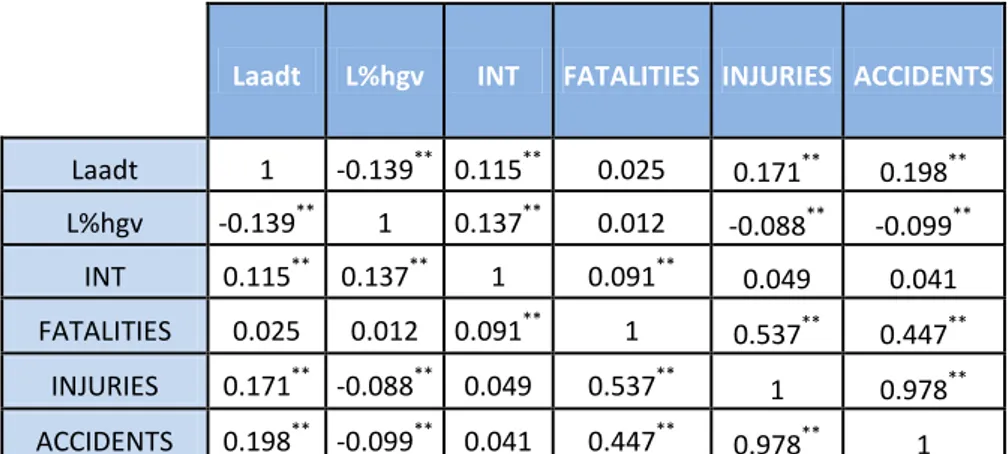
Table 5 Correlations between variables.
Laadt L%hgv INT FATALITIES INJURIES ACCIDENTS
Laadt 1 -0.139** 0.115** 0.025 0.171** 0.198**
L%hgv -0.139** 1 0.137** 0.012 -0.088** -0.099**
INT 0.115** 0.137** 1 0.091** 0.049 0.041
FATALITIES 0.025 0.012 0.091** 1 0.537** 0.447**
INJURIES 0.171** -0.088** 0.049 0.537** 1 0.978**
ACCIDENTS 0.198** -0.099** 0.041 0.447** 0.978** 1
** p<0.01
METHODOLOGY AND RESULTS
The Poisson regression described in the previous section was used to determine the relationship between fatalities, injuries and accidents and traffic variables, number of intersections for each stretch, road operation and road safety incentives. The interaction between traffic and road operation were included in the last models.
We have estimated Poisson regression models. The general equation in a segment j, road operation
and the incentives systems to the concessionaire is:
Where:
is the expected number of fatalities is the Average Annual Daily Traffic
is the Percentage of heavy goods vehicles is the number of intersections for each stretch
is Road operation which could be toll motorway, shadow toll, first generation autovía
and second generation autovía.
reflects the introduction of road safety incentives in the stretch analysed
is the interaction variable between Average Annual Daily Traffic and Road
operation
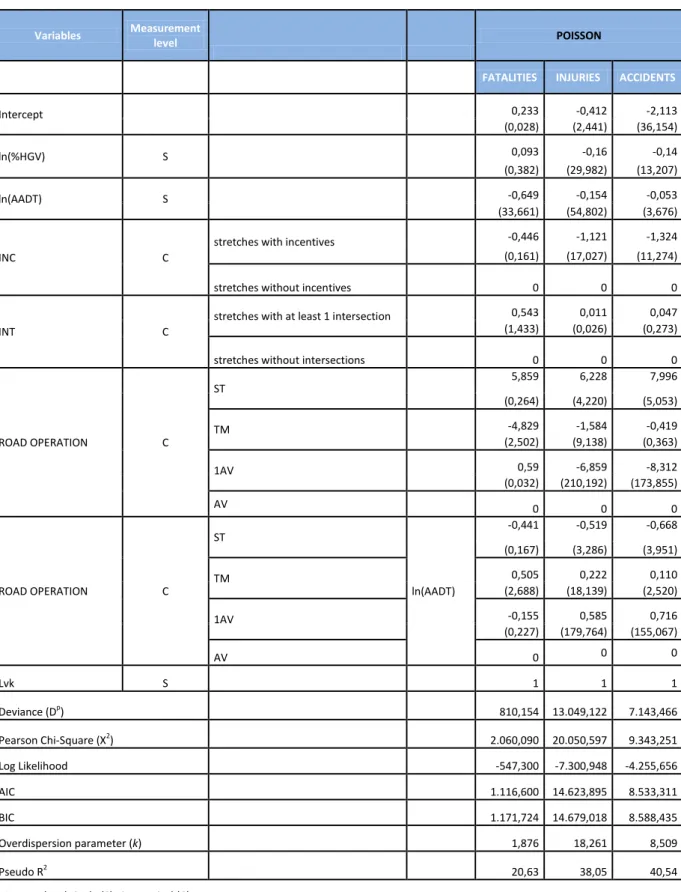
Table 6 summarizes the models we have calibrated. Each column refers to a model with the endogenous variables and every row to exogenous variables. We introduced interactions among variables in some models. There is a estimated coefficient for each variable. The significance of coefficients was checked using Wald statistic, which rejects the null hypothesis that the coefficient is zero with a level of 95% confidence. Different goodness-of-fit statistics were analyzed, including deviance and Pearson chi-square statistics. Additionally, defined as:
where and are the sample size and the parameter number, respectively, is the deviance of the model with no covariates, and is the deviance of the model with parameters.
Other measures were also evaluated such as Akaike Information Criterion (AIC) (Akaike, 1974) and the Bayesian Information Criterion (BIC) (Schwarz, 1978).
After analyzing Table 6, we could highlight the following results:
1. The AADT is the predictor variable most significant of the fatalities in the road segment of this study and its influence depends on the road operation. The percentage of heavy good vehicles is the second most significant predictor variable.
2. Models show that the road operation variable has an influence on the interaction with AADT, which indicates that there is a differentiated behavior among toll and shadow motorways, second generation autovías and first generation autovías.
3. The coefficient signs of INC variable (incentives systems to the concessionaire) do not change. There are more fatalities, injuries and accidents on road segments without incentives when they are compared with other segments with incentives. The results indicate that INC variable have an influence on road safety. For the injuries and accident models this variable is very significant.
4. The INT (intersection) variable presented influence on fatalities, injuries and accidents. We build discrete variable of INT: discrete value with 2 levels (stretch with at least 1 intersection and stretch without intersections). There is no change in the sign of the parameter.
Table 4. Poisson regression models for fatalitites, injuries and accidents.
Variables Measurement level
POISSON
FATALITIES INJURIES ACCIDENTS
Intercept 0,233 -0,412 -2,113
(0,028) (2,441) (36,154)
ln(%HGV) S
0,093 -0,16 -0,14
(0,382) (29,982) (13,207)
ln(AADT) S
-0,649 -0,154 -0,053
(33,661) (54,802) (3,676)
INC C
stretches with incentives -0,446 -1,121 -1,324
(0,161) (17,027) (11,274)
stretches without incentives 0 0 0
INT C
stretches with at least 1 intersection 0,543 0,011 0,047
(1,433) (0,026) (0,273)
stretches without intersections 0 0 0
ROAD OPERATION C
ST
5,859 6,228 7,996
(0,264) (4,220) (5,053)
TM -4,829 -1,584 -0,419
(2,502) (9,138) (0,363)
1AV 0,59 -6,859 -8,312
(0,032) (210,192) (173,855)
AV 0 0 0
ROAD OPERATION C
ST
ln(AADT)
-0,441 -0,519 -0,668
(0,167) (3,286) (3,951)
TM 0,505 0,222 0,110
(2,688) (18,139) (2,520)
1AV -0,155 0,585 0,716
(0,227) (179,764) (155,067)
AV 0 0 0
Lvk S 1 1 1
Deviance (Dp) 810,154 13.049,122 7.143,466
Pearson Chi-Square (X2) 2.060,090 20.050,597 9.343,251
Log Likelihood -547,300 -7.300,948 -4.255,656
AIC 1.116,600 14.623,895 8.533,311
BIC 1.171,724 14.679,018 8.588,435
Overdispersion parameter (k) 1,876 18,261 8,509
Pseudo R2 20,63 38,05 40,54
CONCLUSIONS AND FUTURE RESEARCH
The main conclusions of this paper are the following:
The implementations of safety incentives linked to performance-based indicators in PPP contracts is becoming more and more popular.
In order to encourage road operators to improve safety outcomes beyond the expected standards, incentives should include bonuses and not only penalties.
Regarding the specific model for the case of Spain, we found that:
Some variables such as the AADT and the percentage of heavy vehicles, which are not manageable by the contractor, are the most significant predictors of fatalities, injuries and accidents.
The implementation of incentives in PPP contractors has a positive influence on road safety in such a way that there are more fatalities, injuries and accidents on road segments without incentives than in road segments with incentives.
The writing of this paper was primarily motivated by the need to quantify the safety incentives given to the PPP contractor effects on accidents, for the first time for Spanish motorways. Since we have built an extensive database, with information for some years and other variables, which we have not fully tested yet, such as climatic, we are working on new models to obtain further results.
References
Accidents database (2006). Dirección General de Tráfico, Spain.
Akaike, H. (1974). A new look at the statistical model identification. IEEE Trans. Automat. Control 19: 716–723.
Annual Report of the Spanish Ministry of Works (2006).
Arenas, B., Aparicio, F., González, C., Gómez, A. (2009). The influence of heavy good vehicle traffic on accidents on different types of Spanish interurban roads. Accident Analysis and Prevention, 41, 15-24.
Chang, L.Y. (2005). Analysis of freeway accident frequencies: negative binomial regression versus artificial neural network. Safety Science 43, 541-557.
Debande, O. (2002). Private financing of transport infrastructure. An assessment of the UK experience. Journal of transport Economics and Policy, Vol. 36, pp. 355-387.
Delgado, C. Vassallo, J.M., Sánchez, A. (2007). Aplicación de Indicadores de Calidad en concesiones de carreteras en España. Carreteras, Vol. 151, pp. 53-68.
Fridstrøm, L., Ifver, J., Ingebrigtsen, S., Kumala, R., Krogsgard Thomsen, L., (1995). Measuring the contribution of randomness, exposure, weather, and daylight to the variation in road accident counts. Accident Analysis and Prevention, 27, 1–20.
OECD (2008). Transport Infrastructure Investment: Options for Efficiency. International Transport Forum: Paris, France.
Hadi, M.A., Aruldhas, J., Chow, L., Wattleworth, J.A. (1995). Estimating safety effects of cross-section design for various highway types using Negative Binomial regression. Transp. Res. Rec., 1500.
Hakim, S., Shefer, D., Hakkert, A., Hocherman, I. (1991). A critical review of macro models for road accidents. Accident Analysis and Prevention, 23 (5), 379–400.
Hiselius, L.W. (2004). Estimating the relationship between accident frequency and homogeneous and inhomogeneous traffic flows. Accident Analysis and Prevention, 36, 985–992.
Informe 2006 sobre el sector de autopistas de peaje en España. Delegación del Gobierno en las Sociedades Concesionarias de Autopistas Nacionales de Peaje. Ministerio de Fomento.
Ivan, J., O’Mara, P. (1997). Prediction of traffic accident rates using Poisson regression. 76th Annual Meeting of the Transportation Research Board. Washington, D.C. Paper No. 970861.
Izquierdo, R. and Vassallo, J.M. (2004). Nuevos sistemas de gestión y financiación de infraestructuras de transporte. Colegio de Ingenieros de Caminos, Canales y Puertos, Madrid.
Jovanis, P., Chang, H. (1986). Modeling the relationship of accident to mile travelled. Transportation Research Record, 1068, 42–51.
Lundy, Richard A. (1965). Effect of Traffic Volumes and Number of Lanes on Freeway Accident Rates. Highway Res. Record 99: 138–56.
Miaou, S.P., Hu, P.S., Wright, T., Rathi, A.K., Davis, S.C. (1992). Relationship between truck accidents and highway geometry design: a Poisson regression approach. Transportation Research Record 1376, TRB, National Research Council, Washington, DC, pp. 10–18.
Milton, J., Mannering, F. (1998). The relationship among highway geometrics, traffic-related elements and motor vehicle accident frequencies, Transportation 25 (4) (1998), pp. 395–413.
Noland, R.B., Oh, L. (2004). The effect of infrastructure and demographic change on traffic-related fatalities and crashes: a case study of Illinois county-level data. Accident Analysis & Prevention 36, 525-532.
Ossiander, E.M., Cummings, P. (2002). Freeway speed limits and traffic fatalities in Washington State. Accident Analysis and Prevention 34, 13-18.
Sánchez, A., Vassallo, J.M., Castroman, A., Delgado, C. (2006). Nuevo modelo de gestión concesional en autovías de primera generación. ETSI Caminos, Canales y Puertos. Universidad Politécnica de Madrid. Ministerio de Fomento.
Schwarz, G., (1978). Estimating the dimension of a model. The Annals of Statistics 6, 461-464.
Shankar, V., Mannering, F., Barfield,W., 1995. Effect of roadway geometrics and environmental factors on rural freeway accidents frequencies. Accident Analysis and Prevention 27 (3), 371–389.
Traffic Map, 2006. Ministerio de Fomento. Dirección General de Carreteras, Madrid, Spain.
Vassallo, J.M. (2007). Implementation of quality criteria in tendering and regulating infrastructure management contracts. Journal of Construction Engineering and Management, Vol. 133 (8), 553-561.
Vassallo, J.M. and Gallego, J. (2005). Risk-sharing in the New Public Works Concession Law in Spain. Transportation Research Record, 1932, pp. 1-8.
Vassallo, J.M. and Pérez de Villar, P. (2010). Diez años de peaje sombra en España. Revista de Obras Públicas (forthcoming).