Capillary electrophoresis for the analysis of short chain organic acids in coffee / V Galli and C Barbas
8
0
0
Texto completo
(2)
(3) Journal of Chromatography A, 1032 (2004) 299–304. Capillary electrophoresis for the analysis of short-chain organic acids in coffee Verónica Galli, Coral Barbas∗ Facultad de CC. Experimentales y de la Salud, Universidad San Pablo-CEU, Urbanización Monteprı́ncipe, Boadilla del Monte, 28668 Madrid, Spain. Abstract A simple and rapid capillary electrophoresis method for low-molecular mass carboxylic acids measurement in coffee has been optimised and validated. Regarding separation conditions, phosphate concentration in the background electrolyte, surfactant type [cetyltrimethylammonium bromide (CTAB), tetradecyltri methylammonium bromide (TTAB) and hexadimethrine bromide (HDB)], percentages of organic modifier and pH were assayed. The best conditions were: 500 mM phosphate buffer at pH 6.25 with CTAB 0.5 mM. The separation was carried out with an uncoated fused-silica capillary (57 cm × 50 m i.d.) which was operated at −10 kV potential. Detection was performed at 200 nm. In such conditions 17 short-chain organic acids: oxalic, formic, fumaric, mesaconic, succinic, maleic, malic, isocitric, citric, acetic, citraconic, glycolic, propionic, lactic, furanoic, pyroglutamic, quinic acids plus nitrate were separated, identified and measured. Validation parameters of the method allow us to consider it lineal, accurate and precise and, therefore, reliable for its employment in food composition studies or for quality control. Results in coffees with different industrial treatment allow the detection of important differences in the organic acid profile. © 2003 Elsevier B.V. All rights reserved. Keywords: Coffee; Food analysis; Beverages; Organic acids. 1. Introduction A primary coffee taste sensation is acidity. Lowmolecular-mass (low-Mr ) organic acids contribute to both taste and flavour, as most of them are volatile. The acids found in roasted coffee may be classified into four groups: aliphatic, chlorogenic, alicyclic and phenolic acids [1]. The acidity or sourness of coffee brews has (together with aroma and bitterness) always been recognised as an important attribute of their sensory quality. In general, the acids present in coffee are responsible for about 11% of the green coffee beans’ mass and for 6% of roasted coffee beans’ mass [2]. Especially in high-quality beans (arabica), roasted to light or medium roast degrees, a major taste is sourness [3]. Organic acids in green and roasted coffee have been determined by several procedures, mainly GC and HPLC. A comprehensive review of the work carried out on the subject has been recently given by Balzer [4]. Even more recently, Jham et al. have compared the performance of GC. ∗. Corresponding author. Fax: +34-91-35-10475. E-mail address: [email protected] (C. Barbas).. 0021-9673/$ – see front matter © 2003 Elsevier B.V. All rights reserved. doi:10.1016/j.chroma.2003.09.028. and HPLC for the quantification of organic acids in coffee [5]. They concluded that the GC method was unsuitable for studies including a large number of samples, since it is very tedious, while an HPLC method which employed an ion-exchange column and a flow gradient with UV detection at 210 nm was found to be much simpler, but in real samples only four acids were detectable (citric, quinic, malic and fumaric acids). Trying to respond to the lack of rapid and simple analytical methods for short-chain organic acids in complex matrices, Weers et al. developed a method with a technique very well suited for this purpose: capillary electrophoresis (CE) [6]. They employed indirect detection and a surfactant to reverse the electroosmotic flow. CE has proved to be a good choice for the investigation of low-molecular-mass organic acids in complex aqueous samples [7,8] with high efficiency and minimum sample pre-treatment. Our work group has been working for a long time with short-chain organic acids in matrices as different and complex as natural latex serum [9,10], urine [7,11,12], wine [13] or orange juices [8]. A comprehensive survey of capillary electrophoresis methods developed for the measurement of short-chain organic acids and inorganic anions in a wide variety of matrices has been recently published.
(4) 300. V. Galli, C. Barbas / J. Chromatogr. A 1032 (2004) 299–304. [14]. In our experience direct UV detection provides higher sensitivity and precision in real samples and the ability to detect UV absorbing organic acids, such as oxalic, fumaric or pyroglutamic, which cannot be detected with the indirect system [13]. Other authors have similar results [15]. The objectives of the present work were the identification of small carboxylic acids in coffee extracts, optimisation of the sample preparation and separation conditions by reversed polarity CE with direct UV detection, validation of the method and application to several coffee extracts.. 2. Materials and methods 2.1. Instrumentation The separation was performed on a capillary electrophoresis MDQ (Beckman) with UV detection at 200 nm. The injection was by pressure (0.035 bar) for 5 s. The separation was carried out with an uncoated fused-silica capillary (57 cm × 50 m i.d.) and was operated at −10 kV potential. Temperature was maintained at 25 ◦ C. The background electrolyte was prepared with 0.5 M H3 PO4 , 0.5 mM CTAB, as cationic surfactant to decrease electroosmotic flow, and pH adjusted by adding NaOH to 6.25. The current generated in such conditions was 115 A. The capillary was flushed between runs with 0.1 M NaOH for 3 min, H2 O for 3 min and the background electrolyte for 5 min. Several parameters were studied during the optimization of the method, such as pH and concentration of the background electrolyte (BGE) ranging from 5.5 to 6.5 and from 400 to 600 mM, respectively with small increments. Temperature from 20 to 30 ◦ C, the presence of methanol and acetonitrile as organic modifiers, the addition of CaCl2 as complexing agent and the employment of different surfactants [cetyltrimethylammonium bromide (CTAB), tetradecyltrimethylammonium bromide (TTAB) and hexadimethrine bromdie (HDB)] were also tested.. During the optimization different extraction methods were tested related to the coffee/water ratio as well as mechanical extraction, and focussed and bath sonication. 2.4. Validation Individual stock solutions of each organic acid 20–130 mM in purified water were prepared and stored at −20 ◦ C with this concentration. On the day of the analysis they were adequately diluted. Linearity of response for standards was tested assaying by triplicate using six levels of concentrations, ranging from 0.125 to 0.5 mM for nitrate, citraconic and furanoic; from 0.25 to 1 mM for oxalic; from 2 to 8 mM for formic; from 0.025 to 0.1 mM for maleic; from 0.06 to 0.24 mM for fumaric and mesaconic; from 0.5 to 2 mM for succinic and lactic; from 0.75 to 3 mM for malic and isocitric; from 1 to 4 mM for citric, propionic and quinic; from 1.5 to 6 mM for acetic and glycolic and from 0.05 to 1 mM for pyroglutamic acids. Recovery was estimated comparing the values obtained in the linearity test for spiked samples with the corresponding standards linearity, taking into account the coffee concentrations, which had been previously quantified. Within-day precision was tested both to check the constancy of instrumental response to a given analyte and the repetitiveness of concentrations. For this purpose, the assay was performed with ten solutions of standards and 10 of samples, in the medium concentration of the calibration curve for all the compounds. Limits of detection (LODs) were calculated following IUPAC recommendations [(a + 3SB )/b] where a is the intercept, b is the slope and SB is the standard deviation of the blank, for chromatographic methods [16] by extrapolating to zero concentration the standard deviation of the last three points of linearity and interpolating this value in the corresponding equation.. 3. Results and discussion 2.2. Chemicals 3.1. Extraction of samples Standards were obtained from Sigma (St. Louis, MO, USA). Phosphoric acid 85% was from Merck (Darmstadt, Germany), sodium hydroxide from Panreac (Madrid, Spain) and organic solvents from Scharlau (Barcelona, Spain). 2.3. Samples Samples of coffee with different origins and treatment were obtained from different brands available on the market. The extraction process consisted in mechanical shaking of 1 g of coffee with particle size under 0.4 mm with 10 ml of purified water for 10 min. Then, samples were centrifuged at 2700 rpm for 5 min. All sample solutions were filtered through 0.22 m nylon filters prior to analysis.. Concerning extraction, three levels of particle sizes were tested: under 0.2 mm, between 0.4 and 0.2 mm and over 0.4 mm. Three replicates of each fraction were analysed and data were statistically tested with one-way analysis of variance (ANOVA) (P < 0.05). It was observed that particle size presented little influence on extraction once it was under 0.4 mm and that was the size established for the samples. Focussed sonication, bath sonication and mechanical shaking were also compared by their extraction ability finding no difference in the results and therefore, mechanical shaking was selected. Coffee/water ratios ranging from 0.5 g/10 ml to 5 g/10 ml were also tested with different injection times in capillary electrophoresis to obtain higher efficiency not.
(5) V. Galli, C. Barbas / J. Chromatogr. A 1032 (2004) 299–304. 301. Table 1 Main validation parameters for linearity and accuracy Linearity. Accuracy: recovery ± R.S.D. (%). Standards. Nitrate Oxalate Formate Fumarate Mesaconate Succinate Maleate Malate Isocitrate Citrate Acetate Citraconate Glycolate Propionate Lactate Furanoate Pyroglutamate Quinate 1 2. Sample. Range (mM) a1 ± LC. b2 ± LC. 0.125–0.500 −0.22 ± 0.07 0.250–1.000 −0.03 ± 0.04 2.000–8.000 0.01 ± 0.02 0.060–0.240 −0.02 ± 0.03 0.060–0.240 0.04 ± 0.03 0.500–2.000 −0.01 ± 0.02 0.025–0.100 0.05 ± 0.1 0.750–3.000 0.22 ± 0.15 0.750–3.000 −0.1 ± 0.1 1.000–4.000 −0.04 ± 0.04 1.500–6.000 0.006 ± 0.025 0.125–0.500 −0.34 ± 0.07 1.500–6.000 −0.002 ± 0.03 1.000–4.000 0.26 ± 0.2 0.500–2.000 0.02 ± 0.02 0.125–0.500 −0.07 ± 0.10 0.050–1.000 −0.04 ± 0.06 1.000–4.000 −0.001 ± 0.02. 4.6 1.59 0.073 8.04 6.3 0.45 4.8 0.42 0.80 0.92 0.191 6.6 0.198 0.26 0.32 3.6 4.7 0.569. ± ± ± ± ± ± ± ± ± ± ± ± ± ± ± ± ± ±. 0.2 0.05 0.004 0.02 0.2 0.02 1.5 0.08 0.06 0.01 0.006 0.2 0.008 0.07 0.01 0.3 0.1 0.009. Standards Samples. Mr. Range (mM) a1 ± LC. b2 ± LC. 0.997 0.998 0.995 0.999 0.998 0.998 0.885 0.958 0.993 0.999 0.998 0.999 0.998 0.913 0.998 0.991 0.999 0.996. 0.123–0.499 −0.25 ± 0.07 4.8 ± 0.2 0.161–0.907 −0.04 ± 0.03 1.69 ± 0.03 1.833–7.847 −0.01 ± 0.02 0.079 ± 0.003 0.070–0.250 −0.08 ± 0.03 8.8 ± 0.2 0.038–0.219 0.009 ± 0.02 7.3 ± 0.2 0.070–1.120 −0.03 ± 0.02 0.63 ± 0.03 0.015–0.090 0.02 ± 0.1 4.31 ± 1.8 0.550–2.800 −0.02 ± 0.12 0.54 ± 0.07 0.559–2.810 −0.07 ± 0.09 0.76 ± 0.05 1.612–4.585 −0.14 ± 0.05 0.98 ± 0.02 2.643–7.153 −0.04 ± 0.04 0.203 ± 0.007 0.141–0.517 −0.35 ± 0.06 9.7 ± 0.2 0.565–5.060 −0.009 ± 0.02 0.221 ± 0.006 0.422–3.415 −0.05 ± 0.05 0.33 ± 0.02 0.196–1.699 0.004 ± 0.06 0.37 ± 0.05 0.073–0.449 −0.007 ± 0.03 3.6 ± 0.1 0.418–1.165 −0.2 ± 0.2 5.1 ± 0.3 2.984–5.998 −0.3 ± 0.2 0.60 ± 0.04. Mr 0.996 0.999 0.997 0.999 0.999 0.997 0.778 0.973 0.993 0.999 0.998 0.999 0.998 0.990 0.963 0.999 0.995 0.994. 100 100 100 100 100 100 99 99 101 100 100 100 100 96 100 101 101 100. ± ± ± ± ± ± ± ± ± ± ± ± ± ± ± ± ± ±. 4 3 4 2 3 3 22 12 5 1 2 2 4 26 3 8 4 2. 100 100 99 100 100 98 92 101 100 100 100 100 101 99 100 100 100 99. ± ± ± ± ± ± ± ± ± ± ± ± ± ± ± ± ± ±. 3 3 4 2 2 7 40 11 6 1 2 2 6 8 17 2 4 3. Intercept. Slope.. only with extraction but also with the separation technique. The best option was 1 g of coffee/10 ml purified water. 3.2. Optimization of BGE The optimization strategy started with our experience on short-chain organic acid analysis in different matrices quoted previously and it was addressed towards small variations to. obtain maximum resolution between the acids present in this type of samples and the possible interferences. With this objective pH was varied from 5.5 to 6.5 with 0.25 increments and pH 6.25 gave the best results. Phosphate concentration was tested from 400 to 600 mM. These values are high for usual practice in capillary electrophoresis, but currents are maintained under acceptable limits and it is necessary to give sufficient resolution of analytes while. Table 2 Main validation parameters for precision. Nitrate Oxalate Formate Fumarate Mesaconate Succinate Maleate Malate Isocitrate Citrate Acetate Citraconate Glycolate Propionate Lactate Furanoate Pyroglutamate Quinate. Instumental precision. Sample precision. Standards. Day 1. LOD (mM) Day 2. Intermediate. Media (mM). R.S.D. (%). Media (mM). R.S.D. (%). Media (mM). R.S.D. (%). Media (mM). R.S.D. (%). 0.250 0.500 4.000 0.120 0.120 0.756 0.050 1.498 1.499 1.999 2.989 0.250 3.004 1.995 0.995 0.250 0.501 1.997. 1.9 5.0 6.2 1.7 1.3 2.5 22.8 7.9 2.9 1.5 2.5 2.3 1.9 9.6 3.2 2.8 1.4 2.0. 0.151 0.247 3.382 0.136 0.082 0.138 0.055 0.940 0.941 2.957 5.077 0.193 1.114 0.333 0.398 0.113 0.731 5.499. 3.2 3.6 4.0 2.0 2.0 28.0 11.0 11.0 7.0 2.0 2.0 3.0 7.0 19.0 10.0 9.0 3.0 3.0. 0.143 0.245 3.482 0.131 0.077 0.129 0.058 0.859 0.913 2.843 5.050 0.185 1.312 – 0.348 0.120 0.750 5.451. 6.4 6.3 5.4 2.6 3.4 29.3 5.7 11.0 8.6 3.8 9.1 2.0 7.3 – 8.2 6.8 2.9 3.4. 0.147 0.246 3.432 0.134 0.080 0.133 0.057 0.904 0.927 2.900 5.063 0.188 1.208 – 0.369 0.117 0.740 5.475. 5.4 5.0 4.8 2.8 4.2 28.4 8.9 11.8 8.0 3.6 6.4 3.0 10.9 – 11.0 7.9 3.0 3.3. Standards. Sample. 0.10 0.71 107.26 0.02 0.04 1.28 0.004 1.45 1.12 1.26 5.00 0.02 32.16 6.56 3.83 0.09 0.23 10.67. 0.06 0.44 156.01 0.01 0.01 1.21 0.003 1.49 1.11 0.41 17.59 0.03 3.58 0.15 2.01 0.11 0.12 7.66.
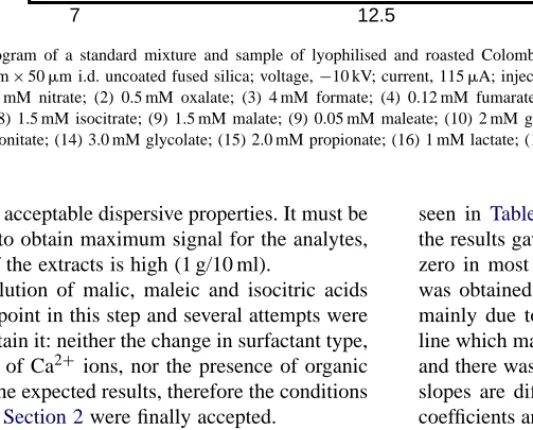
(6) 302. V. Galli, C. Barbas / J. Chromatogr. A 1032 (2004) 299–304. 0.02 AU. Lyophilised coffee. Roasted coffee 89 7 1. 7. 2 3. 4. 12. 56 10 11. 13. 16. 14. 15. 12.5. Standards 17. 18. 19. 17.5. min. Fig. 1. Electropherogram of a standard mixture and sample of lyophilised and roasted Colombian coffee. Buffer, 500 mM H3 PO4 , CTAB 0.5 mM pH 6.25; capillary, 57 cm × 50 m i.d. uncoated fused silica; voltage, −10 kV; current, 115 A; injection for 5 s; detection wavelength, 200 nm; concentration each peak: (1) 0.25 mM nitrate; (2) 0.5 mM oxalate; (3) 4 mM formate; (4) 0.12 mM fumarate; (5) 0.12 mM mesaconitate; (6) 1.0 mM succinate; (7) 0.05 mM maleate; (8) 1.5 mM isocitrate; (9) 1.5 mM malate; (9) 0.05 mM maleate; (10) 2 mM glutarate (I.S.); (11) 2.0 mM citrate; (12) 3.0 mM acetate; (13) 0.25 mM citraconitate; (14) 3.0 mM glycolate; (15) 2.0 mM propionate; (16) 1 mM lactate; (17) 0.25 mM furanoate; (18) 0.5 mM pyroglutamate; (19) 2.0 mM quinate.. still maintaining acceptable dispersive properties. It must be considered that to obtain maximum signal for the analytes, concentration of the extracts is high (1 g/10 ml). Baseline resolution of malic, maleic and isocitric acids was the critical point in this step and several attempts were performed to obtain it: neither the change in surfactant type, nor the addition of Ca2+ ions, nor the presence of organic modifiers gave the expected results, therefore the conditions described in the Section 2 were finally accepted. 3.3. Validation Prior to validation several internal standards were tested: glutamic, oxalacetic, phtalic, benzoic, suberic, gentisic and many other acids. Glutaric acid was the only compound with intermediate migration time and it did not overlap with other peaks in the electropherogram. Calculi described in the manuscript have been performed including the internal standard, but small differences were found when it was omitted (data not shown). Once the compounds present in the sample were identified by migration time as compared with the standards and by spiking, selectivity was proved by injecting acids very close in migration time. The high efficiency obtained in capillary electrophoresis permits the clear separation of most of them. All the calculi were performed with peak areas. Linearity has been determined by a series of three replicates of six levels of standards whose concentrations span 10–200% of the expected concentration range. As can be. seen in Table 1, the linear regression equation applied to the results gave an intercept not significantly different from zero in most cases. When a significant non-zero intercept was obtained (nitrate, mesaconate and citraconate), it was mainly due to the good fit of the points to the regression line which made the limits of confidence (LCs) very narrow and there was no effect on the accuracy of the method. The slopes are different from zero in all cases and correlation coefficients are over 0.99 in all cases, except for maleic and malic acids which were not baseline resolved and propionic acid, which is very close to a system peak and its integration is difficult. Samples linearity is also adequate for the same reason, but this experiment was mainly developed to study the recoveries. All the recoveries include 100% and R.S.D.s presented very adequate values with exception of maleic and propionic acids again. These two compounds presented high R.S.D.s for instrumental precision too, as shown in Table 2. Intra-assay precision of the method for samples gave R.S.D.s ranging 2–10% not considering succinate due to the low concentration found in samples which is under the limit of quantification and propionic acid. The latter was even lost in the second day of analysis. On two different days, R.S.D. values were very similar including the problem with the low levels of oxalate. Summarising all the values can be considered adequate for the levels of analytes and characteristics of the method, except for propionic and maleic acids which can be identified but quantification is poor. With the final conditions described above oxalic, formic, fumaric, mesaconic, succinic, maleic, malic, isocitric, citric,.
(7) Table 3 Results obtained for LWM organic acids with the CE method and values found in literature for these acids with different techniques and by different authors Concentration (mg/g). Nitrate Oxalate Formate Fumarate Mesaconate Succinate Maleate Malate Isocitrate Citrate Acetate Citraconate Glycolate Propionate Lactate Furanoate Pyroglutamate Quinate. n.d. 0.256 ± 0.005 2.7 ± 0.2 0.206 ± 0.008 0.077 ± 0.002 0.18 ± 0.02 0.102 ± 0.009 2.2 ± 0.1 1.3 ± 0.1 10.1 ± 0.3 7.3 ± 0.3 0.26 ± 0.02 1.69 ± 0.06 0.06 ± 0.02 0.72 ± 0.08 0.15 ± 0.01 0.85 ± 0.05 9.4 ± 0.5. Lyophilised Colombian coffee by CE. 0.079 ± 0.007 0.17 ± 0.01 8.1 ± 0.2 1.14 ± 0.03 0.41 ± 0.01 0.80 ± 0.07 0.46 ± 0.04 5.7 ± 0.3 18.3 ± 0.9 14.4 ± 0.9 14.4 ± 0.5 0.82 ± 0.07 4.0 ± 0.3 n.d. 2.1 ± 0.3 0.50 ± 0.01 8.8 ± 0.4 44 ± 2. Colombian Arabicas by CE [6]. 2.28–2.53. Commercial roasted and ground coffee samples by HPLC-UV [18]. Commercial roasted and ground coffee samples by GC after silylation (mg/g) [19]. 1.8–2.5. 2.01 0.12 0.08 0.07 0.09 2.16. 0.25–0.36. 1.9–8.0. 2.00–3.29. 1.0–3.9. 6.34–11.10 3.76–4.98. 4.3–7.0 3.6–5.5. 1.28–2.02. 1.7–4.9. 0.73–1.35. 0.0–1.8. 8.81–9.12. 8.9–15.0. 6.72 5.15 0.54 1.32 0.88 0.14 0.87 7.93. Commercial roasted and ground coffee samples by GC/MS after silylation and pre-concentration with free flow step electrophoresis [20–22] Range. Soluble. 0.086–0.108 0.029–0.054 0.053–0.067 0.055–0.070. 0.553 0.269 0.27 0.286. 0.233–0.332 0.540–1.360. 0.798 1.892. 0.330–0.617 0.064–0.105. 1.443 0.328. V. Galli, C. Barbas / J. Chromatogr. A 1032 (2004) 299–304. Roasted Colombian coffee by CE. 303.
(8) 304. V. Galli, C. Barbas / J. Chromatogr. A 1032 (2004) 299–304. acetic, citraconic, glycolic, propionic, lactic, furanoic, pyroglutamic and quinic acids plus nitrate ion were identified in the electrophoretic profile. Fig. 1 shows the electropherogram of standards and two types of coffee: roasted and lyophilised Colombian coffee. Table 3 shows the values obtained for low-Mr organic acids in these samples as compared with the values obtained in literature by different authors, techniques and samples. The CE values were obtained for five replicates of each type of coffee (roasted and lyophilised) from extraction to measurement. Among our results, pyroglutamic acid presents special interest. It is an amino acid naturally occurring in vegetables, but never described in roasted coffee; on the contrary, it is generally affirmed that no free amino acids are still present in coffee after roasting [17]. Pyroglutamate is known to have a number of remarkable cognitive enhancing effects, which could be also related to the properties of coffee traditionally associated with caffeine. Pyroglutamate is greatly increased in the lyophilised coffee and probably that increase is related to some stage of the industrial process, which ought to be considered.. 4. Conclusions Acidity of coffee beverages is an important feature in terms of their appreciation by the consumers and it is greatly modified not only by the type of coffee beans but also by the industrial processes. A capillary electrophoresis method has been developed that permits the direct measurement of 17 short-chain organic acids in coffee extracts. It is simple, rapid and reliable and, therefore, it is suitable to be applied in routine or studies with a high number of samples to be measured. When it was applied to commercial coffees, important differences were observed in some of these compounds due to the industrial treatment of coffee. This CE method could be a valuable tool to increase the knowledge in the area.. Acknowledgements This study was supported by the San Pablo-CEU project 03/01. References [1] R.J. Clarke, Dev. Food Sci. 3B (1986) 1. [2] H.G. Maier, in: Proceedings of the 12th ASIC Colloquium, Montreux, 1987, p. 229. [3] M. Clifford, Tea Coofee Trade F. 8 (1989) 35. [4] H.H. Balzer, in: R.J. Clarke, O.G. Vitzthum (Eds.), Coffee: Recent Developments, Blackwell Scientific Publications, UK, 2001, p. 18. [5] G.N. Jham, S.A. Fernandes, C.F. Garcia, A. Arujo da Silva, Phytochem. Anal. 13 (2002) 99. [6] M. Weers, H. Balzer, A. Bradbury, G. Vitzthum, in: Proceedings of the16th ASIC Colloquium, Kyoto, 1995, p. 218. [7] A. Garcı́a, C. Barbas, R. Aguilar, M. Castro, Clin. Chem. 44 (1998) 1905. [8] L. Saavedra, A. Garcı́a, C. Barbas, J. Chromatogr. A 881 (2000) 395. [9] V. Galli, N. Olmo, C. Barbas, J. Chromatogr. A 894 (2000) 135. [10] V. Galli, N. Olmo, C. Barbas, J. Chromatog. A 949 (2002) 367. [11] C. Barbas, N. Adeva, R. Aguilar, M. Rosillo, T. Rubio, M. Castro, Clin. Chem. 44 (1998) 1340. [12] C. Barbas, A. Garcı́a, L. Miguel, C. Simó, J. Chromatogr. B 780 (2002) 73. [13] L. Saavedra, C. Barbas, Electrophoresis 24 (2003) 2235. [14] V. Galli, A. Garcı́a, L. Saavedra, C. Barbas, Electrophoresis 24 (2003) 1951. [15] D. Volgger, A.J. Zemann, G.K. Bonn, M.J. Antal Jr., J. Chromatogr. A 758 (1997) 263. [16] G.L. Long, J.D. Winefordner, Anal. Chem. 55 (1983) 712. [17] S. Homma, R.J. Clarke, O.G. Vitzthum (Eds.), Coffee: Recent Developments, Blackwell Scientific Publishers, Great Britain, 2001, p. 50. [18] G.H.D. van der Stegen, J. Duijin, in: Proceedings of the12th ASIC Colloquium, Montreux, 1987, p. 238. [19] U.H. Engelhardt, H.G. Maier, Z. Lebensm.-Unters.-Forsch. 181 (1985) 20. [20] F. Bähre, H.G. Maier, Fresenius J. Anal. Chem. 355 (1996) 190. [21] F. Bähre, H.G. Maier, Dtsch. Lebensem.-Runds. 95 (1999) 399. [22] F. Bähre, Dissertation, Technical University of Braunschweig, Germany, 1997..
(9)
Figure
Documento similar
The characterization in amino acids, organic acids, sugars, trigonelline, volatiles compounds, fatty acids, total phenolic, carotenoids, vitamin C content, and antioxidant capacity
Dietary fiber in food and protection against colorectal cancer in the European Prospective Investigation into Cancer and Nutrition (EPIC): an observational study... luminal short
The expansionary monetary policy measures have had a negative impact on net interest margins both via the reduction in interest rates and –less powerfully- the flattening of the
Jointly estimate this entry game with several outcome equations (fees/rates, credit limits) for bank accounts, credit cards and lines of credit. Use simulation methods to
In our sample, 2890 deals were issued by less reputable underwriters (i.e. a weighted syndication underwriting reputation share below the share of the 7 th largest underwriter
Non-inductive conditions for flowering such as short photoperiod (SD) and low ambient temperature (16ºC) increase the frequency and severity of the phenotypic defects
Upon Fenton oxidation of the four ILs tested hydroxylated compounds of higher molecular weight than the starting ILs, fragments of ILs partially oxidized and short-chain
Prodrug of natural butyrate, such as tributyrin (TB) and 2,3-dibutyroil-1-O-alkylglycerols (SCAKG), are neutral short-chain fatty acid triradylglycerols that are likely
