Enhanced Photocatalytic Activity for H2 Production by RGO/P25 Composite through UV Assisted Anchoring
11
0
0
Texto completo
(2) very high temperatures 700-1000°C [6] and the photo-electrochemical process, which is very interesting due to its simplicity and potential for development in the future [7]. Since water splitting by photo-electrochemical processes with a TiO2 electrode was reported[2] photocatalytic production of H2 has been of great interest. A wide variety of semiconductor materials with photocatalytic properties have been studied, for example: C3N4 [3], TiO2 [10, 11], BiVO4[6], CdS[7], WO3[8]and ZnO [15, 16]. Not to mentionthe use of the Pt as dopantforthesematerials, itisworthmentioningthat Pt ishighcostelement and thisrepresentsa greatdisadvantageas a massivetechnologyforhydrogenproduction. The tendency to use semiconductor nanomaterials for the development of photon energy storage technologies, has paved the way for novel techniques to use renewable resources. All this as a consequence of their large surface areas and different morphologies [11]. In order to solve the different issues arising in TiO2 lack of photoactivity under visible light irradiation, several proposals have been implemented as doping with metal ions [12], carbon or nitrogen [13], as well as addition of sacrifice elements, as either electron donors or holes scavengers [14]. Among the range of materials that can be selected to synthetize composites with TiO2 and improve its photocatalytic efficiency is the introduction of nanostructured carbon materials (carbon nanotubes, fullerenes, graphene single layers) [21-23], which offer unique benefits, such as chemical stability in both basic and acidic environments and flexible textural properties. Recently, these materials and, in particular, graphene have awaken great interest in this context because of its unusual structural and electronic properties [18]. RGO/TiO2 as photocatalyst 𝐶2 𝐻5 𝑂𝐻. 𝑇𝑖𝑂2 + ℎ𝜈 → 𝑇𝑖𝑂2 (ℎ + 𝑒) →. 𝑇𝑖𝑂2 (𝑒) + 𝐶2 𝐻4 𝑂𝐻 + 𝐻 +. 𝑇𝑖𝑂2 (𝑒) + 𝐺𝑂 → 𝑇𝑖𝑂2 + 𝑅𝐺𝑂. (1) (2). RGO/TiO2 composites have achieved great popularity because of their complementary properties, and can be synthesized by different techniques. One of them is by photoassistedreduction, which consist in the use of the photocatalytic nature of TiO2. Through the use of reducing agents such as hydrazine, glucose andseveral solvents including water [19]. Using mixing or sonication, which is the most simple method, however the interaction between the two materials is weak because a chemical bond is expected [20]. Another popular technique is by Sol-gel, that is the most used to obtain a chemical interaction between the GO and the TiO2, generally the GO layers are available to interact with the precursors of the TiO2 due to the solubility of the GO, however,GO in aqueous solutions are not adequate for the reason that induces the precipitation of TiO 2, therefore, the use of ethanol[21]. Other techniques include hydrothermal and solvothermal methods that involve controlled pressure and temperature during its synthesis, however, these are not highly recommended because the TiO2crystalline phase may change and sometimes the reduction of graphene oxide is not adequate[18].. 162 | P á g i n a.
(3) The first researchperformed about RGO/TiO2 synthesisby UV-assisted photo reduction was reported by Williams et al, where GO was reduced by accepting electrons generated from TiO2 at the time of being irradiated. The following reaction equations describe thismechanism[22].. Methodology Oxidation of graphite Graphite oxide was synthesized from graphite powder using a modification of Hummers method [30, 31]. 1 g of graphite was subjected to a microwave pretreatment [25] during 15s, immediately after the sample was added to a concentrated solution of H2SO4 /H3PO4 with 9:1 ratio (43.2 mL and 4.8 mL, respectively), this mixture is kept under magnetic stirringin an ice bath (4°C) for 3 h. After this time 6 g of KMnO4 were added by shaking for 2 h, finally a solution of H2O2 (12 mL) and HCl 10% (13 mL) was added by drip irrigation keeping the mixture with stirring for 0.5 h; even in ice due to the exothermic nature of the reaction [26]; Next step was washing and filtering with trice distillated water, assisted by a vacuum pump until the remains of acid and potassium permanganate present in the mixture are removed, once completed this step GO is taken to dryness in a muffle furnace at 65°C.. Composite of TiO2 anchored in reduced graphene oxide. For this study a commercial titanium dioxide Evonik P25was utilized. To synthesize the compositeof reduced graphene oxide/titanium dioxide (RGO/ TiO2) a certain amount of microwaved graphene oxide (MWGO) and TiO2(as required to obtain 10 % by weight of graphene oxide) was suspended in an aqueous solution at 30% ethanolusing an ultrasonic bath (Branson 2510) at a frequency of 40 kHz for 15 min, separately. Additionally, the GO to the P25 is also subjected to ultrasound to obtain a homogeneous suspension. After 15 min, the MWGO suspension is poured into the suspension of TiO2, continuing exposure to sonication until 40 min. The sample is then placed within a photoreaction systemunder visible radiation of a mercurial lamp (250 W) and stirring continues for 24 h, the resulting solution was dried on a hot plate at 80°C for 12h.. Characterization. X-ray diffraction. 163 | P á g i n a.
(4) Crystalline phases present in each of the synthesized materials in this study were determined by the x-ray diffraction technique by making use of a Phillips Xpert Pro diffractometer, which used a copper Cu kα radiation ( = 1.54056 Å). Diffraction patterns were obtained with a 2sweep angleof 5° to 90°, with a step of 0.05.. Diffuse reflectance spectroscopy Absorption and diffuse reflectance spectra of the synthesized samples were analyzed in a UV-Visible Evolution 220 Thermo UV spectrophotometer equipped with integration sphere, the range used in this technique were visible and near UV (adjacent to and part of the near IR) 190-1100 nm wavelengths, the band gap values can be estimated using the Tauc technique by plotting KubelkaMunk units against energy in electron volts (eV) considering the following equation:. 𝛼𝑏 =. 𝐵(ℎ𝑣 − 𝐸𝑔 )^𝑛 ℎ𝑣. (3). where b is the absorption coefficient, h is the absorbed energy, B is the absorption constant and n takes values of ½ or 2 if director indirect transition occur, respectively.. In order to determine the band gap energy value of the samples the Kubelka-Munk approach was used, which estimates this value by extrapolation where = 0 [27].. Field emission scanning electron microscopy. Synthesized sample was analyzed by field emission scanning electronic microscopy(FESEM) in aJEM-2200FS Field Emission Transmission Electron Microscope, where the sample will be exposed to a beam of electrons generated from a tungsten filament, to minimize energy losses or deviations of the beam, the column must operate under a ultra-high vacuum of 10-8 Torr[28].. Photocatalytic Evaluation. The photocatalytic activity was evaluated based on the performance of the material towards the production of hydrogen for the dissociation of the water molecule, using a 164 | P á g i n a.
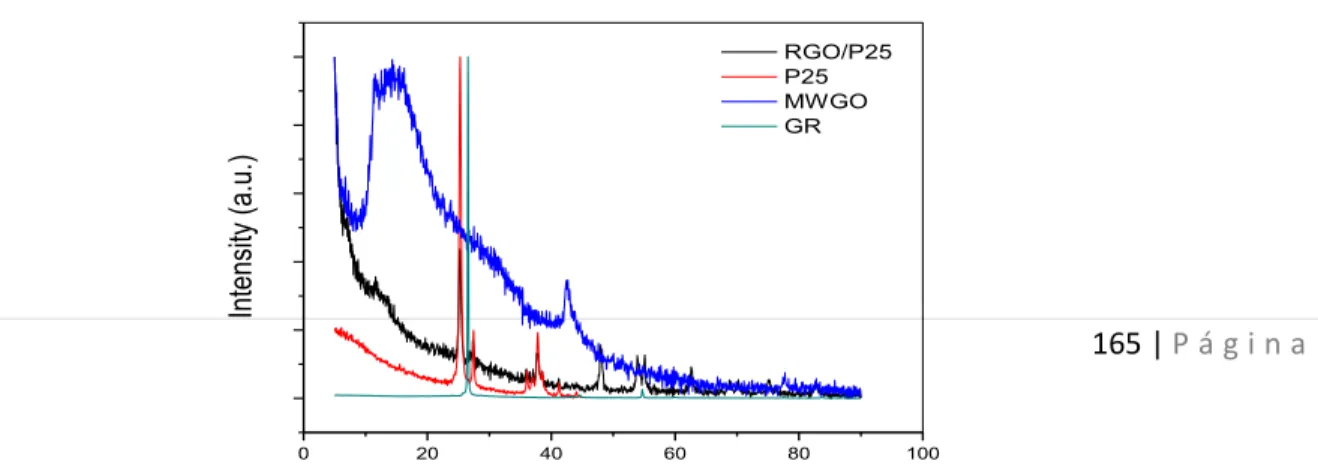
(5) 250W mercurial lamp as a source of energy, 2% methanol aqueous solution as ansacrificeagent. Monitoring of the reaction was followed by gas chromatography using a gas chromatograph Perking Elmer Clarus 580, taking aliquots at 1h time intervals with 8 repetitions.. Results and discussion. X-ray diffraction. Phase and crystalline structure of the samples were analyzed by X-ray diffraction. Fig. 1 shows the diffraction pattern of graphite (GR), as well as MWGO, P25 and RGO/P25samples. GR shows the major intensity peak stake at an angle 2= 28°3.18Å, which belongs to typical graphite. The diffraction pattern of MWGO presents a signal at 2=17° 5.02 Å, corresponding to graphene oxide, the peak in 2= 44° which is associated with RGO forming a crystal block according to Hontoria et al. [29] may be a highly oriented graphene oxide. However, an increase in the amorphous phase is observed, which is mainly associated with the partial decomposition of the oxygenated groups of graphene oxide, while the increase in the width of the peak is attributed to the generation of a more separated laminar structure, which allows physical and chemical intercalation [30].. P25 diffraction pattern denotes the presence of Anatase and Rutile crystalline phases. From the Rietveld plot of the composite, it can be clearly seen a fading signal attributed to graphene oxide showing mainly the characteristic P25peaks, while maintaining the amorphous phase associated with graphene oxide. This behavior can be mainly attributed to two processes; reduction of graphene oxide by TiO2 photo anchorage and to the exfoliation of graphene oxide during sonication.. Intensity (a.u.). RGO/P25 P25 MWGO GR. 165 | P á g i n a 0. 20. 40. 60. 2. 80. 100.
(6) Fig. 1 Rietveld plot belonging to Graphite (GR) TiO2 (P25), MWGO and RGO/P25 10% wt.. UV-Vis Spectroscopy diffuse reflectance. Fig. 2 a) shows the plot of the percentage of absorption of GRO/P25 obtained using the diffuse reflectance in a wavelength range from 190 to 1100 nm, showing the limit of its range of absorption at 460nm, which means a maximum absorbance in the visible range [27]. In order to estimate the band gap value of the sample a Tauc graph was generated by plotting the Kubelka-Munk function against the light energy, which produced an estimated value of the indirect band gap of 2.57 e.V.. K-M.E^1/2 (eV/m)^1/2. Absorbance (a.u). 4. a) RGO/P25 P25 MWGO. 3. b). 2. RGO/P25 P25 1. 2.57 eV. 2.98 eV. 0. 100. 200. 300. 400. 500. 600. nm). 700. 800. 900. 1000. 0.0 0.5 1.0 1.5 2.0 2.5 3.0 3.5 4.0 4.5 5.0 5.5 6.0 6.5 7.0. Photon Energy (eV). Fig. 2 a) UV-Vis spectrometry to determinate the band gap using the absorbance pattern of the RGO/P25 sample. b) Estimation of the indirect band gap by the Tauc plot through the approximation of the Kubelka-Munk coefficient (Comparison Chart).. Fig. 2 b) shows a comparison betweenRGO/P25 and P25 behavior, where RGO/P25 presentsits maximum absorption shifted to a visible range. These results are consistent 166 | P á g i n a.
(7) whitobservations by Cheng et al., in addition to being similar to the values achieved when P25 is doped with carbon[31] with values reported in the literature ranging from 2.66 eV to 3.18 eV. This decrease in band gap energy can be attributed to the change in the bands structure, which is widely associated with the improvement ofP25interaction with RGO [20].. Scanning electron microscopy (SEM). Morphology of the RGO/P25 was investigated through scanning electron microscopy, as revealed in the micrograph of Fig. 3. In this Figure, it can be seen that P25 is supported in the leaves of RGO, and that the length of the RGO is in the order of microns. This is morphology is associated with the microwave pretreatment during the synthesis of graphene oxide [25]. This unique morphology allows a greater amount of P25 particles to be physisorbedby RGO, which may lead to small agglomerates, it is difficult to assess groups of less than 5 sheets of RGO or a monolayer of RGO, because they are often confused with the membrane of the grid used for the analysis. However, in the MWGO image a) it can be seen that exfoliation is poor. The images (b) and (c) confirms the existence of fixed single layers along with P25. Images (d) and (e) are groups of less than 5 sheets of RGO andin image f) it can be observed that P25 nanoparticles arealternately anchored on the layers of RGO, such as in sandwich structure [32], [33], which shows a a). d). b) =. e). c). f). Fig. 3 a) MWGO, b) and c) RGO/P25 monolayer, d) and e) RGO/P25 < 5 layers, f) RGO/P25 type sandwich.. successful RGO exfoliation by sonication, as well as the P25 photo anchorage.. 167 | P á g i n a.
(8) Photocatalytic Evaluation. Incorporation of RGO to P25 has unique advantages;¡Error! No se encuentra el origen de la referencia. shows the hydrogen evolution produced by P25, MWGO, RGO/P25materials, which were evaluated as photocatalysts under the standards for hydrogen generation with a production of 187,150 and 400mol/gh, respectively. From these results it can be concluded that the RGO/P25 exhibits an enhanced performance than their precursors, since it is evident that the photocatalytic properties of P25 were improved. This improvement is related to the RGO electrical properties as electrons collector and to its great charge mobility, a feature that is attributed to its two-dimensional structure [30]. In addition to this the unpaired electrons of RGO, make the surface interaction of P25 with the RGO to extend the range of absorption of P25. Even though there was not a significant change in the specific area of 60 m2/g for the P25 and 52m2/g for RGO [34]. This change in TiO2 photocatalytic activity cannot be attributed to the specific surface area enhancement. Otherwise, this effect can be ascribedto the increase in charge transfer triggered by RGO, due to its two-dimensional structure and the conjugation of the pi bond [35], which makes to extend the absorption of light, so the electrons in the P25 are transferred to the RGO, thus allowing a reduction in the recombination time of charges.. Conclusions. Microwavepretreatment of the Graphite favors the intercalation of the oxygenated functional groups and its sonic exfoliation. These oxygenated functional groups facilitatethe photo anchoring of the TiO2P25 and the formation of sandwich-type structures. The shifting of the band gap value toward the visible spectrum of the P25 is associated to the addition of small amounts of RGO. Improvement of the P25 photocatalytic activity for hydrogen production under visible light can be attributed to reduction of its band gap energy value by doping with RGO.. Acknowledgements. The authors acknowledge M.Sc. Ernesto Guerrero Lestarjette, M. Sc. Karla Campos Venegas, Eng. Wilber Antunez Flores, and Eng. Luis de la Torre Saenz for their contributions to the XRD, SEM, BET, results. Special thanks are given to Laboratorio Nacional de Nanotecnología in Centro de InvestigaciónenMaterialesAvanzados, S. C., for their support in the use of the facilities. 168 | P á g i n a.
(9) References. [1] A. Paracchino, V. Laporte, K. Sivula, M. Grätzel, and E. Thimsen, “Highly active oxide photocathode for photoelectrochemical water reduction,” Nat. Mater., vol. 10, no. 6, pp. 456–461, Jun. 2011. [2] A. Fujishima and K. Honda, “Electrochemical photolysis of water at a semiconductor electrode.,” Nature, vol. 238, no. 5358, pp. 37–8, Jul. 1972. [3] X. Wang et al., “A metal-free polymeric photocatalyst for hydrogen production from water under visible light,” Nat. Mater., vol. 8, no. 1, pp. 76–80, Jan. 2009. [4] S. Li, D. Chen, F. Zheng, H. Zhou, S. Jiang, and Y. Wu, “Water-Soluble and Lowly Toxic Sulphur Quantum Dots,” Adv. Funct. Mater., vol. 24, no. 45, p. n/a-n/a, Sep. 2014. [5] F. Zuo et al., “Active Facets on Titanium(III)-Doped TiO2: An Effective Strategy to Improve the Visible-Light Photocatalytic Activity,” Angew. Chemie Int. Ed., vol. 51, no. 25, pp. 6223–6226, 2012. [6] Q. Jia, K. Iwashina, and A. Kudo, “Facile fabrication of an efficient BiVO4 thin film electrode for water splitting under visible light irradiation.,” Proc. Natl. Acad. Sci. U. S. A., vol. 109, no. 29, pp. 11564–9, Jul. 2012. [7] Y. Li, Y. Hu, S. Peng, G. Lu, and S. Li, “Synthesis of CdS Nanorods by an Ethylenediamine Assisted Hydrothermal Method for Photocatalytic Hydrogen Evolution,” J. Phys. Chem. C, vol. 113, no. 21, pp. 9352–9358, May 2009. [8] M. Higashi, R. Abe, T. Takata, and K. Domen, “Photocatalytic Overall Water Splitting under Visible Light Using ATaO2 N (A = Ca, Sr, Ba) and WO3 in a IO3− /I − Shuttle Redox Mediated System,” Chem. Mater., vol. 21, no. 8, pp. 1543–1549, Apr. 2009. [9] X. Lu et al., “Efficient photocatalytic hydrogen evolution over hydrogenated ZnO nanorod arrays,” Chem. Commun., vol. 48, no. 62, p. 7717, 2012. [10] P. Gao, Z. Liu, and D. D. Sun, “The synergetic effect of sulfonated graphene and silver as co-catalysts for highly efficient photocatalytic hydrogen production of ZnO nanorods,” J. Mater. Chem. A, vol. 1, no. 45, p. 14262, 2013. [11] A. Fujishima, X. Zhang, and D. A. Tryk, “Heterogeneous photocatalysis: From water photolysis to applications in environmental cleanup,” Int. J. Hydrogen Energy, vol. 32, pp. 2664– 2672, 2007.. 169 | P á g i n a.
(10) [12] M. Amir, U. Kurtan, and A. Baykal, “Rapid color degradation of organic dyes by Fe3O4@His@Ag recyclable magnetic nanocatalyst,” J. Ind. Eng. Chem., vol. 27, pp. 347–353, Jul. 2015. [13] R. Asahi, T. Morikawa, T. Ohwaki, K. Aoki, and Y. Taga, “Visible-Light Photocatalysis in Nitrogen-Doped Titanium Oxides,” Science (80-. )., vol. 293, no. 5528, pp. 269–271, Jul. 2001. [14] Q. Xiang, J. Yu, and M. Jaroniec, “Enhanced photocatalytic H2-production activity of graphene-modified titania nanosheets,” Nanoscale, vol. 3, no. 9, p. 3670, Sep. 2011. [15] M. J. Sampaio, C. G. Silva, R. R. N. Marques, A. M. T. Silva, and J. L. Faria, “Carbon nanotube–TiO2 thin films for photocatalytic applications,” Catal. Today, vol. 161, no. 1, pp. 91–96, Mar. 2011. [16] J. Yu, T. Ma, G. Liu, and B. Cheng, “Enhanced photocatalytic activity of bimodal mesoporous titania powders by C60 modification,” Dalt. Trans., vol. 40, no. 25, p. 6635, 2011. [17] F. Wang and K. Zhang, “Physicochemical and photocatalytic activities of self-assembling TiO2 nanoparticles on nanocarbons surface,” Curr. Appl. Phys., vol. 12, no. 1, pp. 346–352, Jan. 2012. [18] S. Li, X. Pan, L. K. Wallis, Z. Fan, Z. Chen, and S. A. Diamond, “Comparison of TiO2 nanoparticle and graphene–TiO2 nanoparticle composite phototoxicity to Daphnia magna and Oryzias latipes,” Chemosphere, vol. 112, pp. 62–69, 2014. [19] D. R. Dreyer et al., “The chemistry of graphene oxide,” Chem. Soc. Rev., vol. 39, no. 1, pp. 228–240, 2010. [20] S. Morales-Torres, L. M. Pastrana-Martínez, J. L. Figueiredo, J. L. Faria, and A. M. T. Silva, “Design of graphene-based TiO2 photocatalysts—a review,” Environ. Sci. Pollut. Res., vol. 19, no. 9, pp. 3676–3687, Nov. 2012. [21] X.-Y. Zhang, H.-P. Li, X.-L. Cui, and Y. Lin, “Graphene/TiO2 nanocomposites: synthesis, characterization and application in hydrogen evolution from water photocatalytic splitting,” 2010. [22] G. Williams, B. Seger, and P. V. Kamt, “TiO2-graphene nanocomposites. UV-assisted photocatalytic reduction of graphene oxide,” ACS Nano, vol. 2, no. 7, pp. 1487–1491, Jul. 2008. [23] W. S. Hummers and R. E. Offeman, “Preparation of Graphitic Oxide,” J. Am. Chem. Soc., vol. 80, no. 6, pp. 1339–1339, 1958. [24] J. M. Tour et al., “Improved synthesis of graphene oxide,” ACS Nano, vol. 4, no. 8, pp. 4806–4814, 2010. [25] X. Liu et al., “Microwave-assisted production of giant graphene sheets for high performance energy storage applications,” J. Mater. Chem. A, vol. 2, no. 31, pp. 12166–12170, 2014. 170 | P á g i n a.
(11) [26] B. Dehghanzad, M. K. Razavi Aghjeh, O. Rafeie, A. Tavakoli, and A. Jameie Oskooie, “Synthesis and characterization of graphene and functionalized graphene via chemical and thermal treatment methods,” RSC Adv., vol. 6, no. 5, pp. 3578–3585, 2016. [27] P. Cheng et al., “TiO2-graphene nanocomposites for photocatalytic hydrogen production from splitting water,” Int. J. Hydrogen Energy, vol. 37, no. 3, pp. 2224–2230, 2012. [28] J. I. Goldstein and H. Yakowitz, Practical Scanning Electron Microscopy : Electron and Ion Microprobe Analysis. Springer US, 1975. [29] C. Hontoria-Lucas, A. J. López-Peinado, J. de D. López-González, M. L. Rojas-Cervantes, and R. M. Martín-Aranda, “Study of oxygen-containing groups in a series of graphite oxides: Physical and chemical characterization,” Carbon N. Y., vol. 33, no. 11, pp. 1585–1592, 1995. [30]. W. Gao, Graphene Oxide. Cham: Springer International Publishing, 2015.. [31] L. Shen, X. Zhang, H. Li, C. Yuan, and G. Cao, “Design and tailoring of a threedimensional TiO2-graphene-carbon nanotube nanocomposite for fast lithium storage,” J. Phys. Chem. Lett., vol. 2, no. 24, pp. 3096–3101, 2011. [32] X. Zhang et al., “Electrospun TiO2 –Graphene Composite Nanofibers as a Highly Durable Insertion Anode for Lithium Ion Batteries,” J. Phys. Chem. C, vol. 116, no. 28, pp. 14780–14788, 2012. [33] X. Rong, F. Qiu, C. Zhang, L. Fu, Y. Wang, and D. Yang, “Preparation, characterization and photocatalytic application of TiO2-graphene photocatalyst under visible light irradiation,” Ceram. Int., vol. 41, no. 2, pp. 2502–2511, 2015. [34] Y. Zhang, Z. R. Tang, X. Fu, and Y. J. Xu, “Engineering the unique 2D mat of graphene to achieve graphene-TiO2 nanocomposite for photocatalytic selective transformation: What advantage does graphene have over its forebear carbon nanotube?,” ACS Nano, vol. 5, no. 9, pp. 7426–7435, 2011. [35] M. J. Allen, V. C. Tung, and R. B. Kaner, “Honeycomb carbon: A review of graphene,” Chem. Rev., vol. 110, no. 1, pp. 132–145, 2010.. 171 | P á g i n a.
(12)
Figure


Documento similar
For the second case of this study, the features for training the SVM will be extracted from the brain sources estimated using the selected SLMs MLE, MNE and wMNE. The scenario is
To check this point, we have also calculated the monolayer case taking for the benzene molecule an energy gap of 7.0 eV, a value which can still be considered compatible with our
At the same time, higher values of the quantum efficiency were found in the photocatalytic degradation of phenol, methyl 4-hydroxybenzoate and 4-chlorophenol with P25, whereas in
The extension of light absorption of the synthesized catalysts into the visible range was probably resulting from the presence of the photocatalytic composite, iron..
It seems obvious thinking that the explanation of the activity obtained for this catalyst is closer to structural changes that occur during the photocatalytic reaction and due to
In this sense, three different approaches will be suitable for obtaining MOFs with photocatalytic activity [29]: (i) encapsulating chromophores in the internal structure (MOFs would
Photocatalytic functionalization of imines: pathway A, alkyl radical addition (left); pathway B, single-electron reduction (right).. Alternatively, the photocatalytic
The influence of the presence of rGO and the photocatalyst concentration on the radiation absorption inside the reactor was evaluated by solving a radiation model
