Title: Omega–3 encapsulation by PGSS-drying and conventional
1drying methods. Particle characterization and oxidative stability
23
Authors
4
Rodrigo Melgosa ([email protected] ) 5
Óscar Benito ([email protected] ) 6
María Teresa Sanz* ([email protected]) 7
Esther de Paz ([email protected]) 8
Sagrario Beltrán ([email protected]) 9
Address
10
Department of Biotechnology and Food Science (Chemical Engineering Section) 11
University of Burgos, Plaza Misael Bañuelos s/n 09001 Burgos, Spain 12
13
14
*
Abstract
15
Particles from Gas-Saturated Solutions (PGSS)-drying has been used as a green 16
alternative to encapsulate omega–3 polyunsaturated fatty acids (n–3 PUFAs) at mild, 17
non-oxidative conditions. PGSS-dried particles have been compared to those obtained 18
by conventional drying methods such as spray-drying and freeze-drying, finding 19
encapsulation efficiencies (EE) up to 98 % and spherical morphology for PGSS- and 20
spray-dried particles. Freeze-dried powders showed irregular morphology and EE from 21
95.8 to 98.6 %, depending on the freezing method. Differential scanning calorimetry 22
(DSC) analysis revealed glass-transition and melting peaks of OSA-starch and a cold-23
crystallization peak corresponding to the encapsulated n–3 PUFA concentrate. 24
Compared to conventionally dried powders, PGSS-dried microparticles showed lower 25
primary and secondary oxidation after 28 days of storage at 4 ºC. Ascorbic acid addition 26
combined with the mild processing conditions of PGSS-drying yielded particles with a 27
maximum peroxide value of 2.5 meq O2/kg oil after 28 days of storage at 4 ºC.
28
1. Introduction
30
An adequate intake of omega–3 polyunsaturated fatty acids (n–3 PUFAs) is 31
recommended in healthy diet guidelines due to their important benefits (Ruxton, Reed, 32
Simpson, & Millington, 2004). Long-chain n–3 PUFAs, mainly eicosapentaenoic (EPA, 33
20:5 n–3) and docosahexaenoic (DHA, 22:6 n–3) acids are eicosanoid precursors, which 34
are immunomodulatory molecules with a key role in the inflammatory response. EPA 35
and DHA are claimed to contribute to the normal brain, eye and cardiovascular 36
functions in adults and help in the normal development of the eyes, the brain and the 37
nervous system in children (EFSA, 2010). 38
The perceived health benefits of these compounds have created a strong demand for 39
EPA and DHA concentrates in the pharmaceutical and food industries. However, n–3 40
PUFAs are unstable and very prone to oxidation, easily generating lipid hydroperoxides 41
and free radicals under oxidative conditions. These species negatively affect sensory 42
properties, since they can decompose into low-molecular-weight volatile compounds 43
that are perceived as rancid, and what is more, they present potentially cytotoxic, 44
carcinogenic and mutagenic effects (Niki, 2009; Uluata, McClements, & Decker, 2015) 45
For these reasons, n–3 PUFA concentrates are often encapsulated in order to protect 46
them from light and oxygen during shelf life; and natural antioxidants such as 47
tocopherols, phospholipids, ascorbic acid, or their mixtures are usually added (Baik et 48
al., 2004; Löliger & Saucy, 1994). 49
Materials of different nature can be used as n–3 PUFA encapsulating agents: proteins 50
such as whey protein isolate, sodium caseinate or gelatin, phospholipids such as 51
lecithin, or polysaccharides such as gum Arabic, carboxymethyl cellulose, maltodextrin, 52
chitosan, or modified starch are some examples of carrier materials for 53
Ampuero, & Robert, 2016). Among them, n-octenyl-succinic-anhydride modified starch 55
(OSA-starch) has been chosen in this work because it presents good emulsifying 56
properties and is suitable to encapsulate oils rich in n–3 PUFAs, as well as other 57
bioactive compounds such as essential oils and hydrophobic compounds (Carneiro, 58
Tonon, Grosso, & Hubinger, 2013; de Paz, Martín, Bartolomé, Largo, & Cocero, 2014; 59
Drusch, Serfert, Scampicchio, Schmidt-Hansberg, & Schwarz, 2007; Jafari, Assadpoor, 60
He, & Bhandari, 2008; Varona, Martín, & Cocero, 2011). 61
Different encapsulation techniques can be used to encapsulate n–3 PUFAs, such as 62
emulsification, spray-drying, freeze-drying, coacervation, in situ polymerization, 63
extrusion, or fluidized-bed coating (Bakry et al., 2016). Among these, the most widely 64
used technique in the food and pharmaceutical industries is spray-drying, followed by 65
freeze-drying. Freeze-drying is often applied to thermolabile and easily oxidizable 66
compounds due to the protective low temperatures and vacuum conditions involved in 67
the process. Its main drawback is the energy consumption, linked to the low temperature 68
and high vacuum conditions as well as the long residence times required to completely 69
dry the product, which in turn translate into high processing costs. On the contrary, 70
spray-drying is a low-cost microencapsulation technology which operates in a relatively 71
simple and continuous way, thus it is commonly used at industrial scale (Bakry et al., 72
2016). 73
Prior to the drying step, the non-soluble n–3 PUFAs need to be dispersed into the 74
encapsulating agent solution, obtaining an oil-in-water (O/W) emulsion. Several 75
methods can be used to prepare O/W emulsions, such as conventional emulsification 76
(colloid milling, high speed blending and high-pressure homogenization), ultrasound 77
(US) assisted emulsification, membrane emulsification, and micro-channel 78
grown in importance among the pharmaceutical, cosmetic, and food industries, thanks 80
to its versatility and the possibility of obtaining high quality food products with 81
enhanced functional properties (Abbas, Hayat, Karangwa, Bashari, & Zhang, 2013). 82
US-assisted emulsification can be applied to improve stability and bioavailability of the 83
dispersed bioactive compounds and, in particular, it can be used to obtain O/W 84
emulsions with nanometric droplet size and narrow size distribution. Typically, US-85
assisted emulsification consists on applying low-frequency sound waves of 20-100 kHz 86
through a metallic sonotrode immersed in the liquid medium, in order to generate 87
disruptive forces that break down the macroscopic phases to nanosize droplets. The 88
nano-scale emulsions obtained present interesting functional properties and enhanced 89
stability against oxidation (Abbas et al., 2013). 90
Supercritical fluids, and particularly supercritical carbon dioxide (SC-CO2), are a
91
convenient medium to produce particles loaded with bioactive compounds. Carbon 92
dioxide is an inert, non-toxic solvent, and is completely released from the product as a 93
gas once back to atmospheric conditions. Besides, the accessibility of the supercritical 94
state of carbon dioxide (TC = 31.1 °C; pC = 73.8 bar) and its advantageous physical
95
properties (high density and diffusivity, and low viscosity) make SC-CO2 the solvent of
96
choice in many particle formation processes. (Türk, 2014). Among the several available 97
techniques, the Particles from Gas Saturated Solutions (PGSS) process overcomes the 98
problems of solubility limitations and high gas consumption of other particle formation 99
methods using SC-CO2 (Türk, 2014). This technique can be used for drying aqueous
100
solutions, dispersions or, as in this work, O/W emulsions, in the so-called PGSS-drying 101
process (Türk, 2014). 102
Basically, the PGSS-drying technique consists on mixing an aqueous solution with 103
saturated solution down to atmospheric pressure through a nozzle. This technique can 105
be used as an alternative to conventional spray-drying, achieving a more efficient 106
atomization due to the sudden vaporization of the dissolved CO2 and the expansion of
107
gas bubbles in the solution during depressurization from supercritical to atmospheric 108
conditions. Both effects improve the atomization of the sprayed solution forming small 109
droplets, thus reducing the particle size of the dried powder and enhancing the drying 110
process (Martín & Weidner, 2010; Weidner, 2009). Besides, and because of the intense 111
and deep cooling caused by the Joule-Thomson effect, it is possible to dry the product at 112
low temperature (40-80 ºC) (de Paz, Martín, & Cocero, 2012; Weidner, 2009). The 113
mild-temperature conditions, combined with the intrinsically inert atmosphere due to 114
oxygen displacement, prevent, or at least delay, oxidative degradation of the 115
encapsulated bioactive compounds (de Paz et al., 2012; Weidner, 2009). Operating 116
conditions in the spray tower, particularly temperature and gas-to-product ratio (GPR), 117
must be taken into account in order to operate above the dew line of the carbon dioxide– 118
water system (Martín & Weidner, 2010), and ensure the complete drying of particles. 119
In this work, an n–3 PUFA enriched fish oil has been encapsulated by the alternative 120
and green technology Particles from Gas Saturated Solutions (PGSS)-drying. The main 121
hypothesis of the study is to explore whether or not the potential benefits of 122
supercritical carbon dioxide technologies applied to particle formulation and 123
encapsulation may affect particle properties and oxidative stability of heat-sensitive and 124
easily oxidizable compounds such as n–3 PUFAs, compared to other conventional 125
drying methods. This way, the PGSS-dried particles have been compared to those 126
obtained by spray-drying and freeze-drying, which are commonly applied in the 127
pharmaceutical, cosmetic, and food industries to dry aqueous solutions and dispersions. 128
performed in terms of particle morphology, residual humidity, and particle size 130
distribution of the reconstituted particles. Besides, encapsulation efficiency and 131
oxidative stability (primary and secondary oxidation) of the encapsulated n–3 PUFA 132
concentrate have been monitored over time in the particles formulated with each of the 133
drying methods. Additionally, an antioxidant (ascorbic acid) has been added to some of 134
the formulations as a strategy to potentially enhance the oxidative stability of the 135
encapsulated n–3 PUFA concentrate. 136
137
2. Materials and methods
138
2.1. Materials
139
n–3 PUFA concentrate from fish oil, AlgatriumTM Plus, was kindly donated by Brudy 140
Technology S.L. (Spain). It has been stored at 4 ºC in darkness and N2 atmosphere.
Hi-141
CapTM 100, an octenyl-succinic-anhydride modified starch (OSA-starch) derived from 142
waxy maize, was provided by Ingredion Inc. (Germany). Carbon dioxide (99.9%) was 143
provided by Air Liquide S.A. (Spain). Ascorbic acid (L(+)-Ascorbic acid, AA) was 144
purchased from Panreac AppliChem (Spain). 145
37% hydrochloric acid (HCl), diethyl ether, 1-butanol, propanol, methanol, 2-146
thiobarbituric acid (TBA), and trichloroacetic acid (TCA) were provided by VWR 147
Chemicals (Germany). Hexane, absolute ethanol, Iron(II) sulphate heptahydrate, and 148
ammonium thiocyanate were purchased from Merck KGaA (Germany). 2,2,4-149
trimethylpentane (isooctane) and barium chloride dihydrate were supplied by Macron 150
Fine Chemicals (France) and Panreac AppliChem (Spain), respectively. Cumene 151
hydroperoxide and 1,1,3,3-tetraethoxypropane (TEP) standards were purchased from 152
154
2.2. Characterization of the n–3 PUFA concentrate
155
Neutral lipid profile of the n–3 PUFA concentrate has been analyzed by normal-phase 156
HPLC (NP-HPLC). Separation was carried out at room temperature in a Lichrospher 157
Diol column (5 mm, 4 mm×250 mm) and detection was performed by evaporative light 158
scattering (ELSD) (Agilent Technologies 1200 Series, USA) at 35 ºC and 3.5 bar. 159
Solvent gradient and calibration procedure have been reported elsewhere (Solaesa, 160
Sanz, Falkeborg, Beltrán, & Guo, 2016). 161
Fatty acid profile of the n–3 PUFA concentrate has been determined according to the 162
AOAC Official Method (AOAC International, 2012) in a Hewlett Packard gas 163
chromatograph (6890N Network GC System) equipped with an auto-sampler (7683B 164
series) and a flame ionization detector (FID). The separation was carried out in a fused 165
silica capillary column (Omegawax-320, 30 m×0.32 mm i.d.) with helium (1.8 mL/min) 166
as carrier gas. Injection and detection temperatures, as well as ramp conditions have 167
been previously reported (Rebolleda, Rubio, Beltrán, Sanz, & González-San José, 168
2012). Most of the fatty acids were identified by comparison of their retention times 169
with those of chromatographic standards (Sigma Aldrich). As indicated by the AOAC 170
Official Method (AOAC International, 2012), an internal standard (methyl-tricosanoate, 171
C23:0) was used for quantification purposes. 172
HPLC with diode array detection (HPLC-DAD) of the n–3 PUFA concentrate was 173
carried out in order to detect tocopherol isomeric forms and other vitamin E analogs 174
added to the n–3 PUFA concentrate, as their presence was reported by the provider. The 175
analytical method is based on the IUPAC official method (Pocklington & 176
Separation was performed in an ACE 5 silica 250 mm × 4.6 mm column with 1 mL/min 178
of hexane:2- propanol (99:1) as the mobile phase. An isocratic gradient was used, and 179
the total run time was 15 min. α-, β-, γ-, and δ-tocopherols were monitored at λ = 296 180
nm. For identification and quantification of each tocopherol isomer, a calibration curve 181
with different amounts of the respective standard compound (Sigma Aldrich) was 182
constructed. 183
184
2.3. Ultrasound-assisted emulsification
185
O/W emulsions were formulated in a weigh proportion of 70:24:6 (water:carrier:n–3 186
PUFA concentrate), which in preliminary experiments was found to be the optimal in 187
terms of obtaining the smallest droplet size. First, an aqueous solution of the 188
encapsulating agent was prepared by dissolving 24.0 g of Hi-Cap™ 100 in 70.0 mL of 189
distilled water. Subsequently, 6.0 g of n–3 PUFA concentrate were added drop by drop 190
to the carrier solution under continuous stirring. Then, the mixture was stirred for 191
5 minutes to obtain a pre-emulsion, which was subsequently processed in a 20 kHz 750 192
W ultrasonic liquid processor Vibra-Cell 75043 (Sonics & Materials Inc.) with a 193
Ø13 mm titanium alloy sonotrode. Based on previous studies, amplitude was set at 100 194
% and sound waves were delivered in pulses (5 s On/5 s Off) in order to avoid excessive 195
heating of the sample, for a total processing time of 180 s. O/W emulsions were 196
produced in batches of 100 g. 197
198
2.4. PGSS-drying
199
O/W emulsions were processed using the PGSS-drying technique in order to remove 200
into the OSA-starch microparticles. Fig. 1 presents the schematic flow diagram of the 202
PGSS-drying apparatus, in which CO2 was fed by a membrane pump (LEWA) and
203
preheated using a silicone bath before injection into the static mixer, where it was mixed 204
with the O/W emulsion at the selected pressure and temperature. The CO2 mass flow
205
rate was measured with a Coriolis flow meter (Danfoss) with an accuracy of ± 0.1 kg 206
CO2/h. Temperature before and after the static mixer was measured by means of Pt100
207
thermoresistances (accuracy of ± 0.1 K), being the later under PID control. Pressure in 208
the CO2 line and after the static mixer was measured with pressure transmitters (DESIN
209
Instruments) with an accuracy of ± 0.05 MPa. Bourdon manometers (Nuova Firma) 210
were installed to provide secondary lectures of the operating pressure. 211
The O/W emulsion was pumped into the static mixer by a GILSON 305 piston pump 212
(max. flow rate: 25 ± 0.1 mL/min). The gas-saturated emulsion was then expanded into 213
the spraying tower through a capillary nozzle with an internal diameter of 400 µm 214
(Spraying Systems Co., Ref.: PF1650-SS). The spraying tower was made of PVC and 215
heated by electrical resistances. Temperature in the spray tower was also measured with 216
a Pt100 probe and controlled using a PID. CO2 was vented off the spraying tower and
217
passed through a water vapor condenser before final release. As security elements, a 218
rupture disk, check valves, and a relief valve were installed at different points in the 219
high-pressure circuit. 220
Typically, a PGSS-drying experiment began with the preheating of the system up to the 221
desired temperature in the static mixer, fixed at 110 ºC, and in the spraying tower, 222
which was set at 55 ºC. When temperature was achieved, CO2 was pumped up to the
223
desired pressure, which was fixed at 10.0 MPa. Pressure in the static mixer and 224
temperatures in the static mixer and the spraying tower were selected based on previous 225
emulsion pump was started at a flow rate such that the desired GPR, which was selected 227
at 30 g/g, was obtained. After all the O/W emulsion was processed, CO2 was allowed to
228
flow through the system at the same pressure and temperature conditions during 15 229
minutes in order to completely dry the particles. After that, the system was 230
depressurized and particles were collected from the walls and bottom of the spraying 231
tower and stored in darkness and refrigeration at 4 ºC for subsequent analyses. 232
233
2.5. Spray-drying
234
Spray-drying is a conventional, well-known drying technique which is widely used in 235
the pharmaceutical, cosmetic and food industries; thus, it was chosen to compare the 236
characteristics of the powder that may be obtained conventionally to those of the 237
powder obtained by the alternative PGSS-drying process. The spray-drying process was 238
carried out in a commercial Buchi B-290 mini Spray-dryer. The O/W emulsion, 239
obtained as described in section 2.3, was fed into the spray-drying apparatus at an inlet 240
temperature of 155 ºC, and %pump of 8 %, which was equivalent to a mass flow of 241
emulsion of 3.0 g/min. Outlet temperature was 100 ºC. The emulsion was sprayed 242
through a nozzle with 1.5 mm diameter and dried under a N2 flow of 360 L/h.
243
244
2.6. Freeze-drying
245
O/W emulsions obtained by the US-assisted method described in section 2.3 were 246
submitted to two different freezing methods: (1) conventional at -20 ºC overnight, and 247
(2) freezing with liquid nitrogen (-196 ºC). Samples were then equilibrated at -80 ºC for 248
2 h and submitted to freeze-drying in a Labconco Freeze Dry System at 1.5·10-4 mbar 249
effect of the freezing step, since the slower conventional freezing process is more likely 251
to form large crystals of water, which could adversely affect the emulsion stability and 252
structure, whereas the rapid freezing achieved with liquid nitrogen could better preserve 253
the physical structure of the emulsion. 254
255
2.7. Characterization of the O/W emulsion
256
2.7.1. Droplet size analysis of the O/W emulsions 257
The droplet size distribution of the O/W emulsions (original and reconstituted) was 258
measured by a Laser Diffraction (LD) equipment (Malvern Mastersizer 2000). A small 259
amount of sample was suspended in the suspension container filled with distilled water 260
under gentle agitation. In the case of the reconstituted O/W emulsions, the dried 261
powders were firstly dissolved in distilled water, maintaining the original ratio of 262
70:24:6 wt. (water:carrier:n–3 PUFA concentrate). 263
Droplet size measurements are reported as relative volume distribution and defined by 264
the mean diameter over volume (DeBroukere mean, D[4,3]) and the volume/surface 265
The median particle size (d0.5), defined as the maximum particle diameter below which
270
50 % of the sample volume exists, is also reported. The span value, defined in Eq. 3, 271
was also calculated. 272
0.9 0.1
0.5
span = d d
d −
(3) 273
where dx is the maximum particle diameter below which x% of the sample volume
274
exists. Span values near to 1 indicate a narrow particle size distribution (PSD). 275
276
2.7.2. Emulsion stability 277
Physical stability of the O/W emulsion was analyzed by static multiple scattering in a 278
vertical scan analyzer Turbiscan Lab Expert (Formulaction Inc.) with ageing station 279
AGS. By means of two optical sensors, the instrument measures the light transmitted 280
through the emulsion (180º from the incident light, transmission, T) and the light 281
backscattered by the emulsion droplets (45º from the incident light, backscattering, BS). 282
The scanning process is made vertically along the glass cell from bottom to top, and the 283
T/BS are each plotted as a function of the emulsion height in the glass cell. By 284
monitoring the T/BS profiles at different time intervals, physical changes in the 285
emulsion can be followed over time, which gives a detailed overview of dispersion 286
stability or instability. In the current work, the stability of the original emulsion was 287
monitored at 4 h intervals during 24 days. Emulsion samples were kept in the ageing 288
station at a constant temperature of 25 ºC. As variations in T profiles were lower than 289
2%, only BS profiles at different storage times were analyzed in this study. 290
2.7.3. Density of the O/W emulsions 292
Density of the O/W emulsions was measured in an Anton Paar DMA 5000 instrument at 293
25 ºC. Measurements were carried out in triplicate. 294
295
2.8. Characterization of the dried powders
296
2.8.1. Yield, moisture, encapsulation efficiency and bioactive loading 297
Yield of particles was calculated as the ratio between the mass of collected particles 298
(mcollected particles) and the theoretical mass fed to the PGSS-drying, spray-drying, or
299
freeze-drying apparatus minitial feed, expressed as weight percentage (Eq. 4).
300
( )
collected particles initial feed mYield % 100
m
= ⋅ (4)
301
Moisture content of the dried particles was determined gravimetrically. Samples (ca. 302
0.5 g) of particles obtained by the different methods used in this work were weighed 303
before and after drying in an oven at 120 ºC until constant weight. 304
Encapsulation efficiency (EE) was determined according to the method described by 305
Wang et al. (Y. Wang, Liu, Dong, & Selomulya, 2016) with some modifications. For 306
the non-encapsulated oil determination, samples (ca. 1.0 g) of particles obtained by the 307
different methods used in this work were suspended with 25 mL of hexane in a Falcon 308
centrifuge tube, which was vortexed for 15 s at room temperature and centrifuged at 309
3000 rpm during 20 min. Immediately afterwards, the supernatant was taken and 310
filtered, and its oil content was measured spectrophotometrically at λ = 286 nm. The 311
same procedure was repeated two additional times to extract the potentially remaining 312
non-encapsulated oil. A calibration curve was previously constructed with known 313
Total oil in the dried particles obtained by the different methods used in this work was 315
determined by acid digestion of approximately 1.0 g of powder with 37% HCl, and 316
subsequent extraction with diethyl ether and petroleum ether, following the AOAC 317
Official Method (AOAC International, 2005). After centrifugation at 3000 rpm during 318
20 min, the solvent phase with the extracted oil was taken and transferred to tared 319
round-bottom flasks in order to evaporate the solvent under vacuum (Heidolph rotary 320
evaporator). Total oil in the samples was determined by mass difference of the initial 321
clean round-bottom flask and that containing the extracted oil residue. As a blank, the 322
same procedure was also followed with known quantities (ca. 1.0 g) of the carrier alone 323
(Hi-Cap™ 100). The fat traces found in the carrier were subtracted from the total oil 324
content of the powders. 325
Encapsulation efficiency (EE) was calculated from Eq. 5. 326
( )
TO nEOEE % = 100
TO
−
⋅ (5)
327
where TO is the total oil content and nEO is the non-encapsulated oil. 328
The bioactive loading, which is also an important parameter of microencapsulated 329
bioactive compounds (Encina et al., 2016),has been also calculated. It can be referred 330
as to the total oil content (TO), expressed as mg oil/g sample. 331
332
2.8.2. Particle size analysis of the dried powders 333
Particle size analysis of the dried powders was carried out in a Malvern Mastersizer 334
2000 equipment, following the same procedure as in the original O/W emulsion (see 335
section 2.7.1), yet dispersing the particles in absolute ethanol to avoid dissolution of the 336
338
2.8.3. Scanning electron microscopy (SEM) 339
Morphology of the dried particles was observed in a Scanning Electron Detector 340
microscope JEOL JSM-6460LV with Energy Dispersive X-ray (JEOL Ltd. Japan) 341
operating at 20 kV. Samples were gold-sputtered and observed with magnifications of 342
1500, 5000 and 10000x for PGSS- and spray-dried particles, and 50, 400 and 2000 or 343
3000x for the freeze-dried powders. 344
345
2.8.4. Differential scanning calorimetry (DSC) 346
A TA Instruments Q200 differential scanning calorimeter with refrigerated cooling 347
system (RCS90) and nitrogen purge gas was used. Melting point and enthalpies of 348
indium were used for temperature and heat capacity calibration. Samples (ca. 10 mg) 349
were placed in TA Tzero 40-μL aluminum pans and closed with hermetic aluminum lids 350
with a pinhole. An empty pan closed with pinholed lid was used as a reference. Starting 351
temperature of the DSC analysis was set at 40 ºC, and held for 30 min. Then, the system 352
was cooled down to -80ºC at 10ºC·min-1. After an isothermal period of 30 min, samples 353
were heated from -80 ºC to 350 ºC at a constant heating rate of 10ºC·min-1. DSC 354
thermograms were recorded and analyzed with the Advantage v. 5.5.20 software (TA 355
Instruments). 356
357
2.9. Measurement of lipid oxidation
358
Oxidative status of the dried powders was determined in terms of primary oxidation 359
(peroxide value, PV) and secondary oxidation (Thiobarbituric Acid Reactive 360
were determined in the n–3 PUFA concentrate, as well as in the O/W emulsions before 362
drying. 363
For the dried powders, PV and TBARS were measured right after each drying method 364
(PGSS-drying, spray-drying, and freeze-drying) and monitored over a 28-day storage 365
period. Dried powders were placed in closed containers and stored at 4 ºC in darkness. 366
Samples were withdrawn at 7-day intervals and dissolved in distilled water to obtain 367
reconstituted emulsions with the original water:carrier:n–3 PUFA concentrate 368
proportion (70:24:6 wt.). PV and TBARS analyses were carried out as described below. 369
370
2.9.1. Peroxide Value 371
PV was measured spectrophotometrically with a Hitachi U-2000 apparatus and 372
following the method described by Shanta et al. (Shantha & Decker, 1994) with slight 373
modifications. In brief, 10-50 mg of oil or 0.025-1.0 mL of emulsion, depending on the 374
expected PV, were taken in a centrifuge tube and mixed with 1.5 mL of isooctane:2-375
propanol (3:1 v/v). The tube was vortexed for 15 s and centrifuged at 5000 rpm during 376
10 min. Immediately afterwards, 0.2 mL of the supernatant were transferred to a new 377
centrifuge tube and 2.8 mL of methanol:1-butanol (2:1 v/v) were added. After vortexing 378
for 15 s, 15 μL of 3.94 M ammonium thiocyanate and 15 μL of a Fe2+ solution were 379
added. The Fe2+ solution was obtained by mixing 0.132 M barium chloride in 0.4 M 380
HCl and 0.144 M Iron(II) sulphate heptahydrate (1:1 v/v), centrifuging at 5000 rpm for 381
10 min, and taking the supernatant. Samples were vortexed again for 15 s and kept in 382
darkness for 20 min. Blanks were prepared the same as above with 0.3 mL of distilled 383
water instead of the oil or emulsion sample. Hydroperoxyde concentration was 384
using known concentrations of cumene hydroperoxide, ranging from 0.13 to 3.28 mM. 386
Results were expressed in milliequivalents of oxygen per kg of n–3 PUFA concentrate 387
(meq O2/kg oil).
388
389
2.9.2. TBARS analysis 390
TBARS present in the n–3 PUFA concentrate were determined following the method 391
described by Ke and Woyewoda (Ke & Woyewoda, 1979). Briefly, 10 mg of n–3 PUFA 392
concentrate were weighed in a screw-capped glass test tube. 5 mL of TBA work 393
solution, which was prepared by mixing 0.04 M 2-thiobarbituric acid in glacial acetic 394
acid, chloroform, and 0.3M sodium sulphite (12:8:1 v/v), were also added to the screw-395
capped glass test tube. The mixture was vortexed for 15 s and incubated in a water bath 396
at 95 ºC during 45 min. After cooling down the test tubes under running cold water, 2.5 397
mL of 0.28 M trichloroacetic acid were added to the samples, which were then mixed 398
by inversion. Samples were then centrifuged at 2500 rpm for 10 min in order to separate 399
the pink aqueous phase from the chloroform phase. Absorbance of the aqueous phase 400
was measured at λ = 538 nm in a Hitachi U-2000 spectrophotometer. Blanks were 401
prepared the same as above, yet without the oil, and subtracted from the absorbance 402
measurement. 403
TBARS analysis of the original and reconstituted O/W emulsions was carried out 404
following the method described by Mei et al. (Mei, McClements, Wu, & Decker, 1998) 405
with slight modifications. Briefly, 0.025-1.0 mL of emulsion, depending on the 406
expected oxidative status, were taken in screw-capped glass test tubes. Distilled water 407
was used to complete to 1.0 mL if necessary. Subsequently, 2 mL of a TCA/TBA 408
adding this solution to 0.1875 g of TBA and completing to volume with 0.25M HCl in a 410
50 mL volumetric flask – were added and the glass test tube was tightly closed, 411
vortexed for 15 s and immersed in a water bath at 95 ºC during 15 min. Then the vials 412
were cooled down under running cold water and centrifuged at 5000 rpm during 10 min. 413
Immediately afterwards, the supernatant was collected and its absorbance measured in a 414
Hitachi U-2000 spectrophotometer at λ = 538 nm. Blank runs were also performed the 415
same as above, but without adding the emulsion, and its absorbance subtracted from the 416
measurements. 417
TBARS concentration in the emulsion and the n–3 PUFA concentrate samples was 418
determined using a TEP standard curve with concentrations ranging from 2.5 to 20 nM. 419
Results were expressed in mg malondialdehyde equivalents (MW = 72.06 g/mol) per kg 420
of n–3 PUFA concentrate (mg MDA/kg oil). 421
422
2.10. Statistical analysis
423
All results reported in this work represent the average of at least three independent 424
measurements. Drying experiments performed in this work have been duplicated. 425
Statistical analyses were performed using Statgraphics Centurion XVII software. 426
Statistical significance was determined by analysis of variance (ANOVA) using the 427
Fisher’s least significant difference test. Results were deemed as statistically significant 428
when p < 0.05. 429
3. Results and discussion
431
3.1. Characterization of the n–3 PUFA concentrate
432
Results obtained in the characterization analysis are summarized in Table S-1 of the 433
provided supplementary material. As it can be seen from Table S-1a, the fatty acid 434
profile of the n–3 PUFA concentrate is constituted by more than 90 % n–3 PUFAs, 435
being 73.49 % identified as DHA. Neutral lipid profile of the n–3 PUFA concentrate 436
(Table S-1b) showed that more than the 75 % of the neutral lipids in the n–3 PUFA 437
concentrate are in the form of triacylglycerides, with 21.6 % being in the form of fatty 438
acid ethyl-esters. Traces of diacylglycerides and monoacylglycerides (1.2% and 0.7 %, 439
respectively) were also found. The high content of triacylglycerides is an important 440
feature of the n–3 PUFA concentrate, since these compounds are the natural form of 441
food lipids and they may present better bioavailability and stability against oxidation 442
(Rubio-Rodríguez et al., 2010). Tocopherol analysis by HPLC-DAD revealed a racemic 443
mixture of tocopherol added as antioxidant (again, this is in consonance with 444
consumer’s preference for natural sources). α-, β-, γ-, and δ-tocopherol isomers were 445
identified and quantified. Results are showed in Table S-1c. 446
447
3.2. Characterization of the O/W emulsion
448
3.2.1. Droplet size of the O/W emulsions 449
Results from the analysis of droplet size distribution are reported in Table 1 for the 450
original and reconstituted O/W emulsions. In general, similar values for D[4,3] and 451
D[3,2] were found in all samples, with the exception of the conventionally freeze-dried 452
means that the reconstituted emulsion from the conventionally freeze-dried powder 454
presented larger mean diameters both in volumetric and surface basis, respectively. 455
Median droplet size by volume (d0.5) of the emulsion is sub-micrometric, with d0.5 =
456
0.114 µm and a D[4,3] and D[3,2] of 0.144 µm and 0.114 µm, respectively. On the 457
other hand, the drying methods proposed in this work significantly increased d0.5 after
458
reconstitution, with the exception being the freeze-dried particles with liquid N2, in
459
which no statistically significant differences were found with the original emulsion (p < 460
0.05). Still, most droplet populations were around 0.130 μm for particles obtained by 461
PGSS-drying, freeze-drying and spray-drying methods, which demonstrates that the 462
proposed drying methods do not produce aggregation of oil droplets. The span values 463
followed the same trend as d0.5, with original emulsion < freeze-drying (liq N2) <
spray-464
drying ≈ freeze-drying (-20 ºC) < PGSS-drying. The higher span values in the 465
reconstituted emulsions may be due to higher polydispersity. 466
467
3.2.2. Emulsion stability 468
Physical stability of the US-assisted O/W emulsion was analyzed by static multiple 469
scattering. Changes in the backscattering profile (ΔBS) of the O/W emulsion sample 470
were recorded every 4 h during 24 days of storage at 25 ºC and plotted vs. time. Results 471
are provided as supplementary material in Fig. S-1. As shown in this figure, ΔBS in the 472
top-section reached 5% increment on day 2 and started to decrease in the lower section 473
(|ΔBS| > 2%) on day 5, indicating creaming destabilization due to phase separation and 474
migration of the lighter oil droplets to the top zone. Moreover, a slight BS increase over 475
time in the middle section of the glass cell can be seen (Fig. S-1), indicating emulsion 476
478
3.2.3. Density of the O/W emulsions 479
Density measurements were carried out for the original emulsion as well as for the 480
reconstituted dried powders. Results obtained are shown in Table 1. 481
No statistical difference (p < 0.05) was found between the densities of the original and 482
reconstituted emulsions, being those the means of three independent measurements. 483
Thus, the average value of 1.091281 g·cm-3 was used for the volume-to-mass 484
transformations necessary in the PV and TBARS calculations. 485
486
3.3. Characterization of the dried powders
487
3.3.1. Yield and bioactive loading 488
Calculated yield of particles and loading of fish oil concentrate of each of the proposed 489
drying methods is showed in Table 1. The spray-drying method exhibits the lowest 490
yield, which is because the particles deposited on the wall of the spraying tower were 491
collected separately and finally not considered due to its low oxidative quality (results 492
not shown). In the PGSS-drying method, some of the finer particles were blown away 493
by the vented CO2 and deposited in the condenser. This wet powder was not collected,
494
slightly reducing the final yield. In the case of the freeze-dried particles, the observed 495
yield is very close to unity. This trend was also observed by other authors (Lévai et al., 496
2017) and may be attributed to the one-pot processing and the preservation of the 497
emulsion structure during freezing. 498
Regarding the bioactive loading, it is close to the maximum theoretical loading of 499
200 mg/g sample in all cases, and no statistical differences (p < 0.05) are observed no 500
particles present a slightly lower average value, which may be attributed to the higher 502
moisture content that will be discussed next. On the other hand, the freeze-dried 503
particles present the highest fish oil concentrate loading, which is possibly linked to the 504
aforementioned preservation of the emulsion integrity. 505
506
3.3.2. Moisture content 507
The moisture content of the particles prepared with different drying methods is showed 508
in Table 1. The spray-dried particles showed the highest residual humidity, whereas the 509
PGSS-drying technique gave the lowest moisture value. Humidity values for the spray-510
dried particles found in this work are higher than those reported in the literature, which 511
are usually around 1-3 % (Carneiro et al., 2013; Hogan, McNamee, O’Riordan, & 512
O’Sullivan, 2001). In the case of the freeze-dried particles, no significant difference in 513
the final humidity was found (p < 0.05), no matter the freezing method used 514
(conventional at -20 ºC or with liquid nitrogen). 515
516
3.3.3. Encapsulation efficiency 517
Encapsulation efficiency is one of the most important quality parameters in 518
encapsulated fish oil and n–3 PUFA concentrates. The presence of free oil may 519
adversely affect the physical properties of the final product, such as flowability and bulk 520
density, and would also enhance lipid oxidation (Y. Wang et al., 2016). Table 1 shows 521
the initial encapsulation efficiency of the drying methods proposed in this work. 522
In general, high initial encapsulation efficiencies, no matter the drying method used, 523
were obtained. It can be noticed that the powder obtained by freeze-drying with 524
encapsulation efficiency, with EE = 95.8 ± 0.2 % (Table 1). As it has been previously 526
mentioned, it is likely that partial destabilization of the emulsion and release of small 527
amounts of n–3 PUFA concentrate may have happened, probably due to the mechanical 528
and hygroscopic forces caused by the growing of large water crystals during the slow 529
freezing process. By comparison, freeze-dried particles obtained with liquid nitrogen 530
present the highest encapsulation efficiency with 98.6 ± 0.1 % (Table 1), which reflects 531
that the emulsion casting is preserved with a rapid and deep freezing step. Similar 532
results have been also obtained by Lévai et al. (Lévai et al., 2017) dealing with freeze-533
dried quercetin encapsulated in soybean lecithin. Still, more than 95 % of the total n–3 534
PUFA concentrate loading was encapsulated by conventional freeze-drying, and almost 535
98 % encapsulation efficiency was obtained by PGSS-drying (97.9 ± 0.3 %), which is 536
similar to the EE value of the spray-dried microparticles (97.5 ± 0.1 %). Carneiro et al.
537
(Carneiro et al., 2013) compared combinations of maltodextrin and Hi-Cap and other 538
wall materials to encapsulate flaxseed oil by spray-drying, finding Hi-Cap as the best in 539
terms of EE, with 95.7 %. Results obtained in this work are slightly higher in all cases 540
except for conventionally freeze-dried particles, which may be attributed to the 541
optimized US-assisted emulsification process. 542
Surface oil of the dried particles has been analyzed over time during 28 days of storage 543
at 4ºC in darkness and ambient oxygen concentration to check if some of the n–3 PUFA 544
concentrate could have been released. Results obtained are summarized in Fig. S-2 of 545
the supplementary material. As Fig. S-2 shows, spray-dried particles released around 546
2% of the total encapsulated n–3 PUFA concentrate during the first 7 days and then the 547
release continued at a lower rate, down to 94 % encapsulated oil after 28 days. In the 548
case of the conventionally freeze-dried particles, a slight decrease in the encapsulated 549
dried particles frozen with liquid N2, no significant changes in the encapsulation
551
efficiency were noted during the first 21 days and only a slight decrease started to occur 552
after the fourth week of storage. 553
554
3.3.4. Particle Size Analysis 555
The particle size distribution plot of PGSS-dried and spray dried particles is provided in 556
Fig. 2. Particle mean diameters (d0.5) varied from 28.605 µm for PGSS-dried particles to
557
35.375 µm for the spray-dried particles. The span value of the PGSS-dried particles 558
(1.663) was also lower than that of the spray-dried particles (6.082). 559
The microparticles produced by spray drying showed a bimodal distribution with a 560
group of particles centered around 30 µm and a second population around 250 µm. This 561
justifies the high span value and may be linked to particle swelling during drying as 562
well as to agglomeration due to the higher moisture content. This agglomerated clusters 563
are also visible in the SEM images showed in Fig. 3b and discussed in the next section. 564
On the other hand, the PGSS-dried particles show a monomodal particle size 565
distribution with smaller mean diameter. As it has been reported in previous works (de 566
Paz et al., 2012), the effective atomization caused by CO2 vaporization may have led to
567
the production of smaller and monodisperse particles. 568
569
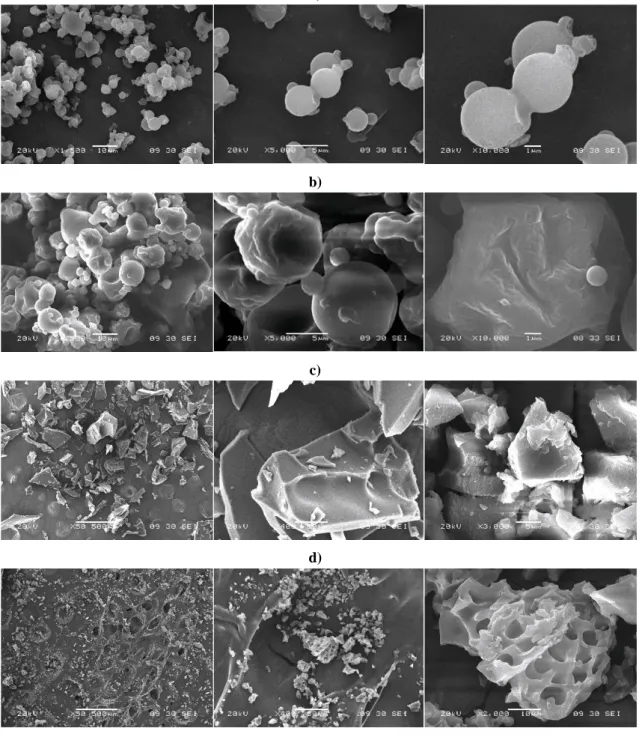
3.3.5. Particle morphology (SEM) 570
Visual morphology of the dried powders can be observed in the SEM micrographs 571
(Fig. 3). Both PGSS- and spray-dried particles present spherical morphology. For the 572
observed together with some larger agglomerates around 10-20 µm diameter (Fig. 3a). 574
Fractured particles are also seen in some micrographs, showing a porous internal 575
structure in which the n–3 PUFA concentrate is probably encapsulated. As it has been 576
also observed in the particle size analysis, spray-dried particles show more variance in 577
size. A small population of microparticles around 2 µm was detected together with 578
some specimens larger than 20 µm and particle clusters around 150 µm (Fig. 3b), which 579
is also in accordance with the results obtained in the particle size analysis (section 580
3.3.4). This variety in size has been also reported in the literature (Carneiro et al., 2013), 581
and seems to be a typical characteristic of particles produced by spray drying. Spray-582
dried particles also showed a rougher surface than PGSS-dried samples, with more 583
imperfections or ‘teeth’. These surface depressions are associated to the collapse of the 584
particle hollow core once the crust is formed during the initial stages of drying. Similar 585
morphological characteristics have been also found in the literature, either with OSA-586
starch as encapsulating agent (Carneiro et al., 2013), or with other materialas such as β-587
glucans (Salgado, Rodríguez-Rojo, Alves-Santos & Cocero, 2015). 588
In the case of the freeze-dried particles, larger and more irregular particles have been 589
produced. Conventionally freeze-dried powder presents a flakey or scaly appearance, 590
forming planar structures with some dimensions being larger than 100 µm (Fig. 3c). 591
Some dents can be seen in the surface of several particles, probably corresponding to 592
the voids left by water crystals after sublimation. In larger magnifications (3000x) a 593
porous internal structure can be also appreciated, being the n–3 PUFA concentrate 594
likely encapsulated inside these vesicles. In the case of the freeze-dried powder frozen 595
with liquid N2 (Fig. 3d), a powder finer than the conventionally frozen (Fig. 3c) has
596
by liquid nitrogen boiling during freezing of the O/W emulsion. These alveolar holes 598
present diameters around 5-7.5 µm. 599
600
3.3.6. Differential Scanning Calorimetry (DSC) 601
DSC runs of PGSS-dried particles, modified OSA-starch (Hi-Cap 100) used as a carrier, 602
and n–3 PUFA concentrate revealed cold-crystallization, glass-transition (gelatinization) 603
and melting peaks. The peak temperatures of these thermal events are summarized in 604
Table 2. Endothermic peaks near 80 ºC were observed in the PGSS-dried and Hi-Cap 605
100 samples, which probably correspond to the glass transition (gelatinization) of OSA-606
starch. A second endothermic peak was found around 220 ºC in both PGSS-dried 607
particles and Hi-Cap 100, which may be linked to the melting of OSA-starch. Similar 608
glass-transition and melting temperatures have been reported in the literature for this 609
polymer (Yu & Christie, 2001). 610
In the lower temperature range, an exothermic cold-crystallization peak was noticeable 611
for the n–3 PUFA concentrate and for the PGSS-dried particles, which may correspond 612
to some lipid compound of the n–3 PUFA concentrate transitioning from liquid to solid 613
state. This assumption can be corroborated by the studies of Tolstorebrov et al.
614
(Tolstorebrov, Eikevik, & Bantle, 2014), in which cold-crystallization peaks in the 615
range -75 to -55 ºC have been reported for some olein-, linolenin-, and linolein-616
containing tryacylglycerides, which are minoritary constituents of the n–3 PUFA 617
concentrate (Table S-1a). The slightly lower crystallization temperature observed in the 618
PGSS-dried particles compared to the n–3 PUFA concentrate alone (Algatrium™ Plus) 619
is probably linked to the particle shell offering heat transfer resistance to the 620
622
3.4. Oxidative stability of the dried powders
623
Peroxide value (PV) and thiobarbituric acid reactive substances (TBARS) have been 624
systematically determined in the PGSS-dried powders with and without ascorbic acid 625
(AA) during 28 days of storage at 4 ºC and dark conditions. In order to determine the 626
initial oxidative status, PV and TBARS were measured in the n–3 PUFA concentrate 627
and in the original emulsion right after US-assisted emulsification. With the purpose of 628
comparing the different drying methods used in this work, PV and TBARS of the spray-629
dried and the freeze-dried particles were measured after formulation of the powders 630
(day 0) and after 28 days of storage under the same conditions as the PGSS-dried 631
particles (4ºC, darkness). Results obtained are summarized in Fig. 4. 632
Fig. 4a shows that PV increases from 1.64 ± 0.05 meq O2/kg oil in the n–3 PUFA
633
concentrate up to 5.6 ± 0.3 meq O2/kg oil during the US-assisted emulsification process,
634
which slightly surpasses the maximum limit of 5 meq O2/kg oil for fish oil concentrates
635
intended for direct human consumption (Codex Alimentarius Comission, 2017). It is 636
likely that the high energy input involved in the ultrasonication process promoted a 637
temperature increase that may negatively affect the oxidative status of the n–3 PUFA 638
concentrate (Abbas et al., 2013). As a strategy to prevent primary oxidation during US-639
assisted emulsification, 20 mM ascorbic acid (AA) was added to the emulsion 640
formulation. AA concentration was selected based on Uluata et al. (Uluata et al., 2015) 641
studies on lipid oxidation in O/W emulsions. 642
As it can be seen in Fig. 4a inset (O/W emulsion), the antioxidant successfully protected 643
the n–3 PUFA concentrate and even reduced the PV of the emulsion down to 0.19 ± 644
0.03 meq O2/kg oil. This behaviour has been also observed by Uluata et al. in O/W
645
inactivate free radicals such as lipid hydroperoxides. Other mechanisms can be also 647
involved in the observed antioxidant activity, since AA can act as an oxygen scavenger 648
thanks to the enediol group in carbons 2 and 3 (Johnson, 1995; Liao & Seib, 1988), or 649
even play a synergistic role by means of regenerating other antioxidants such as the 650
tocopherol originally present in the n–3 PUFA concentrate (Reische, Lillard, & 651
Eitenmiller, 2008). However, it is not easy to determine which of these pathways is 652
taking place in any given food system (Uluata et al., 2015) and it is likely that all of 653
them occur simultaneously. 654
If we focus on the PV results obtained after formulation of the dried particles (Fig. 4a 655
day 0), it can be seen that PGSS-drying promoted a slight PV increase up to 5.9 ± 1.5 656
meq O2/kg oil in the emulsion without AA, although this value is not significantly
657
different (p < 0.05) from the PV of the original emulsion. Furthermore, AA addition had 658
a significant (p < 0.05) effect on the PV of the PGSS-dried particles, since only a slight 659
increase from 0.19 ± 0.03 to 0.5 ± 0.1 meq O2/kg oil was observed in the PGSS-dried
660
particles with antioxidant (Fig. 4a day 0). On the other hand, the spray-drying process 661
yielded particles with much lower oxidative quality (PV = 28.0 ±1.6 meq O2/kg oil). As
662
some authors have pointed out for the spray-drying process (Drusch & Berg, 2008; H. 663
Wang et al., 2011), it is likely that the rapid formation of the particle shell increased the 664
resistance to evaporation of water trapped inside the particle core, promoting a rapid 665
temperature increase in the particles and prolonging the n–3 PUFA exposure to high 666
temperatures, thus promoting oxidation and increasing the PV after spray-drying 667
formulation. The freeze-drying process with liquid nitrogen achieved good results, with 668
PV = 4.6 ± 1.8 meq O2/kg oil, which is not statistically different (p < 0.05) from that of
669
the original emulsion (Fig. 4a day 0). This result can be related to the freeze-drying 670
high processing temperatures and processed in absence of light and in an almost inert 672
atmosphere due to vacuum conditions. Unexpectedly, the conventionally frozen 673
emulsion did overcome oxidation despite the favourable processing conditions, showing 674
a PV = 12.4 ± 1.5 meq O2/kg oil (Fig. 4a day 0). This is likely due to oxygen contact
675
during the conventional freezing step, in which the samples were held overnight at -676
20ºC under ambient oxygen concentration. 677
In view of the results (Fig. 4a day 0), we can infer that PGSS-drying is a suitable 678
method to formulate dried particles loaded with n–3 PUFAs, more so if we combine the 679
mild processing conditions with the addition of an antioxidant such as AA. As it has 680
been previously stated, the short residence time of the O/W emulsion in the PGSS-681
drying system as well as the inert CO2 atmosphere prevent the loaded bioactive
682
compounds from degradation (Weidner, 2009) and as such, the n–3 PUFA concentrate 683
can be successfully protected from oxidation. 684
Oxidative stability of the PGSS-dried particles was monitored during 28 days of storage 685
in darkness at 4 ºC (Fig. 4a days 1-28). Results obtained showed a sustained increase of 686
primary oxidation, reaching values of PV = 25.2 ± 0.7 meq O2/kg oil after 28 days of
687
storage (Fig. 4a). On the other hand, AA successfully protected the PGSS-dried 688
particles from primary oxidation during storage, being the values found significantly 689
lower (p < 0.05) than those of the PGSS-dried particles without antioxidant. The highest 690
PV was found after 14 days of storage and was 2.5 ± 0.5 meq O2/kg oil, still below the
691
maximum allowable limit according to legislation, and remained with no significant 692
changes (p < 0.05) during the rest of the 28-day storage period, reaching a final value of 693
2.2 ± 0.3 meq O2/kg oil (Fig. 4a).
Comparing the primary oxidation of the particles obtained by the different drying 695
methods after 28 days of storage, we can see the same trend as in the PV analysis after 696
formulation, although PV increased in all samples (Fig. 4a days 1-28). Freeze-dried 697
particles frozen with liquid nitrogen maintained a relatively low PV of 16.9 ± 0.8 meq 698
O2/kg oil, which is likely linked to the good encapsulation efficiency and the
699
preservation of the physical structure of the emulsion thanks to the fast and deep-700
cooling effect of liquid nitrogen. The same was not true for the conventionally freeze-701
dried particles, with PV = 37.7 ± 3.7 meq O2/kg oil after 28 days of storage. Spray-dried
702
particles showed the highest PV with 66.0 ± 0.4 meq O2/kg oil after 28 days of storage.
703
The higher oxidation rates of these two samples (spray-drying and conventional freeze-704
drying) are probably due to the high starting PV (day 0) as well as their lower 705
encapsulation efficiency, which implies more oil in the particle surface susceptible to 706
oxidation. A similar encapsulation efficiency vs. oxidation rate inverse relationship has 707
been observed by other authors (Yang & Ciftci, 2017). However, PGSS-dried and 708
freeze-dried particles with liquid nitrogen exhibited high encapsulation efficiencies (up 709
to 98%), and still encapsulated n–3 PUFA concentrate was not fully protected against 710
primary oxidation (PV after 28 days = 25.2 ± 2.2 and 16.9 ± 0.8 meq O2/kg oil,
711
respectively). This trend can be explained by taking into account not only the oxidation 712
of the oil present in the particle surface, but also oxygen diffusion through the 713
encapsulating material. It must be also pointed out that the fish oil concentrate used in 714
this work is extremely rich in n–3 PUFAs, which are highly prone to oxidation. This 715
highly sensitive-to-oxidation fatty acid profile may also offer an explanation to the 716
higher oxidation rates obtained in this work compared to other studies, even with no 717
TBARS analysis results are summarized in Fig. 4b. Although there is no legal 719
maximum limit for this parameter in food products, we can take the values of 10 µmol 720
MDA equiv/kg fish and 1-2 µmol MDA equiv/g fat given in the FAO guidelines (Huss, 721
1995) as an orientative basis to evaluate rancidity of the n–3 PUFA concentrate (1 µmol 722
MDA equiv/g fat corresponds to 72.06 mg MDA/kg oil). From Fig. 4b we can see that 723
initial TBARS of the n–3 PUFA concentrate lay below this rancidity limit (TBARS = 724
41.1 ± 2.7 mg MDA/kg oil). US-assisted emulsification slightly increased the TBARS 725
value up to 54.8 ± 0.6 mg MDA/kg oil in the formulation without AA, whereas the 726
addition of AA yielded particles with TBARS = 42.8 ± 1 mg MDA/kg oil (Fig. 4b day 727
0). In view of the results, AA addition slowed down secondary oxidation during the 728
ultrasonication step since no significant difference (p <0.05) between the AA-added 729
emulsion and the n–3 PUFA concentrate was found (Fig. 3b inset). 730
Among the dried powders (Fig. 4b, day 0), spray-dried particles showed the highest 731
secondary oxidative status with a TBARS value of 88.5 ± 6.0 mg MDA/kg oil, which is 732
above the FAO rancidity limit (Huss, 1995). PGSS-drying process slightly increased 733
TBARS up to 59.4 ± 4.4 mg MDA/kg oil, whereas the addition of AA did not make any 734
statistically significant difference (p < 0.05). Both PGSS-drying with and without AA, 735
and freeze-dried powder with liquid N2 showed no statistically significant differences
736
with the original emulsion, which gives an idea of the protective effect of these drying 737
techniques against secondary oxidation. On the contrary, the conventionally frozen 738
particles were not successfully protected, and TBARS increased up to 74.5 ± 3.5 mg 739
MDA/kg oil after the conventional freeze-drying process. 740
Secondary oxidation products were also monitored in the PGSS-dried particles during 741
the 28-day storage period. In Fig. 4b (days 1-28), we can see that TBARS in the PGSS-742
week of storage, when TBARS value raised from 69.2 ± 1.4 up to 110.9 ± 1.8 mg 744
MDA/kg oil, reaching a final value of 141.0 ± 1.9 mg MDA/kg oil after 28 days of 745
storage. On the other hand, AA addition delayed secondary oxidation for the first 14 746
days of storage, obtaining significantly lower (p < 0.05) TBARS values than those of 747
the control sample without antioxidant, yet increasing thereafter and even exceeding the 748
control after 28 days of storage (TBARS = 141.0 ±1.9 mg MDA/kg oil). As previously 749
mentioned, this behavior has been observed by other authors when studying the effect 750
of ascorbic acid on lipid oxidation in O/W emulsions, especially in presence of 751
transition metals such as iron and copper (Mei et al., 1998; Uluata et al., 2015). Uluata 752
et al. (Uluata et al., 2015) provide an explanation related to the ability of AA to reduce 753
metal ions, making them more reactive towards peroxides and hydroperoxides. 754
According to this proposed mechanism, reduced metallic species would decompose 755
peroxides and hydroperoxides into secondary oxidation products, increasing the 756
observed TBARS and preventing the accumulation of primary oxidation intermediaries 757
(Uluata et al., 2015). This behavior has been also observed in this work, although no 758
metals were added to the O/W emulsion. However, and according to inductively 759
coupled plasma mass spectrometry (ICP-MS) analysis (Table S-2), metal traces are 760
present in the encapsulating material, enabling this hypothesis. 761
Additionally, it has been found that spray-dried and conventionally freeze-dried 762
particles underwent secondary oxidation during the 28-day storage period, with final 763
TBARS values of 137.2 ± 4.7 mg MDA/kg oil and 166.6 ± 0.3 mg MDA/kg oil, 764
respectively (Fig. 4b days 1-28). Again, this high secondary oxidation status might be 765
linked to the poorer encapsulation efficiency of those methods. On the other hand, 766
freeze-dried particles frozen with liquid N2 showed good stability against secondary
oxidation during storage, maintaining a TBARS value of 79.6 ± 2.4 during 28 days of 768
storage at 4ºC. 769
770
4. Conclusion
771
Particles from Gas-Saturated Solutions (PGSS)-drying has been used to encapsulate 772
omega–3 polyunsaturated fatty acids (n–3 PUFAs) into octenyl-succinic-anhydride 773
(OSA) starch, obtaining a solid powder with high bioactive load. 774
Similar encapsulation efficiencies (EE) and spherical morphologies have been obtained 775
by PGSS and spray-drying. 776
Freeze-dried particles showed irregular morphology. Slow conventional freezing 777
destabilizes the O/W emulsion and negatively affects EE. DSC analysis of the PGSS-778
dried particles successfully identified cold crystallization of the n–3 PUFA concentrate 779
as well as gelatinization and melting peaks of OSA-starch. 780
PGSS-drying method offers low drying temperature and an intrinsically inert 781
atmosphere, which avoid oxidative degradation of n–3 PUFAs during processing, as 782
demonstrated by the oxidative stability analyses. Conventional freeze-drying method 783
yielded particles with low oxidative stability, whereas freezing with liquid N2 resulted
784
in a powder with oxidative stability comparable to PGSS-dried particles. Combined 785
with the addition of natural antioxidants such as ascorbic acid, the PGSS-drying 786
technique rises as a suitable method to formulate n–3 PUFAs in solid form and protect 787
them against oxidation during shelf life. 788
Acknowledgements
790
To Junta de Castilla y León and the European Regional Development Fund for financial 791
support of the project BU055U16 and ÓB’s post-doctoral contract. To Spanish Ministry 792
of Economy and Competitiveness for RM’s pre-doctoral contract [BES-2013-063937] 793
and EP’s post-doctoral contract [FJCI-2014-19850]. 794
795
References
796
Abbas, S., Hayat, K., Karangwa, E., Bashari, M. & Zhang, X. (2013). An overview of 797
ultrasound-assisted food-grade nanoemulsions. Food Engineering Reviews, 5, 139– 798
157. https://doi.org/10.1007/s12393-013-9066-3 799
AOAC International. (2005). Official methods of analysis of the Association of Official
800
Analytical Chemists. AOAC Official Method 925.32. Fat in eggs, acid hydrolysis
801
method (Vol. 6). Washington, DC. 802
AOAC International. (2012). Official methods of analysis of the Association of Official
803
Analytical Chemists. AOAC Official Method 2012.13. Determination of labeled
804
fatty acids content in milk products and infant formula. Washington, DC. 805
Baik, M. Y., Suhendro, E. L., Nawar, W. W., McClements, D. J., Decker, E. A., & 806
Chinachoti, P. (2004). Effects of Antioxidants and Humidity on the Oxidative 807
Stability of Microencapsulated Fish Oil. JAOCS, Journal of the American Oil
808
Chemists’ Society, 81(4), 355–360. https://doi.org/10.1007/s11746-004-0906-7 809
Bakry, A. M., Abbas, S., Ali, B., Majeed, H., Abouelwafa, M. Y., Mousa, A., & Liang, 810
L. (2016). Microencapsulation of Oils: A Comprehensive Review of Benefits, 811
Techniques, and Applications. Comprehensive Reviews in Food Science and Food
812
Safety, 15(1), 143–182. https://doi.org/10.1111/1541-4337.12179 813
Carneiro, H. C. F., Tonon, R. V, Grosso, C. R. F., & Hubinger, M. D. (2013). 814
Encapsulation efficiency and oxidative stability of flaxseed oil microencapsulated 815
by spray drying using different combinations of wall materials. Journal of Food
816
Engineering, 115(4), 443–451. https://doi.org/10.1016/j.jfoodeng.2012.03.033 817
Chatterjee, S., & Judeh, Z. M. A. (2015). Encapsulation of fish oil with N -stearoyl O-818
butylglyceryl chitosan using membrane and ultrasonic emulsification processes. 819
Carbohydrate Polymers, 123, 432–442.
820
https://doi.org/10.1016/j.carbpol.2015.01.072 821
Codex Alimentarius Comission, Standard for fish oils Codex Stan 329-2017. (2017). 822
Rome, Italy. 823
de Paz, E., Martín, Á., & Cocero, M. J. (2012). Formulation of β-carotene with soybean 824
lecithin by PGSS (Particles from Gas Saturated Solutions)-drying. The Journal of
825
Supercritical Fluids, 72, 125–133. https://doi.org/10.1016/j.supflu.2012.08.007 826
de Paz, E., Martín, T., Bartolomé, A., Largo, M., & Cocero, M. J. (2014). Development 827