Article
Short-Term Energy Demand Forecast in Hotels Using
Hybrid Intelligent Modeling
†
José-Luis Casteleiro-Roca1,2,‡ , José Francisco Gómez-González3,‡ , José Luis Calvo-Rolle1,‡ , Esteban Jove1,2,‡ , Héctor Quintián1,‡ , Benjamin Gonzalez Diaz3,‡
and Juan Albino Mendez Perez2,*,‡
1 Department of Industrial Engineering, University of A Coruña, A Coruña 15280, Spain;
[email protected] (J.-L.C.-R.); [email protected] (J.L.C.-R.); [email protected] (E.J.); [email protected] (H.Q.)
2 Department of Computer Science and System Engineering, Universidad de La Laguna,
La Laguna 38200, Spain
3 Department of Industrial Engineering, Universidad de La Laguna, La Laguna 38200, Spain;
[email protected] (J.F.G.-G.); [email protected] (B.G.D.)
* Correspondence: [email protected]; Tel.: +34-922-316-502 (ext. 6836)
† This paper is the extension of the conference paper: Casteleiro-Roca, J.-L.; Gómez-González, J.F.; Calvo-Rolle, J.L.; Jove, E.; Quintián, H.; Acosta Martín, J.F.; Gonzalez Perez, S.; Gonzalez Diaz, B.; Calero-Garcia, F. and Méndez-Perez, J.A. Prediction of the Energy Demand of a Hotel Using an Artificial Intelligence-Based Model. In Proceedings of the 13th International Conference, Hybrid Artificial Intelligent Systems (HAIS), Oviedo, Spain, 20–22 June 2018.
‡ These authors contributed equally to this work.
Received: 28 April 2019; Accepted: 27 May 2019; Published: 31 May 2019
Abstract:The hotel industry is an important energy consumer that needs efficient energy management methods to guarantee its performance and sustainability. The new role of hotels as prosumers increases the difficulty in the design of these methods. Also, the scenery is more complex as renewable energy systems are present in the hotel energy mix. The performance of energy management systems greatly depends on the use of reliable predictions for energy load. This paper presents a new methodology to predict energy load in a hotel based on intelligent techniques. The model proposed is based on a hybrid intelligent topology implemented with a combination of clustering techniques and intelligent regression methods (Artificial Neural Network and Support Vector Regression). The model includes its own energy demand information, occupancy rate, and temperature as inputs. The validation was done using real hotel data and compared with time-series models. Forecasts obtained were satisfactory, showing a promising potential for its use in energy management systems in hotel resorts.
Keywords: energy forecast; artificial neural network; hybrid modeling; support vector regression; hotel; tourism
1. Introduction
The tourism sector has become a very important sector, and its activity plays a key role in the development of regions and the use of raw materials and energy that influence the environment. According to the World Tourism Organization (UNWTO), tourism accounts for almost 10% of the World Gross Domestic Product (GDP) and is responsible for 1 out of every 10 jobs in the world. The tourism sector, worldwide, ranks fourth in terms of export volume, after fuels, chemicals, and food. The world tourism grew, according to the UNWTO, by 7% in 2018 compared to the same period in the previous year, which is the highest growth in international tourist arrivals since 2010.
After transportation, the hotel industry is the activity with the most energy consumption. The average hotel consumption ranges can be between 450 and 700 kWh/m2per year, corresponding to over 60% of electricity. However, these values are quite variable depending, among other things, on the climatic conditions and the category of the hotel [1]. Any scenario for the study of energy consumption and the incorporation of renewable energies in the tourism sector should be mainly focused on the study of the hotel sector. In particular, in tourism-based economies, there are several conditions, such as a high number of visitors, a long average stay, and a high percentage of quality hotels, that make the hotel sector an important element for energy demand profiles. In practice, the entire area where the hotel is located is affected by its activity. On the other hand, most overnight stays are made in hotels with 4 or more stars. Therefore, the high standing of the hotel sector with its particular profile plays a central role in tourism development and energy demand profile.
To achieve the objectives of reducing consumption, efficient energy measures must be implemented, and renewable energy production technologies must be introduced. In a study carried out in a large hotel in the subtropical zone of the coast of Queensland in Australia, it is concluded (with 2004 prices) that renewable energy sources by themselves are neither technically nor economically viable, but they will be if a connection to the electricity grid exists [2].
Many studies have focused on the analysis of energy performance in hotels. In a study by Dang & Burnett [3], they showed the difficulties in assessing energy performance in hotels. The study showed that performance indexes defined for other types of commercial buildings are not adequate for assessing energy performance of hotel buildings. In other works, models to correlate the energy demand with different hotel parameters were proposed. Most common parameters were the occupancy, the number of beds, and the number of workers. However, results suggest that it is not easy to find a model that suits all hotels. For example, a study by Papamarcou and Kalogirou [4] showed that for a hotel in Cyprus, there was a good quadratic correlation between electricity consumption and the number of guests, but another author, Priyadarshini et al. [5], did not find that same relationship in hotels in Singapore. Another example is the work of Cabello and collaborators [6], who apply an energy efficiency index that considers the outdoor ambient temperature, and that was implemented in two hotels in Cuba, achieving a 10% reduction in electricity consumption. Therefore, the definition of efficient numerical indexes for energy performance is a task that has not yet been resolved, and which depends on the type of hotel, location, climate, etc.
The need for reliable tools for energy forecast seems clear. This will allow for a better planning of hotel activities and management of energy resources. Consequently, industrial activity could be developed more sustainably and respectfully in an environmentally aware way, thus reducing the ecological footprint. In addition, energy demand management helps to achieve self-sufficiency and cost effectiveness. In this sense, for instance, the Hilton Worldwide has implemented its LightStay platform developed to calculate and analyze the environmental and societal impact of every Hilton Worldwide branded hotel [7]. Presently, the LightStay can track historical energy and weather data to forecast future energy consumption levels and predict the impact of performance on cost, to take corrective actions to influence future performance. These kinds of systems are commonly integrated in the Building Management System (BMS) that will propose the best management of 6 resources in the hotel to guarantee the efficient use of energy resources. The success of these systems depends on the availability of accurate forecasting models.
most-used techniques and is based on using past values to predict future load values. The most-used time-series models are ARMA (Auto-Regressive Moving Average) and ARIMA (Auto-Regressive Integrated Moving Average) which use time and load as input parameters. ARIMAX (Auto-Regressive Integrated Moving Average with eXplanatory variable) is a variation of these models that includes exogenous variables [8–10]. An extension to ARIMA that supports the modeling of the seasonal component of the data is the Seasonal ARIMA (SARIMA), which has been proven to have better performance when this seasonal effect is present [10].
The rapid growth of available computational power and the development of new artificial intelligence methods has made possible the extensive use of these techniques for the prediction of both energy generation and consumption. Many examples of Artificial Intelligence (AI) based on predictive models can be found in the recent literature [11–19]. In [20], a model based on an Artificial Neural Network (ANN) to forecast building energy consumption is proposed. Recently, Muralitharan et al. [21] compared different neural networks for energy demand prediction in a smart grid. In the same sense, other authors [22,23], used fuzzy logic to calculate the load curve of a residential consumer. In [24], the authors propose a deep-learning framework to forecast electricity demand based on a Long Short-Term Memory network. They incorporated a moving window-based technique to improve the results compared to other neural network-based structures. In [25] the accuracy and generalization capabilities of some machine-learning-based techniques for predicting hourly Heating, Ventilation and Air Conditioning (HVAC) energy consumption of a hotel building is studied. In particular, a model based on Deep Highway Networks (DHN), Extremely randomized Trees (ET), and Support Vector Regression (SVR) were proposed for predicting hourly HVAC energy consumption of a hotel. No significant differences were found between them. Other proposals that also use machine learning can be found in [26–31].
This work is focused specifically in hotel modeling. The main contribution of our work is the proposal of an intelligent model to efficiently predict the energy demand in a hotel. The hotel energy consumption in a 24 h horizon is provided. We implemented the model in a luxury 5-star hotel on the island of Tenerife, Spain. The advantage of the model is that first, a sequential hybrid structure is considered. Thus, for each prediction time instant, an intelligent hybrid model is obtained. The hybrid nature increases the accuracy of the model as it can efficiently incorporate the nonlinear nature of the process. Secondly, the model can easily include information of the main variables affecting the load demand in the hotel. The resulting model is validated and compared with a time-series model based on the ARIMAX structure and three SVM-based methods.
The organization of this paper is structured as follows. First, an introduction to energy management systems is presented. In the next section, the methods used in the work are described. Then, the model for the prediction of daily energy demand is proposed. Finally, in the Results and Discussion Section, the main results are presented, in which the real energy demand and the predicted demand are compared and analyzed.
2. Energy Management in the Hotel Industry
The high energy demand associated with tourism activities makes necessary the implementation of efficient energy management strategies to reduce their environmental impact and to minimize the cost of operation. The activities that involve more energy consumption in the hotel industry are HVAC, lighting, domestic hot water (DHW), swimming pools heating, kitchens, and leisure activities. According to UNWTO, air conditioning consumes most of the demanded energy (with typical values higher than 40%). Energy consumption in DHW systems is around 15% of total energy, while lighting entails a much more variable energy demand (15% to 40%), depending on the type of hotel.
elements of the installation (HVAC, DHW, etc.). A BMS is based on a computerized system that defines the preset requirements of the whole building and controls the different systems to take the building to the desired state of operation. A BMS needs information from different sensors to take decisions. Part of this information can be predictions of the future evolution related to building facilities, weather conditions, energy generation or consumption, etc.
Additional difficulties are related to the introduction of renewable sources as energy generators. This new scenario, where hotels become prosumers, requires advanced control systems that allow the integration of this energy resource into the system in the most efficient manner. For this purpose, EMS (Energy Management Systems) arise. These systems are used for the monitoring, control, and optimization of the generation, transmission, and distribution of energy and, also, the management of microgrids. EMS (that can be integrated as a module of the BMS) analyze the behavior of the network components and make decisions about their efficient management. The main functions in isolated systems are related to ensuring the supply of energy to the load in all conditions, ensuring maximum use of the renewable source, minimizing the cost of energy (COE), protecting the components to avoid damage by overload, and guaranteeing the stability of the power system. For systems connected to the network, these functions include the control of the flow of energy to and from the network (generally aimed at reducing the flow of energy to the grid and improving self-consumption), monitoring the network, displacement of peaks in the curve of cargo and the management of the use of periods of low tariffs [32].
There are many studies where different strategies for energy management systems are collected. Many of them are based on the application of optimization techniques with linear programming [33] and with predictive control [34]. All these studies propose strategies to control the flow of energy between various generation systems, storage systems, loads, and the network. Different proposals based on AI techniques have also emerged to address this problem [35]. Among them, techniques based on fuzzy logic have been very successful in their application [36]. In the particular case of hotels, there are also examples of systems for advanced energy analysis and management such as those proposed in [6]. In this paper, a discussion about the indicators used for the prediction and control of electricity consumption in hotels is done and a new indicator proposal is made to detect more efficiently overconsumption or bad practices in energy management. In [37] a proposal for decision-making based on fuzzy logic is presented for the evaluation of energy-saving technologies in luxury hotels. Other works have focused on the development of control algorithms for the different services or activities of the hotel. In [38], nonlinear predictive control improved energy savings in hotel rooms. Another application is presented in [39] where the development of a control algorithm for the efficient operation of the cold plant in a hotel in a tropical area is addressed. The results in both cases highlight the importance of advanced control algorithms to improve energy savings and efficiency in hotels.
In the design of energy management systems, new advanced methods are based on the use of generation and/or load forecasts. In the work by Riverón et al. [40], an advanced energy management system to control the power flow in a hybrid generation energy system connected to grid and with energy storage is presented. One of the features of this proposal is the use of predictions as inputs to the EMS. This produces a significant increase in the performance of the system. Thus, the availability of reliable predictions will be necessary in advanced management systems to improve the overall system efficiency. The present work tries to contribute to this by proposing an intelligent prediction model to forecast the hotel load.
3. Methods
3.1. Data
increase of +11% in 2016 and the average duration of the stay of the tourism hosted was 7.54 days. Until July 2016, 68% of the lodged did so in hotels, compared to 32% who were extra-hoteliers. According to the number of hotel places in Tenerife, 74% of places have 4 or more stars (information obtained from the Canary Islands Statistics Institute). As can be concluded from these data, the hotel sector has a key importance in tourism development and hence in the economic sustainability of the island.
The methodology used to model the energy load in hotels is based on the use of real data from hotel resorts. The same data will be used to obtain a hybrid model based on intelligent techniques and to develop time-series models. The work presented here is based on data kindly provided by a luxury 5-star hotel, in the south of Tenerife, Canary Islands (Spain), located on the Atlantic Ocean (28.100◦N, 15.400◦W). These data consisted of demand of electricity, daily mean temperature, and occupation rate during a year recorded from 1 November 2016 to 31 October 2017 with a sample rate of one sample/hour).
The daily power demand of the hospitality sector and a single hotel (our case of study) is shown in Figure1A. The figure shows that demand profile of the hotel is quite similar to the hospitality sector. Consequently, the hotel selected for this work is a representative example of the demand of the tourism sector in Canary Islands.
The types of energy sources used in the hotel are: electricity from the grid, gas-oil, and thermal solar. However, the main consumed energy comes from the electric energy from the power grid. Regarding the consumption of electrical energy, Figure1B shows the occupancy percentage of the hotel, the average outside temperature, and at the same time, the electrical energy consumed during 2017. From these data, we can estimate that on average a room night spends 118 kWh of electrical energy (or 144 kWh in total taking account the rest of energy sources).
Figure 1. Energy and occupancy in 2017 in the hotel under study. (A) Power demand profile in hospitality sector. Elaborated with information provided by ENDESA and a luxury 5-star hotel. (B) Energy consumed and occupancy in 2017 in the hotel, and exterior temperature variation along 2017 from the nearest meteorological station, i.e., at the Tenerife South Airport (GCTS) (Source www.wunderground.com).
3.2. ARIMAX Modeling
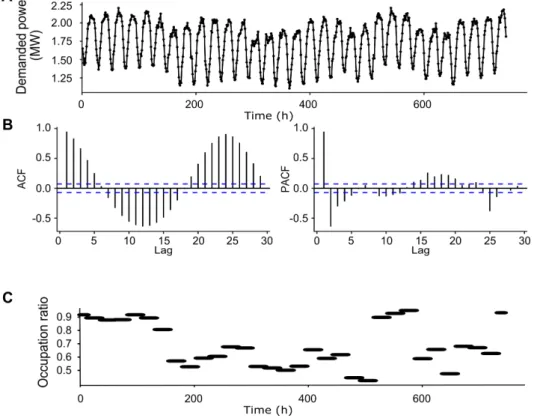
outside the significance limits, indicating that the correlations are significantly different from zero. If we eliminate this component of seasonality to 24 h, we would obtain the values that are not predictable and the ACF and the PACF would stay within the significance bounds. However, in the present work, we want to reproduce all the behavior of the total power demand in each hour using an ARIMAX model as reference model to compare the hybrid AI model developed in this research.
Figure 2.Demanded power by a hotel. (A) Demanded power by a hotel for 31 days. (B) Auto-Correlation Function and Partial Auto-Correlation Function of demanded power in (A); dashed blue lines indicate significance bounds. (C) Occupation ratio of the hotel during same period.
Theauto.arima()function in R software is used to find the parameters pandqfor the ARIMAX model [43]. Theauto.arima()function uses a variation of the Hyndman–Khandakar algorithm [44,45], which combines unit root tests, minimization of the Akaike Information Criteria (AIC) to obtain an ARIMAX model (ARIMAX(p,d,q)).
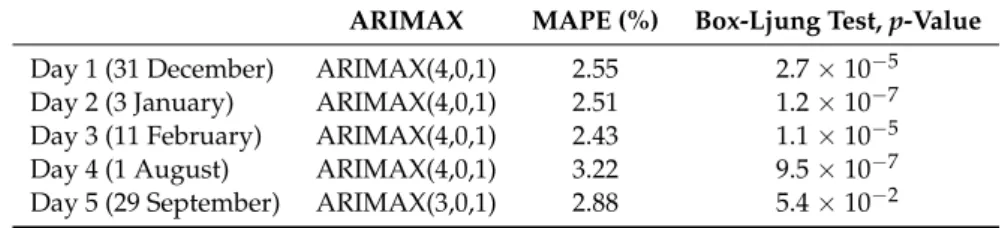
To forecast the demand power of our hotel for the next 24 h, the ARIMAX model is trained with the time series of the previous 31 days. To validate the models, we select five validation days taking into account two different reasons: random dates (3 January and 29 September), and special dates for tourists (11 February, 1 August, and 31 December). These special dates are New Year Eve, Carnival week, and holidays; the occupancy should be affected by these dates but we do not select the days based on occupancy change.
Finally, the Ljung-Box test statistic is computed over the training data to examine the null hypothesis of independence of the residuals (the null hypothesis of the Ljung–Box test is that the model does not show lack of fit). The statistic is based onnlagauto-correlation coefficients and the number
of degrees of freedom is fixed toh =1, ash = nlag−(p+q), thennlag = p+q+1. Thep-values
Table 1.Errors achieve by the ARIMAX models for training set, 31 days before the selected day.
ARIMAX MAPE (%) Box-Ljung Test,p-Value
Day 1 (31 December) ARIMAX(4,0,1) 2.55 2.7×10⁻⁵
Day 2 (3 January) ARIMAX(4,0,1) 2.51 1.2×10⁻⁷
Day 3 (11 February) ARIMAX(4,0,1) 2.43 1.1×10⁻⁵
Day 4 (1 August) ARIMAX(4,0,1) 3.22 9.5×10⁻⁷
Day 5 (29 September) ARIMAX(3,0,1) 2.88 5.4×10⁻²
3.3. Bagged Decision Trees Modeling
Regression and classification trees are a class of powerful algorithms for machine learning that allows for a high accuracy and are characterized by their clarity of information representation [46]. Basically, the basic mechanism of a decision tree consists of splitting a data set into smaller subsets according to specific features of the data. As a result, a set of decision-making rules are obtained that model the input data. While classification trees focus on classification of data into categories, regression trees focus on predicting numeric values.
Decision trees use a tree-like structure based on nodes and leaves to make predictions. The growth of this structure is done by evaluating features on the input data. Thus, three different types of nodes are distinguished:
• Root node: this node has no incoming edges and several (or zero) outgoing edges. • Internal node: characterized by one incoming edge and two or more outgoing edges. • Leaf: it has one incoming edge and no outgoing edges.
In general, the performance of a single decision tree is limited. That is why their structure is often improved by creating an ensemble of them and collecting their predictions. The main idea behind the ensemble model is that a group of individual learners join to form a more accurate learner.
One of the most efficient ensembles proposed for decision trees is based on Bootstrap Aggregation [47]. They are called bagged trees and are used with the aim of reducing the variance of a decision tree. The main idea behind bagged trees is to create several subsets of data of the same size extracted from the training sample. Common methods for this are disjoint partitions, small bags, no replication small bags, and disjoint bags. Each subset is used to train a decision tree. This process will generate an ensemble of different models. Finally, a global predictor with better performance is defined as the aggregation of the local predictors.
3.4. Hybrid Intelligent Modeling
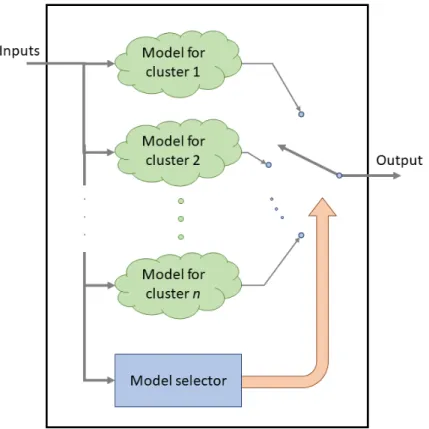
A Hybrid Intelligent model allows improvement of the global performance of a model. These types of models include a clustering and a regression phase; when the model was trained, the inputs are used to select a specific regression model to calculate the output. The internal structure of a hybrid model is shown in Figure3. The internal regression models for each cluster could be any type of regression algorithm. In this work ANN and Support Vector Machine for Regression were used.
3.4.1. K-Means Clustering Algorithm
The K-Means algorithm is a well-known unsupervised technique used to create groups of data [48,49]. The clusters contain data with similar characteristics among them. In our case, the algorithm is trained to minimize an error function based on the centroid Euclidean distance.
• Determine the cluster for each sample data based on the distance to the centroids. The cluster assigned should be the closest one to the sample.
• Calculate new centroids as the center of the clusters, taking into account all the samples per cluster.
When the cluster assigned to each sample and the centroids are the same, it means that the centroid calculation is finished. Then, the K-Means algorithm is ready to be used with new data. Once the final centroids are obtained, they can be used to assign new data to its cluster. This algorithm obtains the best results when the data are well distributed in hyperspace, and the cluster data has a hypersphere shape [49].
Figure 3.Internal layout for a hybrid model.
3.4.2. Multi-Layer Perceptron
The Multi-Layer Perceptron (MLP) is one of the most typical configurations of an ANN. It is a feedforward ANN with one input layer, one or more hidden layers, and one output layer [50–52]. Each layer has several neurons that depends on the number of inputs (in the case of input layer), the configuration of the MLP (for the hidden layers), and the number of outputs (for the output layer). All the neurons in a layer have the same inputs that would be the input data in the case of the first layer, and the output of the previous layer in other case. Each neuron input has a specific weight, and all of them are added before calculating the output of the activation function that would be the output of the neuron. There are some typical activation functions such as Tan-Sigmoid, Log-Sigmoid, Linear, Step, etc., each for a specific application. For regression, the usual ones are the Tan-Sigmoid for the neurons in all layers, except for the output layer that used to have a linear function. The Tan-Sigmoid activation function is shown in Equation (1).
F(t) = e
t−e−t
In the training phase, the weight for each internal signal is adjusted based on the desired output [53]. The output of the whole ANN is calculated based on Equation (2), where the adjusted parameters are in theθvariable.
Support Vector Machines (SVM) is a supervised machine-learning technique that is commonly used for classification problems. SVM can also be used for regression (SVR) by performing minor changes in the original algorithm used for classification problems. The Support Vector Regression is based on a nonlinear mapping to transform the data in a new high-dimensional space and, then, a linear regression is applied to calculate the desired output. In this work, a modification of SVR, called Least Squares SVR (LS-SVR), will be applied. LS-SVR uses the Least Squares to minimize the objective function [54–58].
In this case, a system of linear equations is solved with the aim of obtaining an approximation of the solution, which is not achieving the optimal solution that we would get with the original SVR algorithm. Nevertheless, this modification provides a comparable generalization performance as the SVR [59,60]. LS-SVR is the given name of the application of LS-SVM to regression [57,58].
A classical squared loss function is used instead of the insensitive loss function when the LS-SVR is applied. With this change, a linear KarushKuhn–Tucker is solved to build the Lagrangian (Equation (3)).
"
Tmeans transpose of a matrix or vector
γa weight vector
bregression vector b0is the model offset
The weight vector(γ)as well as the width of the kernel(σ)are the only variables needed in
LS-SVR [58].
4. An Intelligent Model for Power Demand
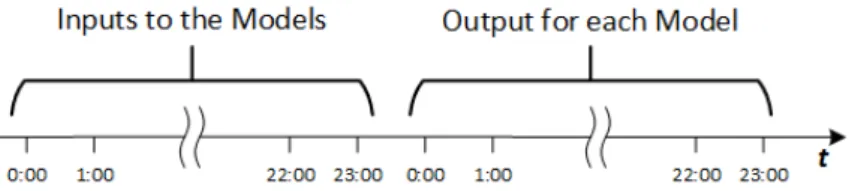
Figure 4.Input and output variables in time distribution.
Moreover, as shown in Figure5, the daily mean temperature and the occupation are used as inputs to improve the accuracy of the prediction. The prediction along the 24 h horizon is done by using 24 hybrid models like this. Each model will provide a prediction of one hour in the next day.
Figure 5.Hybrid model to predict the next day power.
As mentioned before, the model was trained with data of one year (electricity demand, occupancy, and mean daily temperature). The number of days used for training was 360. To validate the model, 5 days distributed along the whole year were used. The training procedure is divided in three phases:
1. Clustering training. This phase is the same for all the hybrid models, as they share the same inputs. 2. Regression training. For each cluster, two different regression algorithms (MLP and SVR) were
evaluated. In the case of ANN, different internal configurations were considered.
3. Performance calculation. As the number of clusters for each model is not a predefined, it is necessary to calculate the best cluster assignment based on the achieved error.
As shown in Figure3, each of the 24 submodels has a model selector to activate the local model according to the inputs. The model selector is based on the minimization of the Euclidean distance to each of the centroids of the clusters. In this way, the cluster with a lower distance to the input data is activated.
4.1. Clustering Training
Table 2.Number of samples per cluster in the model to predict the power at 15:00.
Cl-1 Cl-2 Cl-3 Cl-4 Cl-5 Cl-6 Cl-7
Global 354 Hybrid 2 147 207 Hybrid 3 91 91 172 Hybrid 4 52 65 97 140 Hybrid 5 40 43 65 87 119 Hybrid 6 36 43 59 60 76 80 Hybrid 7 21 39 47 57 60 61 69
4.2. Regression Training
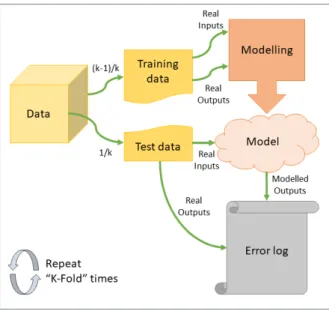
The training of the regression algorithm was made using K-Fold cross validation. Figure6shows the training phase generally. This step is repeated 16 times for each cluster; 15 different configurations of the MLP (with different neurons number in the hidden layer) and LS-SVR. The errors obtained after training each regression technique are stored and compared when all the algorithms are trained for a specific cluster. In this the way, the best algorithm per cluster is selected.
Figure 6.Cross validation using K-Fold.
The several MLP configurations are tested, all of them with Tan-Sigmoid activation function for the internal neurons (in the hidden layer); and, in the output layer, a Linear activation function is set. The difference in the configurations were the quantity of hidden layer neurons. This layer size varied from 1 to 15 neurons. To train each MLP configuration, the Levenberg–Marquardt algorithm was used. Moreover, to finish the training phase, gradient descent was used based on the error.
The auto-tuning functions implemented in the MATLAB toolbox by KULeuven-ESAT-SCD are used to train the LS-SVR algorithm. As this toolbox has the classification and the regression type for Support Vector Machines, it is necessary to set the type to @Function Estimation@. The model kernel was configured as Radial Basis Function (RBF) and the cost criteria is @leaveoneoutlssvm@.
Table 3.Best algorithm per cluster in the model to predict the power at 9:00.
Cl-1 Cl-2 Cl-3 Cl-4 Cl-5 Cl-6 Cl-7
Global LS-SVR
Hybrid 2 LS-SVR LS-SVR
Hybrid 3 MLP-11 LS-SVR LS-SVR
Hybrid 4 MLP-15 LS-SVR LS-SVR LS-SVR
Hybrid 5 LS-SVR LS-SVR LS-SVR LS-SVR LS-SVR
Hybrid 6 MLP-15 MLP-14 MLP-12 MLP-11 MLP-12 LS-SVR
Hybrid 7 LS-SVR MLP-14 LS-SVR MLP-13 MLP-13 MLP-11 LS-SVR
4.3. Hybrid Model Performance Calculation
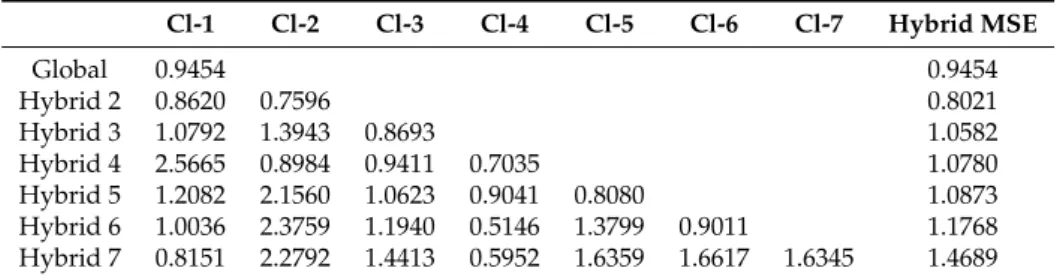
To calculate the best hybrid configuration in the models, the Mean Squared Error (MSE) was used as a measurement of the error in each cluster. This performance measure is used to select the best algorithm. To represent the error of a hybrid configuration, the MSE and the number of samples in each cluster were taken into account to calculate the pondered error. Table4shows an example of the resulting MSE for a specific model (for prediction of power at 18:00). In this table, the MSE for each cluster in the different hybrid configuration is shown. In this specific case, the best configuration is achieved with 2 clusters in the hybrid model.
Table 4.MSE per cluster in the model to predict the power at 18:00.
Cl-1 Cl-2 Cl-3 Cl-4 Cl-5 Cl-6 Cl-7 Hybrid MSE
Global 0.9454 0.9454
Hybrid 2 0.8620 0.7596 0.8021
Hybrid 3 1.0792 1.3943 0.8693 1.0582
Hybrid 4 2.5665 0.8984 0.9411 0.7035 1.0780
Hybrid 5 1.2082 2.1560 1.0623 0.9041 0.8080 1.0873 Hybrid 6 1.0036 2.3759 1.1940 0.5146 1.3799 0.9011 1.1768 Hybrid 7 0.8151 2.2792 1.4413 0.5952 1.6359 1.6617 1.6345 1.4689
5. Results and Discussion
A hybrid intelligent model was obtained using the data of a luxury hotel. The model has three inputs: the energy demand in the previous 24 h, the mean temperature of the previous day and the occupancy rate of the hotel. The model will provide hourly energy demand for the next 24 h. The training of the model was done using data from 360 days and the remaining days (5) were for validation purposes. These days were chosen to be distributed along the year: 31 December, 3 January, 11 August, and 29 September.
The model is divided in 24 submodels, each one predicting the load in a specific hour of the next day. The setup of the 24 internal models used regression models based on LS-SVR or ANN. The ANN are MLP with one hidden layer of neurons and Tan-Sigmoid as the activation function. In the output layer, as the MLP is used for regression, the linear activation function is selected. The MLP training algorithm used was Levenberg–Marquardt. Up to 15 different configurations were considered for the ANN and LS-SVR. As commented, K-Fold cross validation was used to train the model. This procedure was repeated 16 times for each cluster.
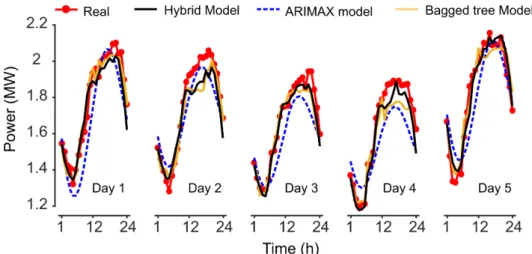
model overperforms clearly the ARIMAX proposal and performs better than the bagged decision tree method.
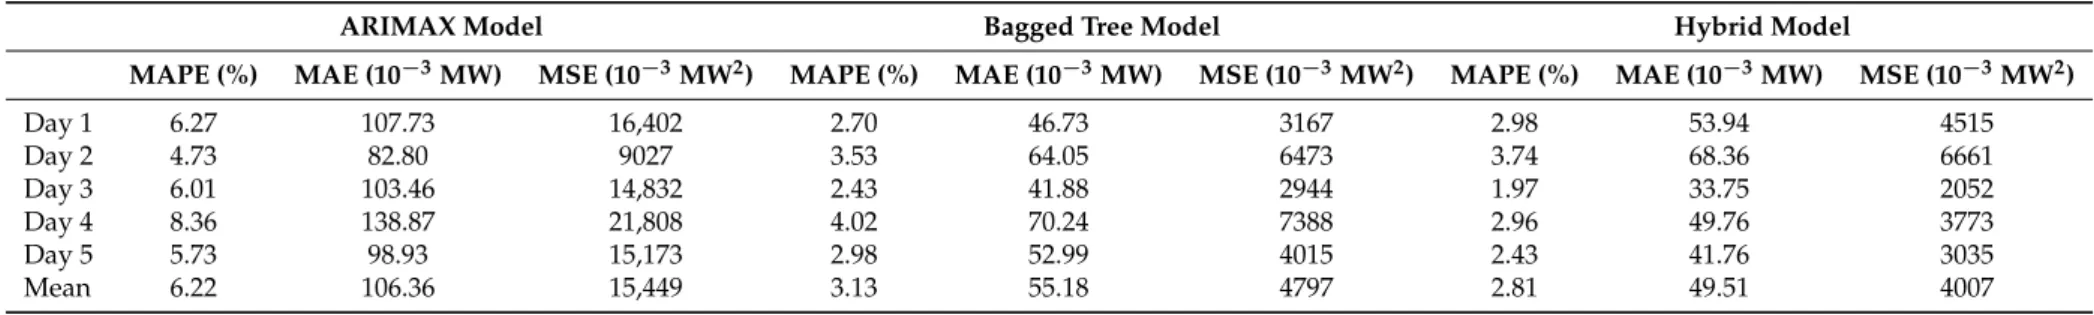
In Table5a detailed performance evaluation is done. The accuracy of the model was assessed by evaluating the Mean Absolute Percentage Error (MAPE), the Mean Absolute Error (MAE), the MSE, and the Maximum Error (Max.). As can be seen, all the error indexes are better for the hybrid model. Thus, the average of MAE of the five-day data set is around 49.51×10⁻³MW for hybrid model compared to 106.36×10⁻³for the ARIMAX model and 55.18×10⁻³for the bagged tree method.
Considering that the power base is the contracted power of the hotel (1.84 MW), the normalized averaged MAE is 0.0141 (2.69%). This means the intelligent model proposed can predict the power load for the next 24 hours with an accuracy close to 97.31%. This value is higher than the accuracy obtained for the ARIMAX and for the bagged decision tree method. With the ARIMAX model the normalized average MAE is 5.78% with an accuracy of around 94.22% which is clearly lower than the results of the hybrid model. For the bagged tree algorithm, the resulting normalized average MAE is 3.00% with an accuracy of 97.00%. As observed, the proposed method involves an improvement compared to the other methods in the overall performance of the predictor.
It is important to observe that the ARIMAX model is obtained for each prediction day using information from the previous 31 days. In this sense, the ARIMAX can have some adaptation according to the previous variations of the data. This implies that the real implementation of this method involves some online computational effort to obtain the model. In most cases this fact will not be relevant, but for some embedded applications with low cost equipment, it is necessary to take it into consideration. On the other hand, the hybrid intelligent model proposed is an explicit model that is completely obtained offline using data from the whole year. In this sense, the online computational load and storage is reduced.
Table 5.Errors achieve by the models. (Mean Absolute Percentage Error (MAPE), the Mean Absolute Error (MAE), the Mean Square Error (MSE), and the Maximum Error (Max.)).
ARIMAX Model Bagged Tree Model Hybrid Model
MAPE (%) MAE (10−3MW) MSE (10−3MW2) MAPE (%) MAE (10−3MW) MSE (10−3MW2) MAPE (%) MAE (10−3MW) MSE (10−3MW2)
Day 1 6.27 107.73 16,402 2.70 46.73 3167 2.98 53.94 4515
Day 2 4.73 82.80 9027 3.53 64.05 6473 3.74 68.36 6661
Day 3 6.01 103.46 14,832 2.43 41.88 2944 1.97 33.75 2052
Day 4 8.36 138.87 21,808 4.02 70.24 7388 2.96 49.76 3773
Day 5 5.73 98.93 15,173 2.98 52.99 4015 2.43 41.76 3035
6. Conclusions
This work proposes an intelligent hybrid model to predict the short-term energy demand in a hotel. The model predicts the power load of the hotel for each hour in a 24-h horizon. The model uses information from the previous energy demand of the hotel, the mean temperature of the previous day, and the occupancy rate of the resort.
The solution proposes an overall model decomposed in 24 submodels, each one predicting the energy demand for each hour of the next day. Its structure is based on AI techniques. Three main techniques were used: clustering, to define the local models, and MLP and LS-SVR, to implement the model corresponding to the clusters.
The results obtained show that the proposed model was able to satisfactorily predict the energy load for the next 24 h. A comparison with the real curve results in a mean absolute error of 0.04951 MW. This error must be evaluated, taking into account the high overall power demand. The value of the mean absolute error percentage normalized by 1.84 MW (contracted power of the hotel) is 2.69% which attests to the accuracy of the proposed model. The results were compared with a conventional forecast technique based on ARIMAX modeling and an advanced method based on bagged decision trees. The hybrid model obtained better results than those obtained by the ARIMAX model and bagged tree models (5.78% and 3.00% mean absolute error, respectively) and averaged maximum error normalized, respectively)).
The proposed model appears to be a potential tool to improve the prediction of power demand in hotels. Energy management in the hotel where the study took place is based on a prediction model that uses linear correlation by least squares. In this model, the consumption (energy daily prediction, EDP) is directly proportional to the Cooling Degree Days (CDD), calculated by BizEE Software Limited, and occupancy. Thus, the new proposal presented offers a great potential to improve the accuracy of the existing prediction method in the hotel. The availability of these predictions plays an important role in increasing the efficiency of energy management systems with the aim of reducing the energy costs and guaranteeing environmental sustainability.
Author Contributions:J.-L.C.-R., J.F.G.-G., J.L.C.-R., E.J., H.Q., B.G.D. and J.A.M.P. conceived the study. J.-L.C.-R., J.L.C.-R. and J.A.M.P. programmed the required algorithms. J.F.G.-G. and B.G.D. interpreted the results and drafted the manuscript. E.J., H.Q. and J.-L.C.-R. supervised the experimental data analysis; they also contributed to the critical revision and improvement of the paper. All of the authors have approved the final version of the manuscript.
Funding:This research was funded by CajaCanarias Foundation with the grant number PR705752 (GreenTourist, 2016TUR17).
Conflicts of Interest:The authors declare that there is no conflict of interest regarding the publication of this paper.
References
1. Pieri, S.P.; Tzouvadakis, I.; Santamouris, M. Identifying energy consumption patterns in the Attica hotel sector using cluster analysis techniques with the aim of reducing hotels’ CO2footprint.Energy Build.2015,
94, 252–262. [CrossRef]
2. Dalton, G.J.; Lockington, D.A.; Baldock, T.E. Feasibility analysis of renewable energy supply options for a grid-connected large hotel. Renew. Energy2009,34, 955–964. [CrossRef]
3. Deng, S.M.; Burnett, J. Study of energy performance of hotel buildings in Hong Kong.Energy Build.2000, 31, 7–12. [CrossRef]
4. Papamarcou, M.; Kalogirou, S. Financial appraisal of a combined heat and power system for a hotel in Cyprus. Energy Convers. Manag.2001,42, 689–708. [CrossRef]
5. Priyadarsini, R.; Xuchao, W.; Eang, L.S. A study on energy performance of hotel buildings in Singapore. Energy Build.2009,41, 1319–1324. [CrossRef]
7. Hilton Worldwide. Energy. 2018. Available online: http://cr.hiltonworldwide.com/download/ Hilton{_}CRReport{_}Energy.pdf(accessed on 1 September 2018).
8. Atique, S.; Noureen, S.; Roy, V.; Subburaj, V.; Bayne, S.; Macfie, J. Forecasting of total daily solar energy generation using ARIMA: A case study. In Proceedings of the 2019 IEEE 9th Annual Computing and Communication Workshop and Conference (CCWC), Las Vegas, NV, USA, 7–9 January 2019; pp. 114–119. [CrossRef]
9. Mat Daut, M.A.; Hassan, M.Y.; Abdullah, H.; Rahman, H.A.; Abdullah, M.P.; Hussin, F. Building electrical energy consumption forecasting analysis using conventional and artificial intelligence methods: A review. Renew. Sustain. Energy Rev.2017,70, 1108–1118. [CrossRef]
10. Nguyen, H.; Hansen, C.K. Short-term electricity load forecasting with Time Series Analysis. In Proceedings of the 2017 IEEE International Conference on Prognostics and Health Management (ICPHM), Dallas, TX, USA, 19–21 June 2017; pp. 214–221. [CrossRef]
11. Suganthi, L.; Samuel, A.A. Energy models for demand forecasting: A review. Renew. Sustain. Energy Rev.
2012,16, 1223–1240. [CrossRef]
12. Singh, A.K.; Khatoon, S. An Overview of Electricity Demand Forecasting Techniques. Netw. Complex Syst.
2013,3, 38–48.
13. Shao, Z.; Chao, F.; Yang, S.L.; Zhou, K.L. A review of the decomposition methodology for extracting and identifying the fluctuation characteristics in electricity demand forecasting.Renew. Sustain. Energy Rev.2017, 75, 123–136. [CrossRef]
14. Khosravani, H.; Castilla, M.; Berenguel, M.; Ruano, A.; Ferreira, P. A Comparison of Energy Consumption Prediction Models Based on Neural Networks of a Bioclimatic Building.Energies2016,9, 57. [CrossRef] 15. Torres, J.M.; Aguilar, R.; Aguilar, R.M.; Zúñiga, K.V. Deep Learning to Predict the Generation of a Wind
Farm.J. Renew. Sustain. Energy2018,10, 013305. [CrossRef]
16. Jove, E.; Gonzalez-Cava, J.M.; Casteleiro-Roca, J.L.; Pérez, J.A.M.; Calvo-Rolle, J.L.; de Cos Juez, F.J. An intelligent model to predict ANI in patients undergoing general anesthesia. In Proceedings of the International Joint Conference SOCO’17-CISIS’17-ICEUTE’17, León, Spain, 6–8 September 2017; pp. 492–501. 17. Jove, E.; Gonzalez-Cava, J.M.; Casteleiro-Roca, J.L.; Méndez-Pérez, J.A.; Antonio Reboso-Morales, J.; Javier Pérez-Castelo, F.; Javier de Cos Juez, F.; Luis Calvo-Rolle, J. Modelling the hypnotic patient response in general anaesthesia using intelligent models. Log. J. IGPL2018,27, 189–201. [CrossRef]
18. Casteleiro-Roca, J.L.; Jove, E.; Gonzalez-Cava, J.M.; Pérez, J.A.M.; Calvo-Rolle, J.L.; Alvarez, F.B. Hybrid model for the ANI index prediction using Remifentanil drug and EMG signal. InNeural Computing and Applications; Springer: Berlin/Heidelberg, Germany, 2018; pp. 1–10.
19. Jove, E.; Casteleiro-Roca, J.L.; Quintián, H.; Méndez-Pérez, J.A.; Calvo-Rolle, J.L. A fault detection system based on unsupervised techniques for industrial control loops. InExpert Systems; John Wiley & Sons, Ltd.: Hoboken, NJ, USA, 2019; p. e12395.
20. Neto, A.H.; Fiorelli, F.A.S. Comparison between detailed model simulation and artificial neural network for forecasting building energy consumption.Energy Build.2008,40, 2169–2176. [CrossRef]
21. Muralitharan, K.; Sakthivel, R.; Vishnuvarthan, R. Neural network based optimization approach for energy demand prediction in smart grid. Neurocomputing2018,273, 199–208. [CrossRef]
22. Zúñiga, K.V.; Castilla, I.; Aguilar, R.M. Using fuzzy logic to model the behavior of residential electrical utility customers. Appl. Energy2014,115, 384–393. [CrossRef]
23. Abreu, T.; Alves, U.N.; Minussi, C.R.; Lotufo, A.D.P.; Lopes, M.L.M. Residential electric load curve profile based on fuzzy systems. In Proceedings of the 2015 IEEE PES Innovative Smart Grid Technologies Latin America (ISGT LATAM), Montevideo, Uruguay, 5–7 October 2015; pp. 591–596. [CrossRef]
24. Bedi, J.; Toshniwal, D. Deep learning framework to forecast electricity demand. Appl. Energy2019,238, 1312–1326. [CrossRef]
25. Wasseem Ahmad, M.; Mourad, A.; Rezgui, Y.; Mourshed, M. Deep Highway Networks and Tree-Based Building Energy Consumption. Energies2019,11, 3408. [CrossRef]
26. Chen, Y.; Tan, H. Short-term prediction of electric demand in building sector via hybrid support vector regression. Appl. Energy2017,204, 1363–1374. [CrossRef]
28. Jove, E.; Blanco-Rodríguez, P.; Casteleiro-Roca, J.L.; Moreno-Arboleda, J.; López-Vázquez, J.A.; de Cos Juez, F.J.; Calvo-Rolle, J.L. Attempts prediction by missing data imputation in engineering degree. In Proceedings of the International Joint Conference SOCO’17-CISIS’17-ICEUTE’17, León, Spain, 6–8 September 2017; Springer: Cham, Switerland, 2017; pp. 167–176.
29. Gonzalez-Cava, J.M.; Reboso, J.A.; Casteleiro-Roca, J.L.; Calvo-Rolle, J.L.; Méndez Pérez, J.A. A novel fuzzy algorithm to introduce new variables in the drug supply decision-making process in medicine. Complexity
2018,2018, 9012720. [CrossRef]
30. Casteleiro-Roca, J.L.; Barragán, A.J.; Segura, F.; Calvo-Rolle, J.L.; Andújar, J.M. Fuel Cell Output Current Prediction with a Hybrid Intelligent System. Complexity2019,2019, 6317270. [CrossRef]
31. Casteleiro-Roca, J.L.; Perez, J.A.M.; Piñón-Pazos, A.J.; Calvo-Rolle, J.L.; Corchado, E. Intelligent Model for Electromyogram (EMG) Signal Prediction During Anesthesia. J. Mult. Valued Log. Soft Comput.2019,32, 205–220.
32. Olatomiwa, L.; Mekhilef, S.; Ismail, M.; Moghavvemi, M. Energy management strategies in hybrid renewable energy systems: A review. Renew. Sustain. Energy Rev.2016,62, 821–835. [CrossRef]
33. Comodi, G.; Renzi, M.; Cioccolanti, L.; Caresana, F.; Pelagalli, L. Hybrid system with micro gas turbine and PV (photovoltaic) plant: Guidelines for sizing and management strategies. Energy2015,89, 226–235. [CrossRef]
34. Serale, G.; Fiorentini, M.; Capozzoli, A.; Bernardini, D.; Bemporad, A. Model Predictive Control (MPC) for Enhancing Building and HVAC System Energy Efficiency: Problem Formulation, Applications and Opportunities. Energies2018,11, 631. [CrossRef]
35. Jo, H.; Yoon, Y. Intelligent smart home energy efficiency model using artificial TensorFlow engine. Hum.-Centric Comput. Inf. Sci.2018,8, 9. [CrossRef]
36. Ruban, A.A.M.; Rajasekaran, G.M.; Pasupathi, T.; Rajeswari, N. A fuzzy-logic based management system in smart-microgrid for residential applications. In Proceedings of the 2016 International Conference on Emerging Trends in Engineering, Technology and Science (ICETETS), Pudukkottai, India, 24–26 February 2016; pp. 1–7. [CrossRef]
37. Mardani, A.; Zavadskas, E.; Streimikiene, D.; Jusoh, A.; Nor, K.; Khoshnoudi, M. Using fuzzy multiple criteria decision making approaches for evaluating energy saving technologies and solutions in five star hotels: A new hierarchical framework. Energy2016,117, 131–148. [CrossRef]
38. Acosta, A.; González, A.; Zamarreño, J.; Álvarez, V. Energy savings and guaranteed thermal comfort in hotel rooms through nonlinear model predictive controllers.Energy Build.2016,129, 59–68. [CrossRef]
39. Vega Lara, B.; Castellanos Molina, L.; Monteagudo Yanes, J.; Rodríguez Borroto, M. Offset-free model predictive control for an energy efficient tropical island hotel.Energy Build.2016,119, 283–292. [CrossRef] 40. Riverón, I.; Gómez, J.F.; González, B.; Méndez, J.A. An intelligent strategy for hybrid energy system
management. Renew. Energy Power Qual. J.2019,17, 5.
41. EXCELTUR. EXCELTUR, Alliance for Excellency in Tourism. 2017. Available online:http://www.exceltur. org/exceltur-in-english/(accessed on 1 September 2018).
42. Fuller, W.A.Introduction to Statistical Time Series; Wiley: Hoboken, NJ, USA, 1996; p. 698.
43. Hyndman, R. Auto.Arima Function from Forescast v8.6 | R Documentation. Available online: https: //otexts.com/fpp2/arima-r.html(accessed on 5 May 2019).
44. Hyndman, R.J.; Khandakar, Y. Automatic Time Series Forecasting: The forecast Package for R.J. Stat. Softw.
2008,27, 1–22. [CrossRef]
45. Wang, X.; Smith, K.; Hyndman, R. Characteristic-Based Clustering for Time Series Data. Data Min. Knowl. Discov.2006,13, 335–364. [CrossRef]
46. Wei-Yin, L. Classification and regression trees.Wiley Interdiscip. Rev. Data Min. Knowl. Discov.2011,1, 1–17. [CrossRef]
47. Breiman, L.Bagging Predictors: Technical Report No. 421; Department of Statistics University of California: Berkeley, CA, USA, 1994; p. 19.
48. Qin, A.; Suganthan, P. Enhanced neural gas network for prototype-based clustering. Pattern Recogn.2005, 38, 1275–1288. [CrossRef]
51. Zeng, Z.; Wang, J. Advances in Neural Network Research and Applications; Springer: Berlin/Heidelberg, Germany, 2010.
52. Osborn, J.; Guzman, D.; de Cos Juez, F.J.; Basden, A.G.; Morris, T.J.; Gendron, E.; Butterley, T.; Myers, R.M.; Guesalaga, A.; Sanchez Lasheras, F.; et al. Open-loop tomography with artificial neural networks on CANARY: on-sky results. Mon. Not. R. Astron. Soc.2014,441, 2508–2514. [CrossRef]
53. Rynkiewicz, J. General bound of overfitting for MLP regression models. Neurocomputing2012,90, 106–110. [CrossRef]
54. Cristianini, N.; Shawe-Taylor, J.An Introduction to Support Vector Machines and Other kernel-Based Learning Methods; Cambridge University Press: New York, NY, USA, 2000.
55. Vilán Vilán, J.A.; Alonso Fernández, J.R.; García Nieto, P.J.; Sánchez Lasheras, F.; de Cos Juez, F.J.; Díaz Muñiz, C. Support Vector Machines and Multilayer Perceptron Networks Used to Evaluate the Cyanotoxins Presence from Experimental Cyanobacteria Concentrations in the Trasona Reservoir (Northern Spain). Water Resour. Manag.2013,27, 3457–3476. [CrossRef]
56. Wang, R.; Wang, A.; Song, Q. Research on the alkalinity of sintering process based on LS-SVM Algorithms. InAdvances in Computer Science and Information Engineering; Springer, Berlin/Heidelberg, Germany, 2012; pp. 449–454. [CrossRef]
57. Guo, Y.; Li, X.; Bai, G.; Ma, J. Time Series Prediction Method Based on LS-SVR with Modified Gaussian RBF. In Proceedings of the International Conference on Neural Information Processing, Lake Tahoe, NV, USA, 3–6 December 2012; pp. 9–17. [CrossRef]
58. Wang, L.; Wu, J. Neural network ensemble model using PPR and LS-SVR for stock et eorecasting. InInternational Conference on Intelligent Computing; Springer: Berlin/Heidelberg, Germany, 2012; pp. 1–8, doi:10.1007/978-3-642-24728-6_1.
59. Steinwart, I.; Christmann, A.Support Vector Machines; Springer: Berlin/Heidelberg, Germany, 2008. 60. Vapnik, V.The Nature of Statistical Learning Theory; Springer: Berlin/Heidelberg, Germany, 1995.
c