TítuloAsphalt mixtures with construction and demolition debris
25
0
0
Texto completo
(2) Asphalt mixtures made with construction and demolition debris I. Pérez, J. Gallego, M. Toledano, J. Taibo Abstract This paper reports on research into the technical viability of the use of construction and demolition debris in hot mix asphalt. A semi-dense and a coarse asphalt mixture were studied, both containing 50% recycled aggregate from construction and demolition debris. Two control mixtures were also studied, similar in grading but not containing recycled aggregates. It was proven that the mixtures containing recycled aggregates were more open graded and had considerable potential for stripping, a characteristic that can be related to the high water absorption level of the mortar adhered to the recycled aggregates. It was also proven that the dynamic modulus is higher in the mixtures made with recycled aggregates, particularly in the semi-dense asphalts. Whereas a deterioration of the fatigue law was observed in the semi-dense mixtures, this property did not appear to worsen in the coarse mixtures. This meant it was possible to design structural sections for flexible pavements bearing medium or low volumes of traffic with a service life comparable to that of conventional materials. Nevertheless, further research is required as, for the time being, the lack of resistance to water action casts doubt on the use of asphalt mixtures incorporating these types of recycled aggregate. 1. INTRODUCTION Spain produces 13 million tons of construction and demolition debris (C&D debris) annually, less than 5% of which are reused or recycled, while the European Union recycles or reuses an average total of 28% of the C&D debris it generates1. Most of these waste materials are hauled off to landfills, causing a negative environmental impact. In view of this, in 2001 the Spanish National Construction and Demolition Debris Plan2 was passed, with one of its main objectives being to recycle 60% of the C&D debris in the year 2006. To date, this goal has not yet been achieved. Additionally, given that highways consume huge amounts of aggregates, from an environmental standpoint it would be of interest to consider the use of C&D debris materials in road paving construction. Although more information is available on the their use as unbound granular materials without any kind of treatment 3,4 and as materials treated with hydraulic conglomerates5, a 2.
(3) limited number of technical experiments6,7,8 have been carried out recently that deal with the use of this type of debris in hot mix asphalt (HMA). In this sense, Shen and Du6 evaluated the performance of HMA made with several proportions of recycled aggregates from C&D debris from Taiwan substituting river-crushed stones. They analyzed the permanent deformation features of the mixtures by means of the wheel tracking device. The tests were performed using a wheel load at temperatures of 25 ºC and 60 ºC for dry condition. After analysing the results, they concluded that, in general, from the standpoint of permanent deformation, the HMA containing recycled aggregates exhibited a more satisfactory behaviour than mixtures made with only river-crushed stones. Paranavithana & Mohajerani7 analysed the properties of HMA containing recycled concrete aggregates as coarse aggregates and fresh-crushed basalt aggregates as fine aggregates. They performed several resilient modulus and permanent deformation tests according to the Australian standards. The HMA with recycled aggregates presented stiffness and permanent deformation results comparable to those of conventional mixtures. Furthermore, when they performed the immersion-compression test, a loss of compressive strength equal to 34% in mixtures with recycled aggregates was observed. According to them, this poor behaviour was due to the high water absorption and the easy separation of the mortar adhered to the recycled aggregates. Very recently, Wong, Sun & Lai8 investigated the feasibility of partial substitution of fine granite aggregates in HMA with fine recycled concrete aggregates. They performed the same Australian tests used by Paranavithana & Mohajerani.. Contrary to the preceding case, the stiffness and rutting behaviour of mixtures. containing recycled aggregates achieved better performance than conventional granite mixtures. However, no test of any kind was carried out to evaluate stripping. The three research studies mentioned above did not perform tests to determine fatigue strength. In view of the above, the aim of this research work has been to evaluate the technical feasibility of using these recycled aggregates from C&D debris in the production of HMA, taking as reference the requirements stipulated in the specifications for highway pavements in Spain9. This research included determination of the strength retained post immersion and the fatigue strength and modulus of the mixtures under study. In addition, a life span analysis of two structural sections 3.
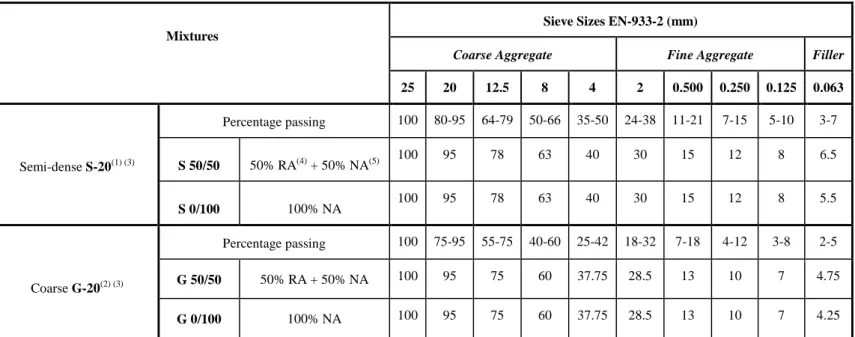
(4) including HMA with/without recycled aggregates was carried out using a linear, elastic multi-layer model. The results of the research revealed that the incorporation of C&D debris in HMA reduces the retained strength of the mixture post immersion. On the other hand, the higher modulus of the mixtures containing recycled aggregates as well as their acceptable fatigue law provide the structural pavement sections studied with a longer predicted service life. As a result, the priority for new research work is to address the loss of strength post immersion. 2. CHARACTERISATION OF THE BASIC MATERIALS AND MECHANICAL TESTS The mixtures were made up according to the Spanish General Technical Specifications for Road and Bridge Construction, also known as PG-310. A G-20 coarse HMA was chosen as the base course material, while an S-20 semi-dense HMA was selected for the binder course. Table 1 shows the grading envelopes specified in the Spanish PG-3 for these HMAs, as also the grading curves selected. Hereafter the letters S or G will be used to designate the grading curves S-20 or G-20 selected for this research work, followed by the proportion of recycled/natural aggregates RA/NA involved. For example, Mixture G 50/50 has a grading curve of G-20 made up of 50% recycled aggregates (RA) plus 50% natural aggregates (NA). 2.1. Characterisation of the basic materials The basic materials were characterised in accordance with the Spanish technical standards NLT11 (Tests for Roads Materials) from the Spanish Road Study Centre and the UNE-EN12 standards from the Spanish Association for Standardisation and Certification (AENOR). The UNE-EN specifications are the Spanish version of the EN European standards. Table 2 presents the results of the tests on the materials under study. Crushed natural aggregates (NA) These natural aggregates were supplied by a quarry in fractions of 0/6, 6/12 and 12/25 mm. The rock is composed of quartz (35%), sodium feldspar (30%), colourless or muscovite mica (20%) and chlorite (15%). The density in paraffin oil is 2.69 g/cm3 (Table 2). The aggregates for the HMA with 100% NA comply with the PG-3 specifications: all the coarse aggregate particles are fractured; the flakiness index in all the coarse aggregate fractions tested was less than 20%; the 4.
(5) Los Angeles fragmentation coefficient was in one case 19.4% and in the other, 22.1%. The sand equivalent was greater than 50%. Recycled aggregates (RA) The recycling of materials from C&D debris for use as a recycled aggregate to be incorporated into HMA entailed the following process: a selection of the appropriate materials at source, crushing at the C&D debris plant, the removal of pollutants, sieving and classification of the aggregates and washing. In this sense, the RA production plant is very similar to an NA crushing plant, involving crushers, sieves, conveyor mechanisms, equipment for pollutant removal and electromagnets to separate the steel. Moreover, the C&D debris plant produces an 0/40-mm fraction with the following composition in weight: concrete (72%); stone (20%); ceramic (2%) and asphalt mixture (6%). The gradations were characterised as pertaining to Mixtures S 0/100, S 50/50 and G 0/100, G 50/50. Table 2 shows that all of the particles are fractured and that the values of the flakiness index and sand equivalent meet the requirements stipulated in the Spanish specifications. In terms of the Los Angeles fragmentation coefficient, Mixtures S 50/50 and G 50/50 were around the maximum 25% Spanish requirement. Moreover, the water absorption coefficient of the RA was much higher than that of the NA. The density of the aggregates in paraffin oil for Mixtures S 0/100 and G 0/100 was 2.69 g/cm3 while Mixtures S 50/50 and G 50/50 exhibited an aggregate density of 2.66 g/cm3. The filler used in both types of mixtures came from the process of crushing natural aggregate so that the mastic from the mixtures elaborated with/without RA would behave in a similar manner. Bitumen The bitumen used had a penetration of 60/70 and a softening point with the ring and ball method equal to 48.5 ºC. Peiffer’s penetration index was equal to -0.8 and the density was 1.03 g/cm3 (Table 2). It was confirmed that the bitumen complied with all the Spanish specifications. 2.2. Mechanical tests Marshall. 5.
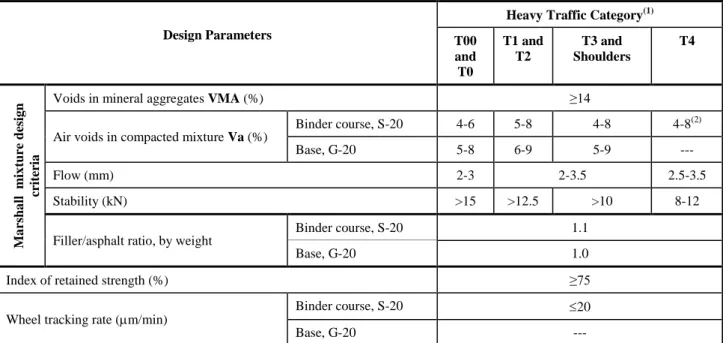
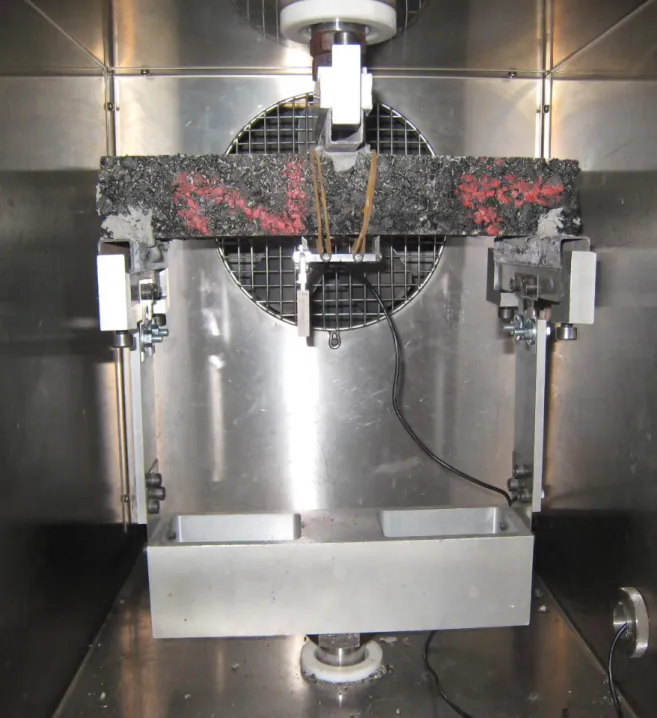
(6) This test was performed according to the Spanish NLT-159 standard13 (a test method for evaluating the resistance to plastic flow of asphalt mixtures using Marshall apparatus).. Four series of. cylindrical samples compacted with 75 blows per side were made with different bitumen percentages. The average value of the following parameters was calculated for each percentage of bitumen: air voids in compacted mixture Va (%), voids in mineral aggregate, VMA (%), unit weight (g/cm3), flow value (mm) and stability (kN). The specimens produced for the rest of the mechanical tests were elaborated with the optimum bitumen content selected in the Marshall test. The Marshall requirements that must be met by the HMA in the Spanish PG-3 are summarised in Table 3. Immersion-compression This test was performed according to the Spanish NLT-162 standard14 (a test method for assessing the effect of water on the compressive strength of compacted bituminous mixtures). Ten cylindrical specimens with the following dimensions were made: 101.6 mm in diameter and 101.6 mm in height. Five specimens were immersed in water at a temperature of 60 ºC for 24 hours and the other five were kept at room temperature without being submerged in water. They were later subjected to unconfined compression and the average value of the strength in each group was determined. The index of retained strength (%) was calculated by dividing the compressive strength of the group immersed in water at 60 ºC by the compressive strength of the group that was not submerged. According to PG-3, this index must be higher than 75% in HMA (Table 3). Wheel tracking This test was performed according to the Spanish NLT-173 standard15 (a test method to determine wheel tracking rate). Three prismatic specimens were made with the following dimensions: 300 x 300 x 50 mm. Each specimen was placed inside a climatic chamber at a temperature of 60 ºC and subjected over 120 minutes to the alternating passage of a wheel applying a pressure of 0.9 MPa (Fig. 1) for dry condition to the surface of the specimen. In each specimen, the rut depth was periodically measured. The average deformation value of the three specimens was plotted in a deformation versus time graph. The wheel tracking rate was calculated as the average deformation velocity of the three specimens at the interval between 105 and 120 minutes from the start. This 6.
(7) rate is expressed in m/min. In Spain, the wheel tracking test is only mandatory for wearing or binder courses (Table 3) but not for base courses. Bending fatigue This test was performed according to the Spanish NLT-350 standard16 (method for fatigue strength in a three-point flexural test). Ten prismatic beams measuring 300 x 50 x 50 mm were produced and tested under dynamic flexotraction (Fig. 2) by means of servo-hydraulic apparatus. This Spanish method establishes a constant strain-controlled mode of loading at a frequency of 10 Hz. The load applied is measured in every cycle. The number of cycles (N) to failure corresponds to the cycle with a load that is half of the load registered in cycle 200.. During the test, the. deformation values are measured by means of a dynamic extensometer placed on the bottom side of the beam (Fig. 2). On the basis of ten specimens tested at 20 ºC, it is possible to determine the ε-N fatigue law and the dynamic modulus. The fatigue law relates the number of load cycles to failure (N) to the horizontal tensile strain () produced in the centre of the bottom side of the beam:. k NB. (1). where k and B are constants to be determined in each mixture tested. The same test serves to determine the dynamic modulus (DM), which is a measurement of the stiffness of the mixture. It is calculated as the quotient between the cyclical amplitude of the stress function (Tc) and the cyclical amplitude of the tensile strain function (εc) in Cycle 200. It is expressed as follows:. DM . Tc. c. (2). 3. RESULTS 3.1. Marshall test The results initially obtained with the Marshall method showed that it was not feasible to use 100% recycled aggregate in the mixtures. It was therefore decided to use just 50% RA in each size (with the exception of the filler, from fresh stone). In mixtures incorporating 100% NA, an intermediate filler content was used whereas in mixtures incorporating RA, the content of filler was increased until it came close to the maximum limit of the grading envelope in order to correct the higher level of air voids observed during the initial trials. 7.
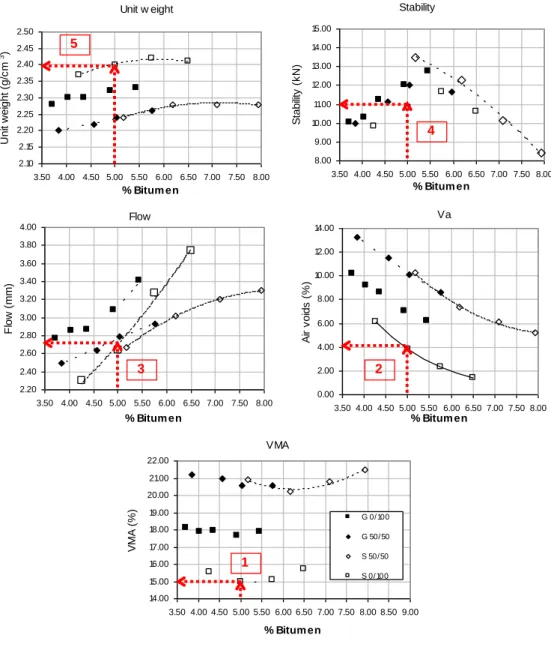
(8) The optimum percentages of bitumen in Mixtures S 0/100, S 50/50, G 0/100 and G 50/50 were obtained according to the modus operandi established in Spain. This is a formal procedure sanctioned by experience. According to this, the optimum percentage of bitumen for a mixture (Table 3) depends on the volume of heavy vehicles involved and the type of pavement layer where the mixture is to be laid. By way of example, the design procedure is explained for Mixture S 0/100 (Fig. 3) to accomplish the Marshall criteria for T3 traffic (200>AADTHT >50) and for shoulders of any road: 1. according to Table 3, the voids in mineral aggregates must be higher than 14% (Traffic T3 and shoulders) - any binder content between 4.25 and 6.5% meets this requirement; 2. the content of air voids for binder course, Traffic T3 and shoulders, must be in the range of 4 to 8% - according to the curve of air voids (Fig. 3), this voids content can be achieved by using binder contents of 5% or less; 3. the flow value must be between 2 and 3.5 mm for Traffic T3 and shoulders - as shown in the flow curve in Figure 3, any value of binder content between 4.25 and 6.0% allows the flow value to meet the 2-3.5 mm specification; 4. according to Table 3, the stability must be higher than 10 kN, so any content of binder between 4.25 and 6.50 (Fig. 3) meets the stability specification; 5. a filler/binder ratio of 1.1 is recommended and of 1.0 for binder courses and base courses, respectively. Since Mixture S 0/100 is to be laid in a binder course, the filler/binder ratio is 1.1. It has a filler content of 5.5 (see Table 1) and the recommended binder content is 5.5/1.1 = 5.0 percent. Since this percentage of binder complies with Items 1 to 4 above, the optimum binder content is fixed at 5.0% by weight of dry aggregates. The unit weight corresponding to a 5.0% binder is approximately equal to 2.4 g/cm3. Note that the “percentage of binder-filled voids” criterion is not included in the Spanish Specifications. The same procedure was also used to design the other three mixtures. For Mixture S 50/50, the optimum percentage of asphalt binder was equal to 5.90, for compliance with all the specifications for T1 traffic (2000>AADTHT >800). Mixture G 50/50 demanded an optimum 4.75% bitumen, which resulted in a less satisfactory performance, since it only complied with all the requirements 8.
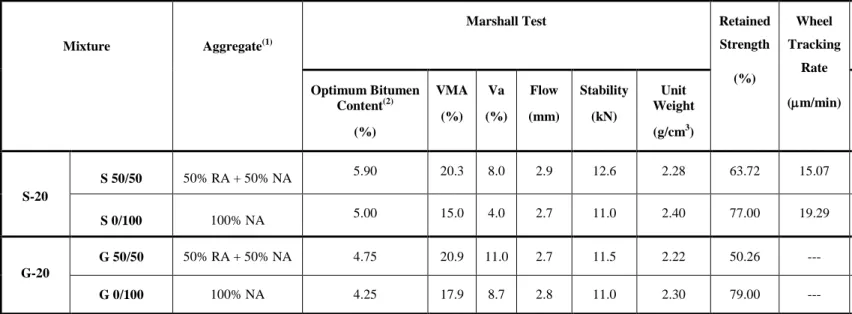
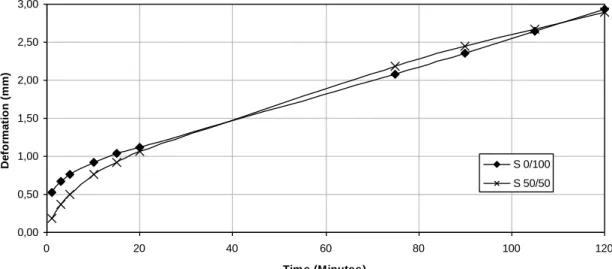
(9) for T4 traffic (50> AADTHT). Lastly, for Mixture G 0/100, the optimum percentage of bitumen was equal to 4.25, thereby meeting all requirements for T3 traffic. The values for the Marshall parameters corresponding to these optimum binder contents are shown in Table 4. 3.2. Effect of water (immersion-compression test) The results of the retained strength index can be found in Table 4. Mixture S 0/100 recorded a result of 77%, while the value of Mixture G 0/100 was 79%. These values are slightly higher than the specification threshold of 75% detailed in Table 3. Mixture S 50/50, on the other hand, presented a value of 64%. It is interesting to note that the voids value in this mixture is not excessively high. Hence, the entry of water in the mixture would be similar to that of other mixtures having the same amount of voids. This unfavourable result may be explained by the fact that, owing to the nature of the RA tested containing mortar adhered to the aggregates, water could be retained inside the mixture, displacing the bitumen and consequently resulting in a lower retained strength. Mixture G 50/50 showed a retained strength of 50%. This low value can be attributed to both the actual nature of the particular recycled aggregate used and also to the fact that the high content of air voids in the mixture (11%) magnified the effect that took place in Mixture S 50/50. As a result, the mixtures incorporating RA did not achieve the minimum 75% required by the Spanish specifications. 3.3. Permanent deformation The wheel tracking rates recorded for the S 0/100 and S 50/50 mixtures are shown in Table 4. In Mixture S 0/100 the rate is equal to 19.29 m/min while in Mixture S 50/50 it has a value of 15.07 m/min. Both values come below the limit of 20 m/min, (Table 3). Mixture S 50/50 offers a more satisfactory resistance to plastic deformations than Mixture S 0/100, which contains only natural aggregates (Fig. 4). Although this difference is not very high, the result was predictable given that Mixture S 50/50 has more voids than Mixture S 0/100 and both have the same filler/bitumen ratio. As the test is carried out at a temperature of 60 ºC, the dilation of the binder encourages the flow of the material. But this temperature is less critical if there is a higher percentage of air voids in which the bitumen can lodge during its thermal expansion process. 9.
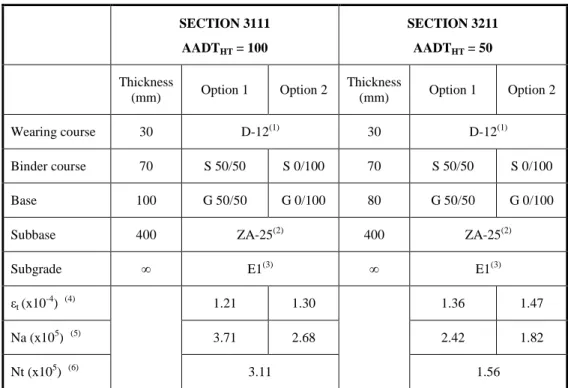
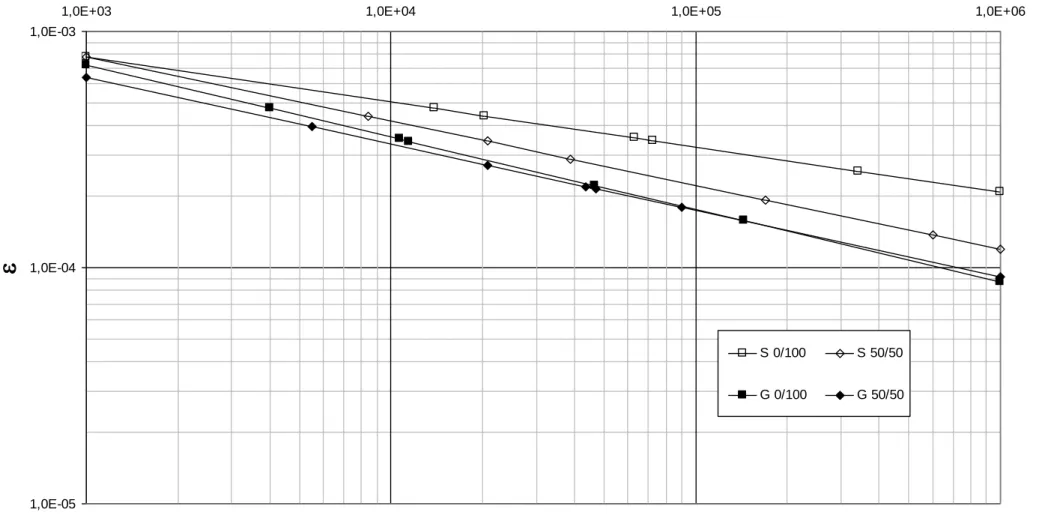
(10) Since it is not mandatory under Spanish specifications, G 0/100 and G 50/50 mixtures for the base courses were not tested for permanent deformation. 3.4. Dynamic tests The values of the dynamic modulus for the four mixtures under study are given in Table 4. Mixtures incorporating recycled aggregates showed a higher modulus, a slight increase between G 0/100 and G 50/50 and a more perceptible difference between Mixtures S 0/100 and S 50/50. The experimental values of and N for the mixtures under study are shown on a logarithmic scale in Figure 5. Both G 0/100 and G 50/50 mixtures behaved similarly towards fatigue, reflected by the fact that their slopes (B) and coefficients (k) are similar (Table 4). On the other hand, Mixtures S 0/100 and S 50/50 showed different fatigue strengths. Mixture S 50/50 had a much more pronounced slope (B) than Mixture S 0/100. Moreover, the (k) coefficients were not similar. This would imply that, for the same strain imposed, Mixture S 0/100 requires a higher number of cycles to failure and therefore behaves in a more satisfactory manner in terms of fatigue than Mixture S 50/50. These results indicate a deterioration of the fatigue law with the stiffening of the mixture, which is coherent with the theory and the observed performance of flexible pavements in low trafficked roads17. 4. PREDICTED SERVICE LIFE ANALYSIS The “predicted service life” in two different pavement sections of Spanish Instruction 6.1-IC Highway Pavement Sections9 was analysed. It is important to emphasize the fact that this analysis did not take into account the influence of the possible loss of structural strength owing to the effect of water entering into the pavement. The analysis focussed on Sections 3111 and 3211, designed for medium and low trafficked roads and very usual in Spain, i.e., with great potential for consuming recycled aggregates. The sections comprised 400 mm of unbound granular material (ZA-25), a base of Mixture G-20 with a thickness ranging from 80 to 100 mm, depending on the structural section under consideration, a binder course 70 mm thick using mixture S-20 and a 30-mm wearing course made with mixture D-12, a dense mixture commonly used on roads with medium and low traffic in Spain. Table 5 provides details on each section. This table shows that. 10.
(11) two options were considered for each section:. Option 1 used Mixtures G-20 and S-20. incorporating 50% RA and Option 2 used mixtures with 100% NA. The analysis employed a linear, elastic multi-layer model17 to compute the horizontal tensile strain t at the bottom of the base. Then these values were replaced in the corresponding fatigue laws, resulting in values of the “predicted service life” as the allowable number of repetitions (Na) of the equivalent axle load of 115 kN before the onset of fatigue cracking. The analysis was carried out by selecting a circular radial load of 142.6 mm, evenly distributed with a pressure of 0.9 MPa. Table 5 presents the results of the “predicted service life” of the two pavement sections of varying thicknesses. Table 5 also gives the total number of repetitions (Nt) of the equivalent axle load of 115 kN over a design period of 15 years, assuming an annual traffic increase rate of 2%. As can be seen in Table 5, as a consequence of the higher stiffness of Mixtures S 50/50 and G 50/50, the horizontal tensile strains at the bottom of base layers (t) are lower in the sections made with RA. Therefore, when these lower strains (t) were introduced into the corresponding laws, the resulting numbers of cycles (predicted service life) in sections made with RA were higher than those of the sections made with NA. To understand this numerical result, it is important to realise that the critical layer (the first to reach fatigue failure) is the base layer. Since the mixtures (G 0/100 and G 50/50) to be laid in the base had similar fatigue laws, the lower values of t in the base layer of the sections incorporating RA automatically produce a longer predicted service life. Note that if S 0/100 and S 50/50 mixtures were laid in the base layer (critical layer), the predicted service life of the whole section could be shorter for the sections incorporating RA due to the fact that the fatigue law of the S 50/50 is poorer than that of the S 0/100 mixture. This means that the fact that the service life of a section made with RA can become longer than the service life of a section made with NA depends to a great extent on a proper selection of the structural section. In this respect, it would seem that use of C&D debris in the asphalt bases of flexible pavements is feasible, provided a prior solution is found for the lack of resistance to water demonstrated in Subsection 3.2 herein.. 11.
(12) 5. DISCUSSION OF THE RESULTS This research confirms the results reported by other studies6,7,8. In addition, thanks to the fatigue tests carried out, it represents progress in knowledge of the performance of asphalt mixtures incorporating C&D debris. Asphalt mixtures made with recycled aggregates meet Spanish requisites for Marshall design for roads with medium or low traffic volumes.. Coinciding with the bibliographical references. indicated, this work proves that the air voids in mixtures increase with the incorporation of recycled aggregates. Both the dynamic modulus and plastic strain strength are similar or slightly improved thanks to the use of recycled aggregates. It has also been proven that the retained strength post immersion drops dramatically with the incorporation of recycled aggregates. Other researchers7 have encountered the same problem which they attribute to the high water absorption rate of these aggregates.. This property. encourages bitumen displacement by the water, giving rise to stripping of the aggregates and a generalised loss of mechanical properties. It is the cement mortar adhered to the aggregates, together with some remains of ceramic materials, that confer this high water absorption on the material. In this research, Mixture G 50/50 (coarse) underwent this effect more than Mixture S 50/50 (semi-dense), which would seem to indicate that the increase in air voids in the mixture exacerbates the problem. It should be pointed out that in the research work referenced the grading, proportioning and tests run to characterize the asphalt mixtures were different from those in this particular study being reported. Equally, the origin of the C&D debris was different. Consequently, the coincidence of results amongst the different studies carried out strengthens the validity of this general characterization of asphalt mixtures incorporating recycled aggregates from C&D debris. This current research not only confirmed these results but went farther, proving the fatigue laws governing the materials under study. It was observed that incorporation of the recycled aggregates translated into a worsening of the fatigue law in the semi-dense S 50/50 mixture whereas the effect 12.
(13) was smaller in the coarse G 50/50 mixture. Possibly the larger quantity of fines in the semi-dense mixture means that the effect of loss of fatigue strength is more perceptible than in coarser mixtures. The fatigue strength of the coarse G 50/50 mixture incorporating recycled aggregates is similar to that of the reference mixture, G 0/100, and its dynamic modulus somewhat higher. Analytical calculations proved that it is possible to find structural configurations for medium- or lowtrafficked roads capable of permitting service lives that are as long as those of sections built with conventional mixtures. Notwithstanding, if the resistance to water action of the mixtures incorporating recycled aggregates is not improved, premature pavement failure could arise. That is, the findings obtained would appear to discourage the use of the asphalt mixtures incorporating recycled aggregates studied in this research for road paving purposes until such time as their resistance to the effect of water is successfully improved. 6. CONCLUSIONS On the basis of the research carried out, the following conclusions can be listed. 1. The weakest point of the mixtures is their substantial potential for stripping provoked by the high absorption rate of the RA, essentially owing to the high porosity of the mortar adhered to them. This can provoke premature failure in a pavement section built of asphalt mixtures incorporating RA. 2. In low-trafficked, flexible pavements, the fatigue life of the asphalt mixture dropped with the incorporation of RA and the stiffness increased, even though these effects are not overly manifest when the mixture has coarse grading. 3. If the stripping potential of the mixtures incorporating RA could be successfully reduced, it would be possible to design structural sections with an adequate service life. It seems that flexible sections for medium and low volumes of traffic that incorporate RA in semi-dense mixtures in the intermediate layer and coarse mixtures in the base course are feasible from the structural point of view.. 13.
(14) 4. From the foregoing points it can be deduced that the use of recycled aggregates from construction and demolition debris in asphalt mixtures for road pavements is not yet feasible. Further research is needed to ensure the technical viability of asphalt mixtures incorporating recycled aggregates. A few guidelines for this future research are given below: . reducing water absorption by lowering the percentage of RA in the mixture;. . reducing water absorption by eliminating the mortar adhering to the RA and also particles of ceramics;. . using improved fillers and adhesion agents;. . utilizing denser grading, with a lower percentage of voids, capable of making the mixtures less vulnerable to the effect of the water.. REFERENCES 1.. SYMONDS, ARGUS, COWI, PRC BOUWCENTRUM. Construction and Demolition waste management practices, and their economic impacts. European Commission DG XI, Brussels, 1999.. 2.. MINISTERIO DE MEDIO AMBIENTE. Plan Nacional de Residuos de Construcción y Demolición 2001-2006 (in Spanish). Boletín Oficial del Estado, 2001, nº 166, 25305-25313.. 3.. BENNERT T., PAPP W., MAHER A., and GUCUNSKI N. Utilization of construction and Demolition Debris Under Traffic-Type Loading in Base and Subbase Applications. Transportation Research Record, 2000, nº 1714, 33-39.. 4.. CHI SUN POON and DIXON CHAN. Feasible use of recycled concrete aggregates and crushed clay brick as unbound road sub-base. Construction and Building Materials, 2006, 20, 578-585.. 5.. HANSEN T. C. Recycling of Demolished Concrete and Masonry. Report of Technical Committee 37Drc Demolition and Reuse of Concrete (Rilem Report nº 6).p. 296, Spon E&FN, UK, 1992.. 6.. DER-HSIEN SHEN and JIA-CHONG DU. Evaluation of building materials recycling on HMA permanent deformation. Construction and Building Materials, 2004, 18, 391-397.. 7.. PARANAVITHANA, S. and MOHAJERANI, A. Effects of recycled concrete aggregates on properties of asphalt concrete. Resources, Conservation and Recycling, 2006, 48, 1-12.. 8.. WONG, Y. D., SUN, D. D. and LAI, D. Value-added utilisation of recycled concrete in hot-mix asphalt. Waste Management, 2007, 27, 294-301.. 9.. DIRECCIÓN GENERAL DE CARRETERAS. Secciones de firme de la Instrucción de Carreteras IC (in Spanish). p. 36. Ministerio de Fomento. Ediciones Liteam, Madrid, 2002.. 10. DIRECCIÓN GENERAL DE CARRETERAS. Pliego de prescripciones técnicas generales para obras de. carreteras y puentes PG-3. Ministerio de Fomento. Ediciones Liteam, Madrid, 2002. 11. DIRECCIÓN GENERAL DE CARRETERAS. Normas NLT. Ensayos de carreteras. Ministerio de. Obras Públicas y Transportes (MOPT), second edition, Madrid, 1992. 14.
(15) 12. ASOCIACIÓN ESPAÑOLA DE NORMALIZACIÓN Y CERTIFICACIÓN (AENOR). Manual de. normas técnicas UNE-EN. Serie construcción. Áridos para mezclas bituminosas y tratamientos superficiales de carreteras. p. 526. Madrid, 2001. 13. NLT-159. Resistencia a la deformación plástica de mezclas bituminosas empleando el aparato Marshall.. Ensayos de carreteras. Ministerio de Obras Públicas y Transportes (MOPT), second edition, Madrid, 1992. 14. NLT-162. Efecto del agua sobre la cohesión de las mezclas bituminosas compactadas (Ensayo de. inmersión-compresión). Ensayos de carreteras. Ministerio de Obras Públicas y Transportes (MOPT), second edition, Madrid, 1992. 15. NLT-173. Resistencia la deformación plástica de las mezclas bituminosas mediante la pista de ensayo de. laboratorio. Ensayos de carreteras. Ministerio de Obras Públicas y Transportes (MOPT), second edition, Madrid, 1992. 16. NLT-350. Ensayo de fatiga en flexotracción dinámica de mezclas bituminosas. Ensayos de carreteras.. Ministerio de Obras Públicas y Transportes (MOPT), second edition, Madrid, 1992. 17. HUANG Y. H. Pavement Analysis and Design. p. 776. Pearson Prentice Hall, second edition, USA,. 2004.. 15.
(16) Sieve Sizes EN-933-2 (mm) Mixtures Coarse Aggregate. Percentage passing Semi-dense S-20(1) (3). S 50/50. 50% RA(4) + 50% NA(5). S 0/100. 100% NA Percentage passing. Coarse G-20(2) (3). Fine Aggregate. Filler. 25. 20. 12.5. 8. 4. 2. 0.500. 0.250. 0.125. 0.063. 100. 80-95. 64-79. 50-66. 35-50. 24-38. 11-21. 7-15. 5-10. 3-7. 100. 95. 78. 63. 40. 30. 15. 12. 8. 6.5. 100. 95. 78. 63. 40. 30. 15. 12. 8. 5.5. 100. 75-95. 55-75. 40-60. 25-42. 18-32. 7-18. 4-12. 3-8. 2-5. G 50/50. 50% RA + 50% NA. 100. 95. 75. 60. 37.75. 28.5. 13. 10. 7. 4.75. G 0/100. 100% NA. 100. 95. 75. 60. 37.75. 28.5. 13. 10. 7. 4.25. (1) S-20 indicates a semi-dense particle size distribution with a maximum nominal size of 20 mm. (2) G-20 indicates a coarse particle size distribution with a maximum nominal size of 20 mm. (3) Since the maximum nominal size is the same in all cases, the mixtures are designated as S and G followed by the x/y indication in keeping with the RA/NA proportion. (4) RA=Recycled aggregates (5) NA=Natural aggregates. Table 1. Particle size distribution and grading envelopes. 16.
(17) Test. Standard. HMA with 100% NA HMA with 50% RA S 0/100. G 0/100. S 50/50. G 50/50. Flakiness index (%). EN 933-3. 17.2. 19.4. 17.1. 18.3. Fractured particles (%). EN 933-5. 100. 100. 100. 100. Sand equivalent (%). EN 933-8. 85.4. 88.1. 75.4. 70.1. Los Angeles fragmentation (%). EN 1097-2. 19.4. 22.1. 25.6. 24.8. Water absorption (%). EN 1097-6. 0.17. 0.19. 4.59. 4.82. Relative density in paraffin oil (g/cm3). NLT-167 AFNOR P18-559. 2.69. 2.69. 2.66. 2.66. Test. Standard. Bitumen. Penetration (0.1 mm). EN 1426 BS 2000-49. 69. Softening point (ºC). EN 1427 BS 2000-58. 48.5. Peiffer’s penetration index. NLT-181 VSS.SNV 671.774a. -0.8. Density (g/cm3). NLT-122 ASTM D-70. 1.03. Table 2. Characteristics of the basic materials. 17.
(18) Heavy Traffic Category(1). Marshall mixture design criteria. Design Parameters. T00 and T0. T1 and T2. T3 and Shoulders. T4. ≥14. Voids in mineral aggregates VMA (%) Binder course, S-20. 4-6. 5-8. 4-8. 4-8(2). Base, G-20. 5-8. 6-9. 5-9. ---. Air voids in compacted mixture Va (%) Flow (mm). 2-3. Stability (kN). >15. 2-3.5 >12.5. 2.5-3.5 >10. Binder course, S-20. 1.1. Base, G-20. 1.0. 8-12. Filler/asphalt ratio, by weight ≥75. Index of retained strength (%) Binder course, S-20. 20. Base, G-20. ---. Wheel tracking rate (m/min). (1) T00 (AADTHT≥4000); T0 (2000≤ AADTHT <4000); T1 (800≤ AADTHT <2000); T2 (200≤ AADTHT <800); T3 (50≤ AADTHT<200); T4 (AADTHT <50); (AADTHT =annual average daily heavy traffic). (2) Service roads.. Table 3. Mandatory mixture design criteria in Spain (PG-3). 18.
(19) Marshall Test Mixture. Aggregate(1) Optimum Bitumen Content(2). VMA (%). Va (%). Flow (mm). Stability (kN). Unit Weight. Retained. Wheel. Fatigue Law. DM. Strength. Tracking. ε = k.NB. (MPa). (%). Rate k. B. R2. (m/min). (g/cm3). (%) 5.90. 20.3. 8.0. 2.9. 12.6. 2.28. 63.72. 15.07. 0.0051. -0.2716. 0.9697. 5016. 5.00. 15.0. 4.0. 2.7. 11.0. 2.40. 77.00. 19.29. 0.0029. -0.1903. 0.8575. 3866. 50% RA + 50% NA. 4.75. 20.9. 11.0. 2.7. 11.5. 2.22. 50.26. ---. 0.0045. -0.2823. 0.9502. 4675. 100% NA. 4.25. 17.9. 8.7. 2.8. 11.0. 2.30. 79.00. ---. 0.0060. -0.3064. 0.8620. 4086. S 50/50. 50% RA + 50% NA. S 0/100. 100% NA. G 50/50 G 0/100. S-20. G-20. (1) RA and NA stand for Recycled Aggregates and Natural Aggregates respectively (2) Percentage by weight of aggregate. Table 4. Results of the mechanical tests. 19.
(20) Thickness (mm). SECTION 3111. SECTION 3211. AADTHT = 100. AADTHT = 50. Option 1. Option 2. D-12(1). Thickness (mm). Option 1. Option 2. D-12(1). Wearing course. 30. Binder course. 70. S 50/50. S 0/100. 70. S 50/50. S 0/100. Base. 100. G 50/50. G 0/100. 80. G 50/50. G 0/100. Subbase. 400. ZA-25(2). 400. ZA-25(2). Subgrade. ∞. E1(3). ∞. E1(3). εt (x10-4). (4). Na (x105). (5). Nt (x105). (6). 30. 1.21. 1.30. 1.36. 1.47. 3.71. 2.68. 2.42. 1.82. 3.11. 1.56. (1) D-12 is a dense-graded mix with a nominal maximum size of 12 mm. Its modulus is 6,000 MPa (2) ZA-25 is an unbound granular material with a nominal maximum size of 25 mm. Its modulus is 500 MPa (3) E1 is a subgrade. Its modulus is 200 MPa (4) εt is the horizontal tensile strain at the bottom of the base, which is the critical layer in the analysis (5) Na is the allowable number of repetitions of equivalent axle load of 115 kN to prevent fatigue cracking (6) Nt is the total number of repetitions of each equivalent axle load of 115 kN over a design period of 15 years, assuming an annual traffic increase of 2%. Table 5. Pavement service lives of pavement sections with and without recycled aggregates. 20.
(21) Figure 1. Wheel tracking test. 21.
(22) Figure 2. Thee-point flexural test to evaluate fatigue strength. 22.
(23) Stability. Unit w eight 15.00. 5. 2.45. 14.00. 2.40. Stability (kN). Unit weight (g/cm 3). 2.50. 2.35 2.30 2.25 2.20. 13.00 12.00 11.00 10.00. 4. 9.00. 2.15. 8.00. 2.10 3.50 4.00 4.50 5.00 5.50 6.00 6.50 7.00 7.50 8.00. 3.50 4.00 4.50 5.00 5.50 6.00 6.50 7.00 7.50 8.00. % Bitum en. % Bitum en. Va. Flow 4.00. 14.00. 3.80. 12.00 10.00. Air voids (%). 3.40 3.20 3.00 2.80. 2.40. 8.00 6.00 4.00. 2.60. 3. 2.00. 2.20. 2. 0.00. 3.50 4.00 4.50 5.00 5.50 6.00 6.50 7.00 7.50 8.00. 3.50 4.00 4.50 5.00 5.50 6.00 6.50 7.00 7.50 8.00. % Bitum en. % Bitum en VMA. 22.00 21.00 20.00. VMA (%). Flow (mm). 3.60. 19.00. G 0/100. 18.00. G 50/50. 17.00 16.00. S 50/50. 1. S 0/100. 15.00. Polinómica (S 0/100). 14.00. 3.50 4.00 4.50 5.00 5.50 6.00 6.50 7.00 7.50 8.00 8.50 9.00 Polinómica. % Bitum en. (G 0/100) Polinómica (G 50/50) Polinómica (S 50/50). Figure 3. Curves for mixture design by the Marshall Method. 23.
(24) 3,00. Deformation (mm). 2,50. 2,00. 1,50. 1,00. S 0/100 S 50/50. 0,50. 0,00 0. 20. 40. 60. 80. 100. 120. Tim e (Minutes). Figure 4. Permanent deformation. 24.
(25) 1,0E+03. 1,0E+04. 1,0E+05. 1,0E+06. . 1,0E-03. 1,0E-04. S 0/100. S 50/50. G 0/100. G 50/50. 1,0E-05. N Figure 5. Fatigue laws. 25.
(26)
Figure

+7
Documento similar
In this paper, the aim is to analyze and to model the deformational behavior under compression and bending of SCC containing 100% coarse and 0%, 50%, and 100%
The reaction mixture was diluted with AcOEt (50 mL) and washed with water (3 × 50 mL), dried (Na 2 SO 4 ) and concentrated in vacuo and the crude mixture was purificated by
The initial state of a scheduling grammar is a state S 0 = ⟨G 0 , F ES 0 , 0 ⟩, where G 0 is the grammar initial graph, zero is the simulation start time, and F ES 0 con- tains
The combined effect of recycled sand from masonry waste and Nc-FA (M6) only decreases by 3% the mechanical strength of the reference mortar made with siliceous natural sand
In the previous sections we have shown how astronomical alignments and solar hierophanies – with a common interest in the solstices − were substantiated in the
- The lower density and higher water absorption values of the TCWA recycled aggregates, compared with the natural limestone and siliceous aggregates, mean that it is necessary to
Comparing all of the treatments, the soil with the Incubated mixture (followed by the material which is 100% sewage sludge) generally presented the highest increases of metals and
Then the normalized func- tion g/g(0) belongs to the class P of normalized functions with positive real part, hence its coefficients are bounded by 2 in modulus by Carath´ eodory’s
