TítuloQuantification of cells expressing mesenchymal stem cell markers in healthy and osteoarthritic synovial membranes
12
0
0
Texto completo
(2) MSC from joint effusions and bone marrow aspirates show similar phenotypes and have a comparable capacity to form colony-forming units, or fibroblasts11,12,13,14. MSC in synovial fluid were more numerous in patients with OA than in healthy individuals15; however, detailed quantification studies of cells expressing MSC markers in synovial mem- branes have not been performed. When cartilage is damaged, repair mechanisms are initi- ated. Frequently a lesion of cartilage is covered by a fibrous tissue-like membrane with few layers of cells. This tissue could be produced to repair a cartilage lesion but it is not biomechanically competent, and in the end a cartilage degradation process may happen. We have called this “spon- taneous repair tissue,” where spontaneous repair may be assumed to occur. There are no studies that have focused on the quantification and distribution of the MSC markers from this tissue. The aims of our study were to identify cells with chon- drogenic capacity in the synovial membranes of patients with OA; to analyze quantitative differences in the number of syn- ovial membrane cells expressing the MSC markers CD44, CD73, CD90, and CD105, from healthy and OA human joints; and to determine if cells expressing these MSC mark- ers are present in spontaneous cartilage repair. In patients with OA we found twice as many cells expressing the MSC markers as in normal synovia. In addition, cells positive for CD44 and CD90 antigens were found in tissue undergoing “spontaneous repair,” whereas CD105 antigen was not expressed by cells located in “spontaneous repair” tissue.. MATERIALS AND METHODS Harvest of synovial and spontaneous repair tissues. Immediately after hip joint surgery for prosthetic replacement, synovial samples were obtained aseptically from 20 patients with OA (mean age 65 yrs, range 50–70 yrs). Synovia from normal joints was obtained from 6 organ donors with histo- logical normal tissue (mean age 47 yrs, range 35–55 yrs). For histological analysis hematoxylin-eosin staining was performed on each sample to determine whether it was normal. Synovial membranes were placed in ster- ile Eagle’s minimum essential medium (EMEM; Cambrex, Walkersville, MD, USA) supplemented with 10,000 IU/ml penicillin and 10,000 µg/ml streptomycin for transport to the laboratory. Synovial membrane samples from each patient were also immersed in isopentane/liquid N2 and held at –80°C until processed for immunostaining. Spontaneous repair tissue from articular cartilage was obtained from human femoral heads, from the fibrous areas of OA cartilage. Samples were frozen in mounting medium for further immunohistochemical analysis. This study was approved by the local ethics committee; informed con- sent was obtained from each patient. Immunofluorescence of synovial membranes and cartilage. Frozen sections 4 µm thick were placed on Superfrost Plus slides (Menzel-Glaser, Braunschweig, Germany) and fixed in acetone at 4°C for 10 min. Monoclonal antibodies were used for immunofluorescence detection of CD44, CD73, CD90, and CD105 (Table 1 lists antibodies and their clones and sources). For CD44/CD90 and CD44/CD73 double-immunofluorescence assessment, sections were first exposed to mouse anti-human CD44 antibody (1:100). After incubation with rabbit anti-mouse immunoglobulins-FITC (1:10), the sections were exposed to mouse anti-human CD90 antibody (1:400) or mouse anti-human CD73-RPE antibody (1:1000). The CD44/CD90 immunofluorescence samples were then incubated with goat anti-mouse immunoglobulins-RPE (1:20). Immunofluorescence was green for CD44 and CD90 and red for CD44 and CD73. For CD44/CD105 or CD90/CD105 or CD73/CD105 double-immuno- fluorescence, the sections were first exposed to monoclonal anti-human CD105-FITC antibody (1:10). After incubation with mouse antihuman CD44 antibody (1:100) or mouse anti-human CD90 antibody (1:400) or mouse anti-human CD73RPE antibody (1:1000), the CD44/CD105 and CD90/CD105 sections were incubated with goat antimouse immunoglobulins-RPE (1:20). CD105 immunofluorescence was green, while CD44 or CD90 or CD73 immunofluorescence was red. To determine CD73/CD90 double-immunofluorescence, the sections were exposed to monoclonal mouse anti-human CD90 antibody (1:400). After incubation with rabbit anti-mouse immunoglobulinsFITC (1:10), sections were exposed to mouse anti-human CD73-RPE antibody (1:1000). All incubations were accomplished within 30 min at room temperature in darkness. Between each incubation sections were washed in phosphate buffered saline. Negative-staining controls were obtained by omitting the primary antibody and incubating with the secondary antibodies conjugated with FITC or RPE. Nuclei were counterstained with DAPI (4’,6-diamidi- no-2-phenylindole) at 100 ng/ml for 20 min. The sections were mounted in glycergel (Dako, Carpinteria, CA, USA)..
(3) Immunoperoxidase staining of paraffin-embedded tissue sections. Synovial membranes and micropellets were fixed in 4% paraformaldehyde and embedded in paraffin. Sections 4 µm thick were placed on Superfrost Plus slides and incubated with an anti-CD90 antigen monoclonal antibody (Table 1). The peroxidase/DAB ChemMateTM Dako EnVisionTM detection kit was employed to detect the antigenantibody reaction. Negative-staining controls were created by omission of the primary or secondary antibodies.. Table 1. Antibodies used in this study. Specificity Flow cytometry RPE-CD29 RPE-CD34 FITC-CD44 FITC-CD45 PE-CD73 PE-Cy5-CD90 FITC-CD105 APC-CD117 RPE-CD166 STRO-1 Immunohistochemistry Collagen type I Collagen type II Chondroitin 4 sulfate Integrin subunit ß1 Keratan sulfate CD90 Immunofluorescence Mouse anti-human CD44 HCAM Mouse anti-human CD90 (Thy-1) Mouse anti-human CD105-FITC Rabbit anti-mouse immunoglobulin-FITC Goat anti-mouse immunoglobulin-RPE. Clone. Antigen Retrieval. MAR4 581 IM7 HI30 AD2 5E10 8E11 YB5.B8 3A6 NS1-Ag4-1. COL-1 COL-2 2B6 4B7R 5D4 5E10 DF1485 MCA1557F. Source. BD Pharmingen BD Pharmingen BD Pharmingen BD Pharmingen BD Pharmingen BD Pharmingen Chemicon BD Pharmingen BD Pharmingen Developmental Studies Hybridoma Bank Hyaluronidase Hyaluronidase Chondroitinase Chondroitinase. Abcam Abcam ICN Biomedicals, Inc. Abcam Seikagaku America BD Pharmingen Santa Cruz Biotechnology BD Pharmingen Serotec Dako Dako. RPE: R-phycoerythrin; FITC: fluorescein; PE: phycoerythrin; APC: allophycocyanin; HCAM: homing cell adhesion molecule. Morphometric analysis. For each sample, 5 consecutive sections were analyzed using an Olympus BX61 microscope connected to an Olympus DP70 digital camera. Images were acquired from 4 fields for each section. Cells with DAPI nuclear staining and cells with single CD44, CD73, CD90, or CD105 or double CD44/CD73, CD44/CD90, CD44/105, CD73/CD90, CD73/CD105, or CD90/105 immunostaining were independently quantified. At least 2 × 10³ cells were counted for each staining experiment and percentages of stained cells were calculated. The results represent comparisons of 2 antigen pairs. In each sample, the percentage of cells positive for a marker was calculated by dividing the number of cells expressing the marker by the number of cells stained with DAPI. The percentage of cells expressing 2 markers simultaneously was calculated by dividing the number of cells double-positive for the 2 markers by the number of cells stained with DAPI. The percentage of the isolated expression of each antigen was calculated by subtracting the percentage of cells positive for this marker from the percentage of cells expressing both markers simultaneously. The total percentage of positive cells was calculated as the sum of the percentages of the isolated expression of each antigen and its coexpression. The results are expressed as mean ± standard deviation. Cell culture. Synovial membranes were dissected from associated tissues under sterile conditions, digested with 0.2% solution of collagenase type I (Gibco BRL, Life Technologies, Barcelona, Spain) in EMEM for 2 h at 37°C, centrifuged, and filtered through a 40-µm filter. Synovial membrane- derived cells (10,000 cells/cm2) were cultured in high-glucose Dulbecco’s modified Eagle’s medium (DMEM; Cambrex) supplemented with 20% fetal bovine serum (FBS) and 10,000 IU/ml penicillin and 10,000.
(4) µg/ml streptomycin (both from Gibco BRL) in a humidified 5% CO2 atmosphere at 37°C. The culture medium was replaced twice weekly. When the synovial membrane-derived cells became confluent, they were released using trypsinEDTA (Sigma-Aldrich, St. Louis, MO, USA). To reduce contamination by fibroblasts, the resultant cell suspension was subjected to a preplating technique16. The basis for this technique is that synoviocytes require more time to attach to the culture dish than fibro- blasts. Therefore, cells that had not adhered within 20 min were resuspended in fresh medium and reseeded. All experiments were performed with cells from the second passage. Cell characterization by flow cytometry. Synovial membrane-derived cells were harvested, centrifuged, washed, and counted prior to flow cytometry. Cell phenotype characterization was achieved using the formaldehydesaponin method. The 10 antibodies listed in Table 1 were used for these experiments. Optimal amounts of mouse anti-human monoclonal antibodies were determined and added to each tube for 1 h at 4°C. A control tube for each of the chromogens received equivalent amounts of isotype standards. Goat anti-mouse IgG FITC-conjugate (Southern Biotechnology, Birmingham, AL, USA) was used as a secondary antibody when necessary. A minimum of 10,000 cell-events per assay were analyzed on a FACsCalibur flow cytometer (Becton Dickinson, Madrid, Spain). Statistics were calculated by Mann-Whitney U test. Results are expressed as percent- age positive (mean ± SD). Statistical significance is accepted at p < 0.05. Differentiation studies. 1. Chondrogenesis. We used a modification of the micropellet assay of Johnstone, et al17. Briefly, synovial membrane-derived cells from the second passage were counted and tested for viability using the Trypan blue dye exclusion assay. To obtain micromass cultures, 2.5 × 10⁵ synovial membrane-derived cells were pelleted at 200 g for 5 min. The pelleted micromass was then cultured 3 weeks in chondrogenic differentiation medium supplemented with recombinant human transforming growth factor-ß3 (rHuTGF-ß3) at 33 ng/ml (Prospecany Technogene Ltd., Rehovot, Israel). The medium was changed every 3 or 4 days. Molecules characteristic of hyaline cartilage, such as proteoglycans and collagen type II, were detected by Alcian blue staining for proteoglycans or by immuno-histochemical techniques. 2. Adipogenesis. Synovial membrane-derived cells were seeded (2 × 10⁵ cells/8.6 cm2) and cultured in a one-well chamber slide in growth medium (DMEM supplemented with 20% FBS) until confluent. Adipogenesis was induced by culturing for 3 weeks using adipogenic differentiation medium (Cambrex). After fixation in 4% paraformaldehyde, the presence of adipocytes in the cultures was determined using oil red O stain to visualize cytoplasmic lipid droplets. 3. Osteogenesis. Synovial membrane-derived cells were seeded (5 × 10⁴ cells/8.6 cm2) in growth medium in a one-well chamber slide and allowed to adhere for 24 h. Osteogenesis was induced by culturing for 3 weeks using osteogenic differentiation medium (Cambrex). After fixation in 4% paraformaldehyde, the presence of calcium deposits was assessed using alizarin red stain according to the standard protocol. Statistical analysis. All statistical analyses were performed using SPSS 16.0 software for Windows; p values < 0.05 were considered statistically significant.. RESULTS Distribution and quantification of cells expressing MSC markers in synovial membranes. In this study, healthy and OA synovial membrane samples were analyzed for CD44, CD73, CD90, and CD105 antigens using double-immunofluorescence on frozen tissue and 2 antigens were analyzed simultaneously. The location of the CD44, CD90, and CD105 antigens in healthy and OA synovial membranes differed markedly (Figures 1 and 2). In healthy specimens, cells expressing these markers were located in the intimal lining. In OA specimens the distribution of these antigens was more diffuse and they were located deeper than the subintimal layer in normal synovium, around veins in the perivascular matrix..
(5) Figure 1. Cells expressing CD44, CD90, and CD105 antigens in synovial membranes shown by immunofluorescence. A, B: H&E staining of healthy (A) and osteoarthritic (B) synovial membranes. C-H: Monoclonal antibodies against CD44, CD90, and CD105 antigens were used to analyze simultaneous expression of 2 antigens in healthy and OA synovial membranes. Immunofluorescence detection of each antigen was achieved using frozen sections of synovial membranes. CD44 (green) and CD90 (red) double-immunofluorescence of healthy (C) and OA (D) synovial membranes; CD44 (red) and CD105 (green) doubleimmunofluorescence of healthy (E) and OA (F) synovial membranes; CD90 (red) and CD105 (green) double-immunofluorescence of healthy (G) and OA (H) synovial membranes. Bars A and B = ~100 µm; bars CH = ~50 µm.. Figure 2. Cells coexpressing CD44/CD73, CD73/CD90, and CD73/CD105 antigens in synovial membranes shown by immunofluorescence. A, B: H&E staining of healthy (A) and osteoarthritic (B) synovial membranes. C-H: Monoclonal antibodies against CD44, CD73, CD90, and CD105 antigens were used to analyze simultaneous expression of CD44/CD73, CD73/CD90, and CD73/CD105 antigens in healthy and OA synovial membranes. Immunofluorescence detection of each antigen was achieved using frozen sections of synovial membranes. CD44 (green) and CD73 (red) double-immunofluorescence of healthy (C) and OA (D) synovial membranes; CD73 (red) and CD105 (green) doubleimmunofluorescence of healthy (E) and OA (F) synovial membranes; CD90 (red) and CD105 (green) doubleimmunofluorescence of healthy (G) and OA (H) syn- ovial membranes. Bars A and B = ~100 µm; bars C-H = ~50 µm.. Quantification studies of healthy and OA synovial mem- branes showed that they expressed the antigens CD44, CD73, CD90, and CD105 differently (Figure 3A). In healthy synovial membranes only a small percentage of cells stained positively for the MSC markers CD44, CD90, and CD105 (CD44: 1.2% ± 0.6%; CD90: 2.1% ± 1.8%; and CD105: 1.4% ± 0.6%). In OA synovial membranes, these percentages were increased (CD44: 3.0% ± 1.7%; CD90: 7.7% ± 4.0%; and CD105: 2.3% ± 1.2%). The expressions of CD44 and CD90 were both significantly (p < 0.05) higher in OA than in healthy synovial membranes. Conversely, a high percentage of cells expressed the CD73 antigen in healthy synovial membrane (8.5% ± 3.2%), whereas this expression was reduced substantially in OA synovial mem- brane (1.8% ± 1.8%)..
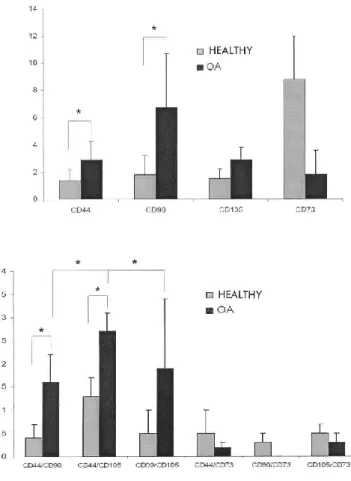
(6) Figure 3. A. Expression of CD44, CD73, CD90, and CD105 antigen in synovial membranes. Graph represents the quantitative analysis of cells showing expression for each marker in healthy and OA synovial membranes. Results are expressed as mean ± SD. *p < 0.05. B. Coexpression of 2 antigens in synovial membranes. Graph represents simultaneous expression of 2 antigens (CD44/CD90, CD44/CD105, CD90/CD105, CD44/CD73, CD90/CD73, and CD105/CD73) in healthy and OA synovial membranes. Results are mean ± SD. *p < 0.05. Analysis of the simultaneous expression of 2 antigens also showed a higher level in OA than in healthy synovial membranes when the analyzed antigens were CD44, CD90, and CD105 (Figure 3B). Coexpression of CD44 and CD90 antigens in healthy synovial membranes was observed in 0.4% ± 0.3% of the cells, while in OA synovia 1.6% ± 0.6% of the cells stained for both antigens. Notably, coexpression of CD44 and CD105 antigens in healthy and OA synovial membrane (1.3% ± 0.4% vs 2.7% ± 0.4%, respectively) was found to be higher than the coexpression of CD44 with CD90 and CD90 with CD105. Coexpression of CD90 and CD105 antigens in healthy synovial membranes occurred in 0.5% ± 0.5% of the cells, while 1.9% ± 1.5% of the cells in OA synovia stained simultaneously for these antigens. In both healthy and OA synovial membrane there were low percentages of coexpression of CD73 antigen with antigens CD44, CD90, and CD105. However, this coexpression was always slightly higher in normal synovium than in OA synovium (CD44/CD73: 0.5% ± 0.5% vs 0.2% ± 0.1%; CD73/CD90: 0.3% ± 0.2% vs 0.0% ± 0.0%; and CD73/CD105: 0.5% ± 0.2% vs 0.3% ± 0.2%). The association of expression of CD44, CD73, CD90, and CD105 antigens showed differences between these markers and between healthy and OA synovial membranes. Only 13.4% ± 12.5% and 1.9% ± 1.5% of CD44-positive cells were also positive for antigen CD73 in healthy and OA synovium, respectively. The level of coexpression of the CD44 antigen with the CD90 antigen (Figure 4A) was moderate in healthy synovial membranes, where 44.0% ± 37.6% of CD44-positive cells were also positive for the CD90 anti- gen, while this level doubled in OA synovia (84.2% ± 11.6% of CD44-positive cells were positive for CD90 antigen). In contrast, the expression of CD44 antigen showed a high level of association with the expression of the CD105 anti- gen in both healthy and OA synovial membranes (Figure 4A). Roughly 72.1% ± 12.3% of the CD44-positive cells in healthy samples and 67.2% ± 6.5% in OA synovial membranes were also positive for the CD105 antigen..
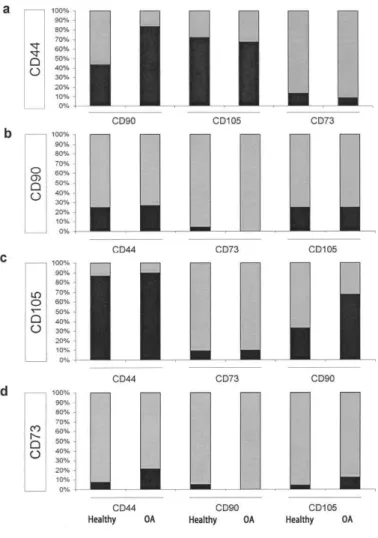
(7) Figure 4. Association of the expression of CD44, CD73, CD90, and CD105 antigens in synovial membranes. Each column represents the percentage of positive cells for one antigen that are also positive for another antigen (black area in each graph) in healthy and OA synovial membranes. A. Percentage of CD44-positive cells expressing CD73 or CD90 or CD105. B. Percentage of CD90-positive cells expressing CD44 or CD73 or CD105. C. Percentage of CD105-positive cells expressing CD44 or CD73 or CD90. D. Percentage of CD73-positive cells expressing CD44 or CD90 or CD105.. The expression of the CD90 antigen had a low level of association with the expression of CD44 or CD73 or CD105 in both healthy and OA synovial membranes (Figure 4B). Nearly 25% of CD90positive cells were also positive for the CD44 antigen or the CD105 antigen in both healthy and OA synovial membranes, whereas only 4.8% ± 4.7% of CD90-positive cells were positive for the CD73 antigen in healthy synovium (coexpression of the CD90 and CD73 antigens was not observed in OA synovium). The expression of the CD105 antigen showed a high level of association with the expression of CD44 in both healthy and OA synovial membranes (Figure 4C); in healthy samples 87.1% ± 8.8% and in OA synovia 89.9% ± 8.4% of CD105-positive cells were also positive for the CD44 anti- gen. On the other hand, expression of the CD105 antigen was more closely associated with the expression of CD90 in OA than in healthy synovial membranes (Figure 4C); 33.2% ± 19.8% of the CD105-positive cells in healthy synovia were also positive for the CD90 antigen, while in OA synovia 68.1% ± 23.9% of CD105-positive cells were also positive for CD90. Expression of the CD105 antigen showed a low level of association with expression of the CD73 anti- gen (9.9% ± 7.5% in healthy samples and 10.2% ± 7.9% in OA synovial membrane). Expression of the CD73 antigen showed in general a low level of association with the expression of CD44, CD90, and CD105 (Figure 4D) in both healthy and OA synovium (with CD40: 7.7% ± 7.6% vs 42.0% ± 27.0%; with CD90: 4.9% ± 3.6% vs 0.0% ± 0.0%; with CD105: 4.4% ± 3.6% vs 12.8% ±.
(8) 12.8%). Only a moderate association was observed with the expression of the CD44 antigen in OA synovium, where only 0.2% ± 0.1% of the cells coexpressed CD44/CD73 antigens. In summary, synovial membranes from OA patients contain higher percentages of cells positive for CD44, CD90, and CD105 antigens than those from joints without cartilage damage. This increased expression in OA synovial mem- branes was observed in greater measure to the CD90 anti- gen. Conversely, the percentage of cells expressing the CD73 antigen was higher in healthy synovial membrane than in OA synovial membrane. However, only CD44 and CD105 antigens showed high levels of coexpression. Cell-surface marker phenotype. FACS analysis demonstrated that cells derived from OA synovia show a cell-surface receptor pattern similar to that reported for bone marrow MSC (Figure 5). OA synovial membrane-derived cells were negative for CD34 and CD45 antigens. Nearly 95% of OA synovial membrane cells were positive for CD44, CD73, and CD90; and 45% of these cells stained for CD105 anti- gen. Cells isolated from OA synovia were also positive for CD29 (85.2% ± 10.5%), CD117 (72.35% ± 15.17%), STRO-1 (49.46% ± 25.58%), CD105 (45.5% ± 8.29%), and CD166 (32.29% ± 16.69%) (Table 2).. Figure 5. Phenotype of cells isolated from synovial membranes of patients with OA. Antibodies listed in Table 1 were used for this procedure. Figure shows representative histograms of multipotential mesenchymal stem cells obtained from FACS analysis. Black line signifies the specific antibody; grey line represents the isotype control.. Table 2. Percentage of phenotype-positive synovial membrane cells at the second passage (n = 20). Data are shown as mean ± SD. CD CD29 CD44 CD73 CD90 CD105 CD117 CD166 STRO-1. Specificity. Percentage of Positive Cells. Alpha-1 integrin H-CAM Ecto-5-nucleotidase Thy-1 SH-2, Engoglin c-Kit, SCFR ALCAM Stromal antigen 1. 85.2 ± 10.5 99.1 ± 1.4 95.1 ± 23.7 98.2 ± 14.6 45.5 ± 8.3 72.3 ± 15.2 32.3 ± 16.7 49.5 ± 25.6.
(9) Multilineage differentiation potential of synovial membrane-derived cells. To determine whether the cells from OA synovial membranes were multipotential, we cultured the cells in chondrogenic, adipogenic, or osteogenic differentiation media using established protocols9. Chondrogenesis was observed in all cell preparations analyzed (Figure 6A, 6B). Micromass cultures were tested for the presence of markers characteristic of hyaline cartilage using Alcian blue staining for proteoglycans and immunodetection of collagen type II. Proteoglycans and collagen type II were located throughout the newly formed matrix, with the highest staining intensity in the core of the micropellets.. Figure 6. Chondrogenic, adipogenic, and osteogenic capacities of synovial membrane cells from patients with OA. Chondrogenesis was assessed by incubation of micropellet cultures in chondrogenic differentiation medium and TGF-ß3. The resulting micromass was stained for proteoglycans with Alcian blue (a). Immunodetection of collagen type II is shown (b). Presence of adipocytes was assessed by detection of lipid droplets by oil red O staining (c); presence of calcium deposits was determined by staining with alizarin red (d). Original magnification ×100 for all photographs. Synovial membrane-derived cells cultured in adipogenic medium developed lipid droplets, an indicator of adipogenic differentiation (Figure 6C). The osteogenic potential of synovial membranederived cells cultured in osteogenic media was demonstrated using alizarin red stain to show calcification (Figure 6D). Quantification of cells expressing CD44, CD90, and CD105 antigens in “spontaneous repair” tissue. Analysis of localized spontaneous repair tissues covering the OA-damaged cartilage showed cells that expressed the characteristic antigens of MSC (Figures 7A, 7B), such as CD44 (10.2% ± 1.5%) and CD90 (12.3% ± 2.1%). The expression of CD44 was only slightly associated with the expression of CD90 antigen; only 0.71% ± 0.5% of cells coexpressed both anti- gens. In spontaneous repair tissue 5.6% of CD44-positive cells were also positive for CD90, and 6.7% of CD90-positive cells were also positive for CD44 antigen. Interestingly, the CD105 antigen was not present in spontaneous repair tissue..
(10) DISCUSSION This study confirms for the first time that OA synovia contain more cells expressing MSC markers than do synovial membranes from healthy joints. In addition, we demonstrated that synovial membranes from patients with OA contain MSC with chondrogenic capacity and that “spontaneous repair” tissue from OA cartilage contains cells expressing MSC markers. The presence of MSC in synovial membranes was recently reported7,8. These investigators defined the cells as mesenchymal because of their phenotypic profile and potential for differentiation; these cells were also shown to have ultrastructural and morphologic features similar to B synoviocytes18. Although there are no specific markers to identify MSC, a number of monoclonal antibodies for phenotypically characterizing these tissue-derived stem cells have been developed5. The general consensus is that MSC should be negative for the hematopoietic markers CD34 and CD45, and positive for CD44, CD73, CD90, and CD1054. The culture conditions used to isolate MSC from the synovium are similar to those used to obtain fibroblastic synoviocytes and are based, in part, on the fact that synoviocytes require more time to attach to the culture dish than MSC. This suggests that only a subset of cells in the synovium-derived cell population is constituted of stem cells. Because no specific marker for MSC is presently available, MSC characterization is currently based on their functional properties. To improve the number of MSC isolated from synovial membranes, we used a preplating technique that minimizes the number of contaminating fibroblasts in the culture16. We used surface markers found on cells with multipotential properties to phenotypically characterize MSC. Our cell population was phenotypically characterized by simultaneous positive staining for CD44, CD73, and CD90; nearly 95% of all MSC expressed these antigens, which have been identified as markers for undifferentiated bone marrow MSC and synovium-derived adherent cells6,12,13,19. In addition, we demonstrated that, under appropriate conditions, synovial membrane-derived cells can differentiate into chondrocytes, adipocytes, or osteoblasts. These findings indicate that synovia from OA patients have a cell population with multilineage properties possessing phenotypic markers similar to those observed for bone marrow MSC. These results confirm that the synovial membrane-derived cells observed in our study could be legitimately designated as MSC. A previous quantitative study of the MSC population in OA synovia has been performed; however, the study employed flow cytometry and did not compare OA with normal synovia8. We carried out for the first time a comparative semiquantitative study of cells expressing MSC markers using OA and normal synovial samples. We were also able to elucidate the tissue distribution of MSC in synovial membranes and show that OA synovia contain a higher number of cells expressing MSC markers than normal synovia. The presence of cells expressing MSC markers in the synovial tissues of patients with OA raises the question whether these cells appear in the joint as a result of inflammatory processes or whether they are already present prior to onset of the disease. It has been suggested that mesenchymal cells are among the earliest cells to arrive in the prearthritic joint15. In an effort to resolve this question, we were able to demonstrate that the synovial tissue of healthy donors contains MSC markers before any active articular inflammatory process occurs. We also note that during degenerative inflammatory processes a number of our OA cases presented with typical features of an inflammatory condition with chronic synovitis, including intimal cell hyperplasia and infiltration of lymphocytes, plasma cells, and monocyte/macrophage cells. The inflammatory cells found in synovial membranes are derived from bone mar- row and transported through the vascular system and peripheral blood. MSC may also migrate to OA synovial mem- branes in the same way. We demonstrated that CD44/CD90 is located in the subintimal zone and around blood vessels in the synovium. Other investigators suggest that canals between the bone marrow and synovium allow migration of bone marrow MSC into the synovium of inflamed joints2. Because activated osteoclasts were found in close proximity to enlarged canals, the mechanism of formation of bone canals is at least partly osteoclast-mediated2. When a tissue is damaged, repair mechanisms are initiated that involve stem cells and inflammatory cells already in the compromised tissue or migrating to it through the vascular system. Because articular cartilage is avascular, it must either self-repair or rely on neighboring tissues for repair. It has been reported that human articular cartilage tissue has MSC that may participate in the repair of cartilage lesions2. A further factor in the repair process involves the synovial membrane as a potential source of nutrients and other factors that modulate cartilage repair13,20. It is possible that the MSC having chondrogenic potential that are present in the synovial membrane can migrate to the damaged cartilage to participate in the active process of cartilage regeneration and repair. In support of this possibility, MSC have been found in the synovial fluid of patients with OA15. We analyzed the tissue covering damaged.
(11) cartilage in patients with OA (we have called this “spontaneous repair tissue”), where spontaneous tissue repair may be assumed to occur, and found cells expressing MSC markers (CD44 and CD90) that show a phenotype similar to MSC identified in OA synovial membranes. Although cells expressing MSC markers are located in spontaneous repair tissue of patients with OA, the capacity of these cells to repair cartilage may be limited by the cartilage degradation progress. The finding that the CD105 antigen is not expressed by cells located in repair tis- sue could suggest that these cells are necessary for repair processes to be effective in OA cartilage. In summary, cells with the characteristic phenotype of MSC were isolated from OA synovial membranes. These cells have the capacity to differentiate into chondrocytes in vitro. Synovial membranes from patients with OA contain more cells expressing MSC markers than do those from joints with no cartilage damage. Spontaneous cartilage repair tissue contains cells positive for CD44 and CD90, but the CD105 antigen was absent.. ACKNOWLEDGMENT The authors express appreciation to all members of the Department of Orthopedics and the Tissue Bank of the Complejo Hospitalario Universitario A Coruña for providing synovial samples. We thank Pilar Cal for expert secretarial support. We also thank Purificacion Filgueira and M. José Sánchez for excellent technical assistance.. REFERENCES 1. Brandt KD, Mazzuca SA. Experience with a placebo-controlled randomized clinical trial of a disease-modifying drug for osteoarthritis: the doxycycline trial. Rheum Dis Clin North Am 2006;32:217-34. 2. Alsalameh S, Amin R, Gemba T, Lotz M. Identification of mesenchymal progenitor cells in normal and osteoarthritic human articular cartilage. Arthritis Rheum 2004;50:1522-32. 3. Dowthwaite GP, Bishop JC, Redman SN, Khan IM, Rooney P, Evans DJ, et al. The surface of articular cartilage contains a progenitor cell population. J Cell Sci 2004;117:889-97. 4. Dominici M, Le Blanc K, Mueller I, Slaper-Cortenbach I, Marini F, Krause D, et al. Minimal criteria for defining multipotent mesenchymal stromal cells. The International Society for Cellular Therapy position statement. Cytotherapy 2006;8:315-7. 5. Horwitz EM, Le Blanc K, Dominici M, Mueller I, Slaper-Cortenbach I, Marini FC, et al. Clarification of the nomenclature for MSC: The International Society for Cellular Therapy position statement. Cytotherapy 2005;7:393-5. 6. Djouad F, Bony C, Häupl T, Uze G, Lahlou N, Louis-Plence P, et al. Transcriptional profiles discriminate bone marrow-derived and synovium-derived mesenchymal cells. Arthritis Res Ther 2005;7:R1304-15. 7. De Bari C, Dell’Acio F, Tylzanowski P, Luyten FP. Multipotent mesenchymal stem cells from adult human synovial membrane. Arthritis Rheum 2001;44:1928-42. 8. Fickert S, Fiedler J, Brenner RE. Identification, quantification and isolation of mesenchymal progenitor cells from osteoarthritic synovium by fluorescence automated cell sorting. Osteoarthritis Cartilage 2003;11:790-800. 9. Sakaguchi Y, Sekiya I, Yagishita K, Muneta T. Comparison of human stem cells derived from various mesenchymal tissues: superiority of synovium as a cell source. Arthritis Rheum 2005;52:2521-9. 10. Shirasawa S, Sekiya I, Sakaguchi Y, Yagishita K, Ichinose S, Muneta T. In vitro chondrogenesis of human synovium-derived mesenchymal stem cells: Optimal condition and comparison with bone marrow-derived cells. J Cell Biochem 2006;97:84-97. 11. Johnstone B, Hering TM, Caplan AI, Goldberg VM, Yoo JU. et al. In vitro chondrogenesis of bone marrowderived mesenchymal progenitor cells. Exp Cell Res 1998;238:265-72. 12. Lee RH, Kim B, Choi I, Kim H, Choi HS, Suh K, et al. Characterization and expression analysis of mesenchymal stem cells from human bone marrow and adipose tissue. Cell Physiol Biochem 2004;14:311-24. 13. Majumdar MK, Banks V, Peluso DP, Morris EA. Isolation, characterization, and chondrogenic potential of human bone marrow-derived multipotential stromal cells. J Cell Physiol 2000;185:98-106. 14. Jones EA, Kinsey SE, English A, Jones RA, Straszynski L, Meredith DM, et al. Isolation and characterization of bone marrow multipotential mesenchymal progenitors cells. Arthritis Rheum 2002;46:3349-60. 15. Jones EA, English A, Henshaw K, Kinsey SE, Markham AF, Emery P, et al. Enumeration and phenotypic characterization of synovial fluid multipotential mesenchymal progenitor cells in inflammatory and degenerative arthritis. Arthritis Rheum 2004;50:817-27. 16. Richler C, Yaffe D. The in vitro cultivation and differentiation capacities of myogenic cell lines. Dev Biol 1970;23:1-22. 17. Fuentes-Boquete I, López-Armada MJ, Maneiro E, Fernández-Sueiro JL, Caramés B, Galdo F, et al. Pig chondrocyte xenoimplants for human chondral defect repair: an in vitro model. Wound Repair Regen 2004;12:444-52..
(12) 18. Vandenabeele F, De Bari C, Moreels M, Lambrichts I, Dell’Accio F, Lippens PL, et al. Morphological and immunocytochemical characterization of cultured fibroblast-like cells derived from adult human synovial membrane. Arch Histol Cytol 2003;66:145-53. 19. Barry F, Boynton R, Murphy M, Haynesworth S, Zaia J. The SH-3 and SH-4 antibodies recognize distinct epitopes on CD73 from human mesenchymal stem cells. Biochem Biophys Res Commun 2001;289:519-24. Erratum in: Biochem Biophys Res Commun 2002;290:1609. 20. Hunziker EB, Rosenberg LC. Repair of partial-thickness defects in articular cartilage: cell recruitment from the synovial membrane. J Bone Joint Surg Am 1996;78:721-33..
(13)
Figure


+2

Documento similar
First, it studies the impact of the entrepreneur's capacity (training, experience and confidence) on business performance, and investigates the mediation of other factors such as
Independently, we tried an experimental approach to the problem of motility based on the analysis of the variations in the speckle pattern produced by a deposit of living cells.
The main goal of this thesis was to study the effects of the transplantation of human neural stem cells (hNSCs), specifically hVM1 clone 32 cells, in an in vivo PD mouse model using
This study has been designed to demonstrate the efficacy of the intra-articular administration of 15 million Equine Umbilical Cord Mesenchymal Stem Cells
(C) lncRNAs can represent a bridge between the many layers of epigenetic gene regulation, interacting with, for example, histone modifiers or serving as ceRNAs for miRNAs; (D)
In low density cultures, spheres are clonally derived colonies that are composed of a minority of stem cells and a majority of progenitor cells, the founding cell of the colony being
SECTION 3 - The role of RINGO proteins in the brain 123 RingoA mRNA is expressed in neural stem cells and proliferating progenitor cells 123 Analysis of neural stem cells
The additional value of several clinical attributes was tested, using the low-density array data obtained from untreated patients with a known diagno- sis: presence of
