
An investigation of the coupled water and heat transport in green roof substrates
77
0
0
Texto completo
(2) PONTIFICIA UNIVERSIDAD CATOLICA DE CHILE ESCUELA DE INGENIERIA. AN INVESTIGATION OF THE COUPLED WATER AND HEAT TRANSPORT IN GREEN ROOF SUBSTRATES. VICTORIA PAZ SANDOVAL VALDÉS Members of the Committee: FRANCISCO SUÁREZ POCH CARLOS BONILLA MELÉNDEZ MARÍA FERNANDA HERNÁNDEZ LÓPEZ CHRISTIAN DANI GUZMÁN. Thesis submitted to the Office of Research and Graduate Studies in partial fulfillment of the requirements for the Degree of Master of Science in Engineering Santiago de Chile, (December, 2016).
(3) ACKNOWLEDGEMENTS. First and foremost, I have to thank my advisor, Dr. Francisco Suárez for his concern and constant encouragement during the investigation. I want to thank to whole team of the Department of Hydraulic and Environmental Engineering, especially to my friends Vasty, Guillermo, Lorena, Pablo, Maximiliano, Francisca, Mauricio and Alex, for their friendship, support and patience during my stay in the office. I also thank my friends of the School of Engineering for their company and great moments during the career. I also thank the support of from the Center for Sustainable Urban Development (CEDEUS - CONICYT/FONDAP/15110020). I also want thank other projects that partially. funded. this. work. (INNOVA-CORFO. 12IDL2-13630,. CONICYT/FONDECYT/1131131). Likewise want to thank the people who helped in this investigation, Nicole, Macarena, Coté, José and Eduardo. I am indeed grateful to my parents and sisters, who are always a source of support and affection. The most special thanks goes to my boyfriend Marcos support and encourage my investigation..
(4) CONTENTS Page ACKNOWLEDGEMENTS ......................................................................................... 3 LIST OF TABLES ...................................................................................................... vi LIST OF FIGURES .................................................................................................... vii RESUMEN .................................................................................................................. ix ABSTRACT ................................................................................................................. x 1. INTRODUCTION .............................................................................................. 1 1.1 Motivation .................................................................................................. 1 1.2 Objectives ................................................................................................... 2 1.3 Structure of the thesis ................................................................................. 2. 2. POROUS MEDIA CHARACTERIZATION TO SIMULATE WATER AND HEAT TRANSPORT THROUGH GREEN ROOF SUBSTRATES ............................ 3 2.1 Abstract ...................................................................................................... 3 2.2 Introduction ................................................................................................ 4 2.3 Materials and methods ............................................................................... 7 2.3.1 Modeling coupled water and heat transport ..................................... 7 2.3.2 Green roof substrates ....................................................................... 9 2.3.3 Physical, hydrodynamic and thermal properties of green roof substrates 10 2.4 Results and discussion .............................................................................. 12 2.4.1 Physical, hydrodynamic and thermal properties of substrates ....... 12 2.4.2 Simulation of water and heat transport through green roof substrates 2.5 Conclusions .............................................................................................. 32. 3. 19. A NEW METHOD TO DETERMINE HOW COMPACTION AFFECTS WATER AND HEAT TRANSPORT IN POROUS MEDIA – APPLICATION TO GREEN ROOF SUBSTRATES ...................................................................................... 34.
(5) 3.1 Abstract .................................................................................................... 34 3.2 Introduction .............................................................................................. 35 3.3 Materials and methods ............................................................................. 38 3.3.1 Impact of compaction on the hydrodynamic properties ................ 39 3.3.2 Impact of compaction on the thermal properties ........................... 41 3.3.3 Substrates ....................................................................................... 43 3.3.4 Influence of substrate compaction on the performance of a hypothetical roof system ..................................................................................... 43 3.4 Results and discussion .............................................................................. 45 3.4.1 Impact of compaction on the substrates hydrodynamic properties 45 3.4.2 Impact of compaction on the substrates thermal properties .......... 48 3.4.3 Influence of substrate compaction on the performance of a hypothetical roof system ..................................................................................... 52 3.5 Conclusions .............................................................................................. 58 4. CONCLUSIONS AND PERSPECTIVES........................................................ 60. REFERENCES ........................................................................................................... 61.
(6) LIST OF TABLES Page Table 2-1: Texture according to the USDA soil classification system, soil particle density (s), maximum density (max), uniformity coefficient (Cu) and curvature coefficient (Cc) of the substrates used in this study. ........................................................ 13 Table 2-2. Hydrodynamic and thermal properties of the substrates. ............................... 15 Table 3-1. Hydrodynamic properties of the substrates used in this study. The first row of each substrate refers to the uncompacted values and the second row corresponds to the compacted values obtained with the parametric analysis. ............................................... 46 Table 3-2. Thermal properties of the substrates studied in this investigation. The first row of each substrate refers to the uncompacted state, while the second row corresponds to the compacted values obtained with the parametric analysis. ..................................... 49. vi.
(7) LIST OF FIGURES Page Figure 2-1:Substrates used in this study: (a) substrate S1; (b) substrate S2; (c) substrate S3; (d) substrate S4; and (e) substrate S5......................................................................... 10 Figure 2-2: Water retention curves of substrates S1 (a), S2 (b), S3 (c), S4 (d), and S5 (e). Black diamonds are observations and solid lines are the modeled values. ...................... 16 Figure 2-3.Thermal conductivity curves for substrates S1 (a), S2 (b), S3 (c), S4 (d), and S5 (e). Black diamonds are observations and solid lines are the modeled values. The error bars correspond to the standard deviation of three thermal conductivity measurements at each moisture level. .............................................................................. 18 Figure 2-4.Green roof conceptual model used to run the numerical simulations. The numerical discretization used to solve the governing equations and the locations of observation points are also shown.................................................................................... 20 Figure 2-5: Meteorological and irrigation data used to drive the numerical simulations: (a) ambient temperature and solar radiation; (b) relative humidity and wind velocity; and (c) irrigation rate. ............................................................................................................. 23 Figure 2-6. Evolution of the volumetric water content at different depths during the first five days of simulation for substrates S1 (a), S2 (b), S3 (c), S4 (d), and S5 (e). The red line depicts the water content at the substrate surface and the green line represents the water content at 10 cm depth. .......................................................................................... 25 Figure 2-7. Cumulative water flux exiting through the drain of the roof system during the 30 days of simulation. Substrates are subject to the environmental conditions and a daily irrigation of 10 mm. ................................................................................................ 26 Figure 2-8. (a)-(e) Modeled temperatures at different depths in the five substrates (1.5 and 7.2 cm depth) and modeled temperature near the bottom of the concrete slab (34.5 cm depth), during the first five days of simulation. (f)-(j) Average temperature profile (Tmean, green line) and temperature envelope in the roof system during the entire simulation. Maximum temperatures (Tmax) are depicted in red and minimum temperatures (Tmin) are displayed in blue. ........................................................................ 28 vii.
(8) Figure 2-9. (a) Heating cumulative thermal energy required to maintain a reference room temperature of 23°C below the roof system. (b) Cooling cumulative thermal energy required to maintain a reference room temperature of 23°C below the roof system. (c) Modeled temperatures at 35 cm depth (bottom of the concrete) throughout the 30 days of simulation. ........................................................................................................................ 30 Figure 3-1:Water retention curves for the uncompacted (ρ) and compacted (ρc) substrates: (a) substrate S1; (b) substrate S2; (c) substrate S3; (d) substrate S4; (e) substrate S5. ..................................................................................................................... 47 Figure 3-2: Kersten number (e), which represents the normalized thermal conductivity curves of the five substrates investigated in this study. The e values were obtained using the empirical data reported in Chapter 2. The κ values correspond to those of the Coté and Konrad (2005) model. ............................................................................................... 49 Figure 3-3: Termal conductivity curves for the uncompacted (ρ) and compacted (ρc) substrates: (a) substrate S1; (b) substrate S2; (c) substrate S3; (d) substrate S4; (e) substrate S5. ..................................................................................................................... 51 Figure 3-4: Modeled volumetric water content at the atmosphere-substrate interface. Light colors correspond to the uncompacted substrate, and dark compacted substrate. (a) substrate S1; (b) substrate S2; (c) substrate S3; (d) substrate S4; (e) substrate S5. ......... 53 Figure 3-5: Cumulative flux that exits the bottom of the uncompacted (light lines) and compacted (dark lines) substrates during the 30 days of simulation. (a) substrate S1; (b) substrate S3; (c) substrate S4; (d) substrate S5. The results of the substrate S2 are not shown as this substrate did not drain water during the entire simulation. ....................... 54 Figure 3-6: Modeled temperature evolution of the five substrates in 30 days of simulation and in 34.5 cm (concrete) below the surface. Light colors correspond to the uncompacted substrate, and dark compacted substrate. ................................................... 56 Figure 3-7: (a-e) Heating cumulative thermal energy required to maintain a reference room temperature of 23°C below the roof system. (f-j) Cooling cumulative thermal energy required to maintain a reference room temperature of 23°C below the roof system. .............................................................................................................................. 57 viii.
(9) RESUMEN Las cubiertas vegetales integran vegetación a los edificios, minimizando los requerimientos energéticos y escorrentía superficial. Para optimizar estos beneficios, se necesita un entendimiento de los procesos que controlan los flujos de agua y calor en cubiertas vegetales. Los factores principales que determinan los flujos de agua y calor en las cubiertas vegetales son las características hidrodinámicas y térmicas de las capas de sustrato y vegetación. Los sustratos son medios porosos artificiales que se usan para objetivos tecnológicos e ingenieriles. La compactación de un sustrato afecta los procesos físicos que ocurren en el mismo y no se ha estudiado su efecto en los flujos de calor y agua. En este estudio se han caracterizado las propiedades físicas, hidrodinámicas y térmicas de cinco sustratos de cubiertas vegetales. Además, se evaluó el efecto de la compactación en estas propiedades realizando un ajuste teórico a los parámetros térmicos e hidráulicos obtenidos anteriormente. Se realizaron simulaciones numéricas de flujos de agua y calor acoplados para evaluar el impacto de las propiedades obtenidas y compactadas en el comportamiento hidráulico y térmico de un sistema de una cubierta vegetal. Los cinco sustratos mostraron gran capacidad de almacenar y transportar flujos de agua, mientras que su capacidad de transportar calor fue similar a otros sustratos de cubiertas vegetales reportados en la literatura. Bajo condiciones no saturadas, la capacidad de retención y el volumen de almacenamiento de los sustratos controlaron la respuesta hidráulica de cada sustrato. El efecto de la compactación muestra la disminución de espacio de poros y el aumento de fuerzas capilares, provocando una reducción del volumen de almacenamiento. En las propiedades térmicas se observa un incremento general de la conductividad dado el aumento de contacto entre partículas. Las simulaciones numéricas muestran que el sustrato de tierra de hoja con perlita presenta la menor difusión vertical de calor y una alta capacidad para almacenar agua (mismo resultado obtenido cuando los sustratos se compactan). La modelación dinámica presentada en este estudio puede representar la complejidad de los procesos que ocurren en las cubiertas vegetales y puede ser una herramienta útil para diseñar la configuración de una cubierta vegetal. ix.
(10) ABSTRACT. Green roofs integrate vegetation into buildings thereby minimizing energy requirements and water runoff. An understanding of the processes controlling water and heat fluxes in green roofs under site-specific climatic conditions is needed to optimize their benefits. The hydrodynamic and thermal characteristics of substrates and vegetation layers are the primary controlling factors determining water and heat fluxes on green roofs. Substrates are artificial porous media that are used for engineering and technological purposes. Soil compaction affects the water physical processes that occur within green roof substrates and this process has not been taken into account in water and heat fluxes. In this study, I characterized the physical, hydrodynamic and thermal properties of five green roof substrates. Additionally, the evaluation of substrates compaction was performed through a theoretical adjustment on the previous thermal and hydraulic parameters. I performed coupled heat and water transport numerical simulations to assess the impact of the previous properties on the hydraulic and thermal performance of a hypothetical roof system. The five substrates showed a large capacity to store and transport water, while their ability to conduct heat was similar to other green roof substrates reported in the literature. Under unsaturated conditions, the water retention and the storage capacity of the substrates controlled the hydraulic response of each substrate. The effect of compaction in water properties shows the decrease of pore size and the increment of capillary forces, causing a reduction of volume storage. The thermal properties show an increasing trend in the thermal conductivity due to the increment of particle contact. Our simulations results show that the substrate with peat and perlite is the one with the best capacity to store water and to reduce the heat flux trough the substrate layer (even when the substrates are compacted). This substrate outperforms the others most likely due to its low thermal conductivity and its large pore space. The dynamic modeling presented in this study can represent the complexity of the processes that are occurring in green roof substrates and thus, it is a tool that can be used to design the configuration of a green roof. x.
(11) 1. 1 1.1. INTRODUCTION. Motivation. Green roofs have become widely adopted over the past 20 years as a technological response to a wide public concern towards sustainable development, controlling greenhouse gas emissions and increasing energy efficiency (Hashemi et al., 2015). They integrate vegetation into buildings, with the aim of minimizing some of the negative impacts of urbanizations (Raji et al., 2015). A properly designed green roof can decrease environmental pollution, noise levels, building energy consumption, and stormwater runoff (Vijayaraghavan, 2016), while they provide ecological services and increase urban biodiversity (Brown and Lundholm, 2015). The overall performance of green roofs depends on the interaction between environmental conditions and the biophysical components of green roofs (Raji et al., 2015). The appropriate selection of its components is key to develop a green roof that can optimize the response under site-specific climate conditions and local materials (Vijayaraghavan, 2016). The substrate and the vegetation layers are the most important components determining water and heat fluxes on green roofs (Buckland-Nicks et al., 2016). In this investigation, without detracting the important role that vegetation has on the hydraulic and thermal performance of a green roof, I focused on green roof substrates. The substrate is an engineered media that has an improved performance compared to natural soils (Brown and Lundholm, 2015). It provides critical resources for the vegetation: water, nutrients, and a support media (Campbell and Norman, 2013). The water retention capacity and the thermal behavior of a green roof strongly depend on the physical properties of the substrate (Campbell and Norman, 2013). The moisture content of the substrate it is a key element for vegetation survival, especially in arid and semiarid climates. In addition, substrate compaction modifies the structure of the porous medium, changing the moisture evolution and the response of the green roof to the atmospheric conditions (Alaoui et al., 2011). Hence, to improve the overall performance of green roofs, it is important to characterize the physical, hydrodynamic and thermal properties of green roof substrates..
(12) 2. 1.2. Objectives. The general objective of this work is to investigate how the hydrodynamic and thermal properties of substrates influence the water and heat transport in green roof substrates considering all the water flow mechanisms found in green roofs. The specific objectives are: 1) to characterize a set of five organic and mineral green roof substrates in terms of their hydrodynamic and thermal properties: water retention curve, hydraulic conductivity curve, thermal conductivity, and specific heat capacity; 2) to evaluate the impacts of the previous properties on the water and heat transport through green roof substrates using numerical simulations; 3) to develop a methodology based on theoretical considerations combined with empirical information that can be used to represent the effect of compaction on the hydrodynamic and thermal properties of a porous medium, and 4) to predict water and heat fluxes to the compacted green roof substrates with the use of numerical simulations.. 1.3. Structure of the thesis. This thesis is organized in the following way. Chapter 1 is a brief introduction to the topic that shows the motivation of this work, and the general and specific objectives of the thesis. Chapter 2 corresponds to a manuscript entitled “Porous media characterization to simulate water and heat transport through green roof substrates” that is currently under review in a peer-review journal. Chapter 3 is a manuscript called “A new method to determine how compaction affects water and heat transport in porous media – application to green roof substrates” that will be submitted for peer-review. Finally, chapter 4 corresponds to the conclusions and perspectives that can be drawn from the work reported in chapters 2 and 3..
(13) 3. 2. POROUS MEDIA CHARACTERIZATION TO SIMULATE WATER AND HEAT TRANSPORT THROUGH GREEN ROOF SUBSTRATES 2.1. Abstract. Green roofs integrate vegetation into buildings thereby minimizing energy requirements and water runoff. An understanding of the processes controlling water and heat fluxes in green roofs under site-specific climatic conditions is needed to optimize their benefits. The hydrodynamic and thermal characteristics of substrates and vegetation layers are the primary controlling factors determining water and heat fluxes on green roofs. In this study, I characterized the physical, hydrodynamic and thermal properties of five green roof substrates (S1-S5). I performed coupled heat and water transport numerical simulations to assess the impact of the previous properties on the hydraulic and thermal performance of a hypothetical roof system. The five substrates showed a large capacity to store and transport water, while their ability to conduct heat was similar to other green roof substrates reported in the literature. Under unsaturated conditions, the water retention and the storage capacity of the substrates controlled the hydraulic response of each substrate. Our simulations results show that the S2 substrate is the one with the best capacity to store water and to reduce the heat flux trough the substrate layer. This substrate outperforms the others most likely due to its low thermal conductivity and its large pore space. The dynamic modeling presented in this study can represent the complexity of the processes that are occurring in green roof substrates and thus, it is a tool that can be used to design the configuration of a green roof.. Keywords: green roof substrate, water retention curve, hydraulic conductivity, thermal conductivity, coupled water and heat flow, urban sustainability.
(14) 4. 2.2. Introduction. Green roofs have become widely adopted over the past 20 years as a technological response to a wide public concern towards sustainable development, controlling greenhouse gas emissions and increasing energy efficiency (Hashemi et al., 2015). They integrate vegetation into buildings helping to minimize some negative impacts of urbanizations (Raji et al., 2015). A properly designed green roof can decrease environmental pollution, noise levels, building energy consumption, and stormwater runoff (Vijayaraghavan, 2016), while they provide ecological services and increase urban biodiversity (Brown and Lundholm, 2015). The overall performance of green roofs depends on the interaction between environmental conditions and the biophysical components of green roofs (Raji et al., 2015). Nevertheless, a myriad of choices for green roof construction are available, including alternatives for vegetation, substrates and membranes. A quantitative understanding of the processes that occur in each component of the green roof, and under site-specific climatic conditions is needed to realize one or more of the benefits mentioned above. This is particularly relevant in arid and semi-arid regions, where local materials may be different and climatic conditions greatly differ from humid regions, where most of the green roof research has been carried out to date (Peng and Jim, 2015). The substrate and the vegetation layers are the most important components determining water and heat fluxes on green roofs (Buckland-Nicks et al., 2016). In this study, without detracting the important role that vegetation has on the hydraulic and thermal performance of a green roof, we focus on green roof substrates. The substrate is an engineered media that has an improved performance compared to natural soils (Brown and Lundholm, 2015). It provides critical resources for the vegetation: water, nutrients, and a support media (Campbell and Norman, 2013). The water retention capacity and the thermal behavior of a green roof strongly depend on the physical properties of the substrate, i.e., volumetric water content, bulk density, particle size distribution, mineralogical composition and texture of the soil (Assouline and Or, 2013; Charpentier, 2015). The heat flux across a green roof and the substrates moisture content.
(15) 5. influence the heat gains and losses of buildings through the roof, which impacts the building energy consumption. Additionally, controlling the moisture content of the substrate is key for vegetation survival, especially in arid and semi-arid climates. Hence, to improve the overall performance of green roofs, it is important to characterize the physical, hydrodynamic and thermal properties of green roof substrates. Many investigations have highlighted the importance of the substrate hydrodynamic properties, such as the water retention and hydraulic conductivity curves, on green roof behavior (Palla et al., 2009; Getter et al., 2011) but few have independently measured these properties (Charpentier, 2015; Brunetti et al., 2016), which are important to understand how water flows through the green roof substrate. Some studies have used hydrodynamic parameters from the literature to represent the water flow through the substrate (Hilten et al., 2008; Metselaar, 2012), while many have performed inverse modeling to estimate those parameters (Palla et al., 2009, 2011; Alfredo et al., 2010; Burszta-Adamiak and Mrowiec 2013; Li and Babcock, 2015). Remarkably, most of these studies have focused on the hydraulic behavior without taking into account the thermal performance of green roof substrates. Although most investigations addressing thermal performance of green roofs consider the effects of moisture on the thermal properties of the substrate, they typically neglect the impact of water flow on the energy balance (Sailor, 2008; Sailor and Hagos, 2011). Sailor (2008) developed a model that simulates the heat fluxes within the substrate, including the energy exchange in the atmosphere-vegetation-substrate continuum. It was included in the simulation software EnergyPlus (U.S. DOE, 2016), a simulation tool widely used by practitioners to model energy consumption in buildings (Yaghoobian and Srebic, 2015; Silva et al., 2016). Though Sailor’s model (2008) assumes that thermal properties depend on the substrate moisture, it considers that moisture within the green roof diffuses at a constant rate. Jaffal et al. (2012) developed another thermal model with similar assumptions than those of Sailor’s model, while Sailor and Hagos (2011) and Zhao et al. (2014) included the effect of compaction on the thermal properties of the substrate. The assumption of constant moisture diffusion can seriously impair model estimations since the interplay between vegetation water.
(16) 6. demands, time dependent atmospheric conditions, and the building internal temperature dynamics can introduce abrupt spatial and temporal changes in the moisture profile across the substrate. For this reason, the latest version of the EnergyPlus (U.S. DOE, 2016) software includes an advanced moisture diffusion calculation method. This moisture diffusion model is based on a solution of the Richards (1931) equation that uses the substrate hydrodynamic properties (Schaap and van Genuchten, 2006) to describe moisture transport within a green roof substrate. Nonetheless, this advanced model neglects the impact of water flow on the energy balance, only considering the effect of moisture on the substrate thermal properties. Few studies have assessed the interactions between water and heat transport in green roof substrates (Charpentier, 2015; Sandoval et al., 2015). Charpentier (2015) measured the water retention properties of pozzolan and peat soils mixtures using a sand-suction table and a ceramic pressure plate (Klute, 1994), while the thermal properties of the substrate were estimated from the literature. Charpentier (2015) simulated water and heat fluxes using HYDRUS-2D (Šimůnek et al., 2016) and found that the thermal performance of green roofs was driven by the substrate water storage capacity. Sandoval et al. (2015) measured the hydraulic and thermal properties of different substrates and utilized HYDRUS-1D (Šimůnek et. al., 2006) to represent the water and thermal transport properties of a green roof. However, these studies did not include irrigation and/or drainage of the green roof when studying the thermal behavior of their system. The general objective of this work is to investigate how the hydrodynamic and thermal properties of substrates influence the water and heat transport in green roof substrates considering all the water flow mechanisms found in green roofs. The specific objectives are: 1) to characterize a set of five organic (> 4% of organic matter) and mineral (< 4% of organic matter) green roof substrates in terms of their hydrodynamic and thermal properties: water retention curve, hydraulic conductivity curve, thermal conductivity, and specific heat capacity. The substrates were chosen due to their common use in green roofs (Pianella et al., 2016; Zhao et al., 2014) and their local availability; and 2) to evaluate the impacts of the previous properties on the water and.
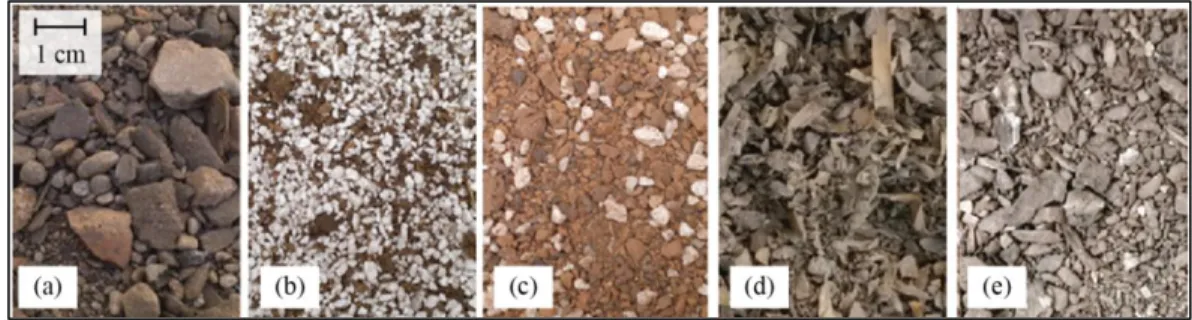
(17) 7. heat transport through green roof substrates using numerical simulations and including the effect of irrigation or drainage.. 2.3. Materials and methods. In this section we describe the theory used to model the coupled water and heat transport, the green roof substrates selected for this study, and the methods used to determine the physical, hydrodynamic and thermal properties of the substrates. 2.3.1 Modeling coupled water and heat transport The water flow in a green roof substrate was described using the classical Richards (1931) equation in a two-dimensional domain for a porous medium:. h h K K 1 t x x z z . (2.1). where θ is the volumetric water content; K() is the hydraulic conductivity curve, i.e., the ease with which the water moves through the porous medium; h is the pressure head; x and z are the horizontal and vertical spatial coordinates, respectively; and t is the time. The water retention curve, h(), and the hydraulic conductivity, K(), are two key properties that control water flow in a variably saturated media (Campbell and Norman, 2013), and are needed to solve equation (2.1). The water retention curve is a relationship between the pressure head, h, and the volumetric water content, . It is an important property of green roof substrates as it represents the capacity of the substrate to retain water. Substrates with larger water retention improves water use when irrigating green roofs and provides a moisture content more uniform for the vegetation. Thus, they contribute to vegetation development and survival, which is a critical aspect in post-plantation stages particularly.
(18) 8. for arid and semi-arid climates (Vera et al., 2015). In this study, h() was described using the van Genuchten (1980) model:. Se . r 1 s r 1 h n. . . m. (2.2). where Se is the effective saturation; θr, and θs are the residual and saturated volumetric water contents, respectively; α is the inverse of the air-entry pressure; and n and m are empirical parameters. The K() was estimated using the van Genuchten-Mualem model with m = 1–1/n (Mualem, 1976. . . K K S Sel 1 1 Se1 m. . m 2. (2.3). where KS is the saturated hydraulic conductivity, and l is the pore-connectivity parameter which is typically assumed to be 0.5 (Mualem, 1976). The heat flow in a porous medium was described using the energy conservation principle (Saito et al., 2006):. C p . T T T T T Cwqlx Cwqlz t x x z z x z. (2.4). where Cp(), and Cw are the volumetric heat capacities of the moist soil and water, respectively; T is the temperature; qlx and qlz are the liquid flux density in the horizontal and vertical directions, respectively; and λ(θ) is the soil apparent thermal conductivity, defined by (Jury and Horton, 2004):.
(19) 9. 0 t Cw ql. (2.5). where βt is the thermal dispersivity; ql is the magnitude of the liquid flux density; and λ0(θ) is the thermal conductivity in absence of fluid flow. The λ0(θ) was represented using the Chung and Horton (1987) model:. 0 b1 b2 b3 0.5. (2.6). in which b1, b2 and b3 are empirical parameters. 2.3.2 Green roof substrates The substrates investigated in this study are portrayed in Figure 2-1. The S1 substrate is similar to a sandy loam soil; the S2 substrate is comprised by perlite and peat; the S3 substrate has crushed bricks (clay); the S4 substrate is a mineral soil with tree leaves; and the S5 substrate is a mixture of topsoil and a mineral soil. These substrates were elected because of their common use in green roofs (S1-S3) and their local availability (S4 and S5). For instance, the S1 substrate has a mixture of sand and ~10% of compost that are known to increase the water holding capacity (Fassman-Beck et al., 2015). Substrates S1 and S3 have more than 80% of sand, which prevents the reduction of the saturated hydraulic conductivity with compaction (Fassman-Beck et al., 2015). The use of perlite (S2) in green roofs was analyzed by Zhao et al. (2014), while crushed bricks (S3) have been studied by Pianella et al. (2016) due to their high porosity and lightness..
(20) 10. Figure 2-1:Substrates used in this study: (a) substrate S1; (b) substrate S2; (c) substrate S3; (d) substrate S4; and (e) substrate S5.. 2.3.3 Physical, hydrodynamic and thermal properties of green roof substrates. a). Physical properties. The particle size distribution of the substrates was determined by sieving and hydrometer techniques (ASTM D422-63; Klute, 1994), and was used to calculate the texture, and the uniformity (Cu) and curvature (Cc) coefficients (Klute, 1994). The soil particle density (ρs) was estimated using the pycnometer technique (ASTM D 854-91; Klute, 1994) and the maximum soil density (ρmsx) was measured using the Proctor compaction test (ASTM D1557-09). b). Hydrodynamic properties. The water retention curve, h(), of each substrate was measured using the simplified evaporation method (Schindler, 1980). A substrate sample is subjected to evaporation under laboratory ambient conditions (average temperature of 22 5 °C), while the water tension and the sample weight are recorded. The water retention curve between 0 and 1 bar is built using the relationship between the sample weight and the volumetric water content of the sample (Peters and Durner, 2006). We used the HYPROP® apparatus (UMS, Munich, Germany) to implement the evaporation method..
(21) 11. Substrate cores were inserted into 250 cm3 stainless-steel cylinders (8 cm diameter and 5 cm height) and then slowly saturated from the sample bottom by placing them in a water reservoir with a 4.9-cm depth. Two tensiometers were inserted at depths of 1.25 and 3.75 cm, and the bottom of the substrate core was sealed. Each substrate core was installed on top of the weighing plate of a 0.01-g precision balance. The tensioVIEW software (UMS, Munich, Germany) was utilized to fit the water retention curve parameters of the van Genuchten model (1980) to the experimental data. The van Genuchten-Mualem model (Mualem, 1976; van Genuchten, 1980) was used to estimate K() (equation (2.3)). This model requires knowing Ks, the water retention curve parameters, and the pore-connectivity parameter. Ks was determined using the KSAT system (UMS, Munich, Germany), which is a constant- or variablehead permeameter that uses the same substrate cores as the HYPROP® apparatus. We used the permeameter with a variable head, and the Darcy equation was used to determine the Ks (Darcy, 1856). c). Thermal properties. The substrates λ(θ) and Cp(θ) were obtained using a thermal properties analyzer (KD2 Pro, Decagon Devices, Pullman, WA) with a dual needle sensor (SH-1). The KD2 Pro system uses the dual-probe heat-pulse technique to determine the thermal properties (Bristow et al., 1994). In this technique, one of the needles has an internal heater that applies a heat pulse, while the other has a sensor that measures the thermal response of the media. This information is used to simultaneously estimate λ(θ) and Cp(θ) by solving the equation of radial heat conduction (Bristow et al., 1994). The thermal properties of the substrates were obtained for different volumetric water contents measured using the gravimetric method (Klute, 1994). All the substrate samples were carefully saturated from below, and once the samples were completely saturated, the thermal properties were measured in triplicate and the samples were weighed. These measures were repeated every 2-3 days while the substrate samples were dried naturally under the ambient conditions of a laboratory, until the samples were dry, i.e., after ~30 days. Then,.
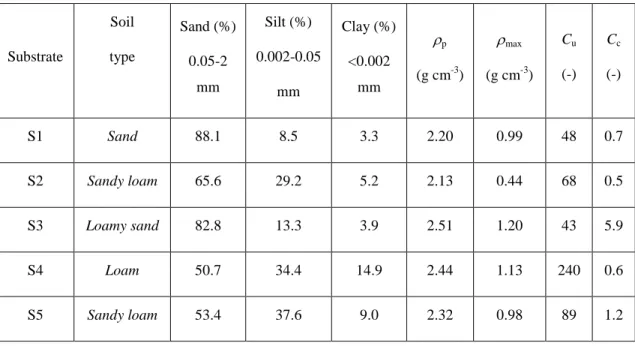
(22) 12. the samples were oven dried at ~80 °C (to avoid burning the organic matter) and weighed.. 2.4. Results and discussion. 2.4.1 Physical, hydrodynamic and thermal properties of substrates a). Physical properties. Table 2-1 shows the physical parameters obtained for each substrate. In all the substrates, the majority of the particles correspond to sand (0.05-2 mm), followed by silt (0.002-0.05 mm) and then by clay (< 0.002 mm). According to the USDA, these substrates can be classified as sand, loam, sandy loam and loamy sand. The substrates particle densities (p) range between 2.13 and 2.51 g cm-3, which are slightly less than natural minerals such as quartz (2.66 g cm-3) and larger than organic matter (1.3 g cm-3) (Balland and Arp, 2005). In addition, these values are similar to the ones found by Liu and Fassman-Beck (2016) in green roof substrates, with minimum values near to 2.21 g cm-3. The observed maximum substrate bulk densities (max) range between 0.44 and 1.20 g cm-3. These values are lower than those of natural soils, which typically range between 1.2-1.6 g cm-3 (Assouline, 2006a). However, green roof substrates bulk density values below 1 g cm-3 have been reported in the literature (Sailor and Hagos, 2011; Fassman-Beck et al., 2015; Liu and Fassman-Beck, 2016). The lower densities of the substrates compared to natural soils, are due to the addition of organic matter, tree leaves, wood and perlite, which are lightweight components commonly used in green roofs (Raimondo, 2015) that provide a large water storage volume (Li and Babcock, 2015). The organic compounds are also needed for the delivery of nutrients for plant growth. The lightness of the substrates is important to reduce loads in green roof infrastructure. International guidelines suggest the use of more than 80% of inorganic components to reduce infrastructure loads (FLL, 2002; DDC, 2007). In addition, a lowdensity substrate allows a thicker substrate layer where a wide variety of vegetation can.
(23) 13. be planted (Vijayaraghavan, 2016). The large values of the uniformity coefficient Cu (between 43 and 240) indicate that the particle size distributions of all the substrates are highly heterogeneous. The Cu values are higher than the ones obtained by other green roof substrate (Liu and Fassman-Beck, 2016). According to the USDA, the S5 substrate can be classified as a well-graded soil (Klute, 1994), as opposed to the S1-S4 substrates that present curves that do not meet with that criteria.. Table 2-1: Texture according to the USDA soil classification system, soil particle density (s), maximum density (max), uniformity coefficient (Cu) and curvature coefficient (Cc) of the substrates used in this study. Soil Substrate. type. Sand (%). Silt (%). 0.05-2. 0.002-0.05. <0.002. mm. mm. mm. Clay (%). p. max. Cu. Cc. (g cm-3). (g cm-3). (-). (-). S1. Sand. 88.1. 8.5. 3.3. 2.20. 0.99. 48. 0.7. S2. Sandy loam. 65.6. 29.2. 5.2. 2.13. 0.44. 68. 0.5. S3. Loamy sand. 82.8. 13.3. 3.9. 2.51. 1.20. 43. 5.9. S4. Loam. 50.7. 34.4. 14.9. 2.44. 1.13. 240. 0.6. S5. Sandy loam. 53.4. 37.6. 9.0. 2.32. 0.98. 89. 1.2.
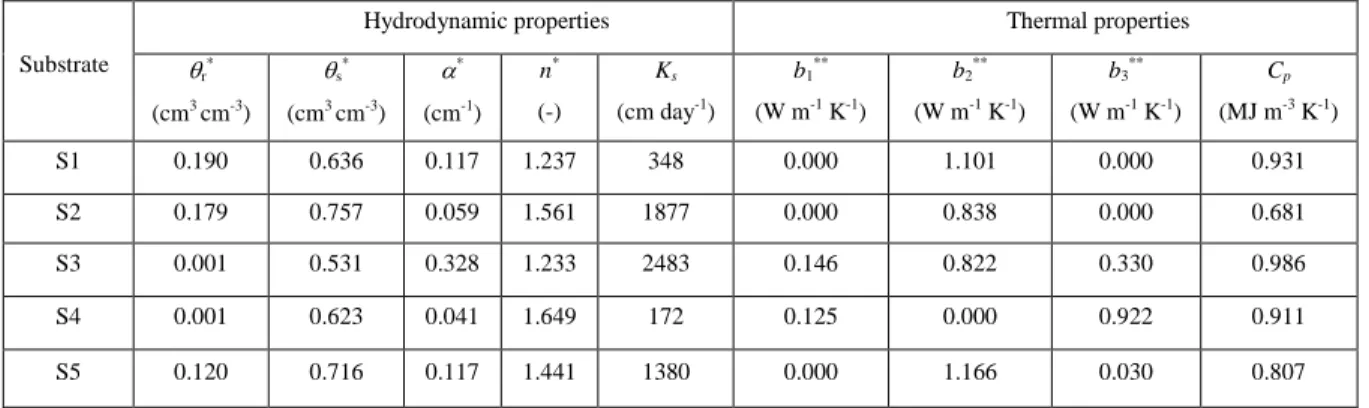
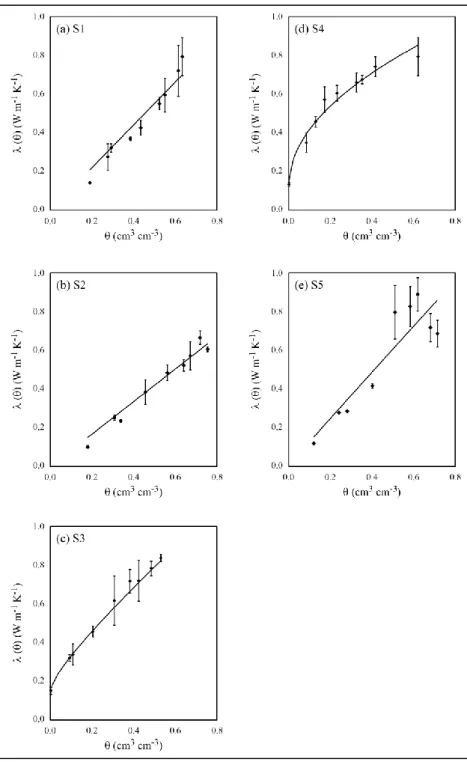
(24) 14. b). Hydrodynamic properties. Figure 2-2 and Table 2-2 show the water retention curves of the five substrates and the fitted parameters of the van Genuchten model (1980). On one hand, the residual water content of substrates S4 and S3 is very small compared to substrates S1, S2, and S5. On the other hand, the saturated water content of all the substrates (S1-S5) is very large, ranging between 0.531 and 0.757 cm3 cm-3, and exceeded that of natural soils (0.374-0.500 cm3 cm-3) (Twarakavi et al., 2010). Note that the difference between the saturated and residual water contents represents the maximum water storage volume that a substrate can retain. Indeed, in a storm event the actual water storage volume in a substrate is the difference between the saturated water content and the water content prior to the storm. This water storage volume provides a retention time that temporarily stores a fraction of the potential runoff generated by the surface and it can significantly mitigate stormwater quality problems associated to stormwater runoff of small storms (Pitt and Clark, 2008). Substrate S4 has the largest water storage volume (θs – θr = 0.62 cm3 cm-3), while substrate S1 has the smallest storage volume (0.45 cm3 cm-3). Other important parameter of the water retention curve is the air-entry pressure value hb = -1, which is the matric suction required for air to penetrate into the substrate when saturated. This property is important in green roof substrates because when drying conditions occur, substrates with larger values of hb will retain water for longer time periods. Substrates S2 and S4 had air-entry pressures larger than 16 cm, while the others had airentry pressure values lower than 9 cm..
(25) 15. Table 2-2. Hydrodynamic and thermal properties of the substrates. Hydrodynamic properties Substrate. r 3. *. . * -3. . * s. 3. *. -3. -1. n. *. Thermal properties Ks. **. b1. b2. **. b3**. Cp. (cm day-1). (W m-1 K-1). (W m-1 K-1). (W m-1 K-1). (MJ m-3 K-1). (cm cm ). (cm cm ). (cm ). (-). S1. 0.190. 0.636. 0.117. 1.237. 348. 0.000. 1.101. 0.000. 0.931. S2. 0.179. 0.757. 0.059. 1.561. 1877. 0.000. 0.838. 0.000. 0.681. S3. 0.001. 0.531. 0.328. 1.233. 2483. 0.146. 0.822. 0.330. 0.986. S4. 0.001. 0.623. 0.041. 1.649. 172. 0.125. 0.000. 0.922. 0.911. S5. 0.120. 0.716. 0.117. 1.441. 1380. 0.000. 1.166. 0.030. 0.807. Parameters of the van Genuchten (1980) model for the water retention curve.. **. Parameters of the Chung and Horton (1987) model for thermal conductivity.. According to the USDA classification, all the substrates studied in this work have hb values within the typical range for sandy loams (30.2 cm), sands (15.98 cm), and loamy sands (20.58 cm) (Rawls et al., 1982). In general, Ks values of the substrates ranging between 172 and 2483 cm day-1 (Table 2-2) are similar to those reported in the literature for other substrates used in green roofs (Li and Babcock, 2015). Substrates S1 and S4 have Ks values that are one order of magnitude smaller than the minimum values of Ks presented by Liu and Fassman-Beck (2016). The Ks value of S1 is on the same order than the USDA classification of natural soils (504 cm day-1); however, S2 and S5 are two orders of magnitude larger than the corresponding values for sandy loams (62 cm day-1). The Ks of S3 is also two orders larger than loamy sands (147 cm day-1), while the Ks of S4 is one order of magnitude larger than loams (32 cm day-1) (Rawls et al., 1982). Large values of Ks favor faster flows through the saturated substrate and thus the potential to mitigate storm-water runoff reduces under saturated conditions, unless a thicker substrate layer is used, as in the case of intensive green roofs (Vijayaraghavan, 2016)..
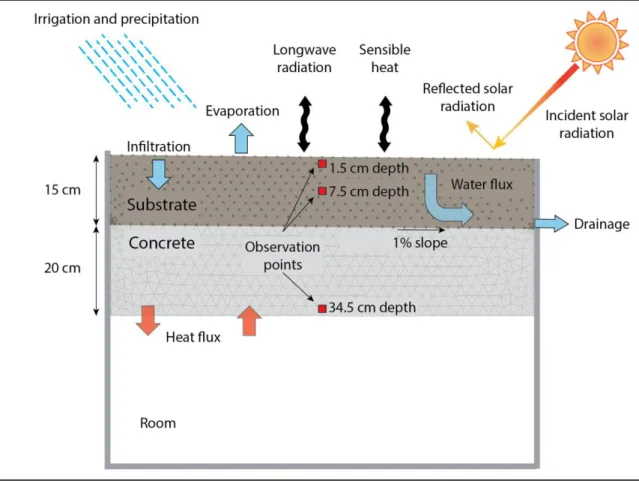
(26) 16. Figure 2-2: Water retention curves of substrates S1 (a), S2 (b), S3 (c), S4 (d), and S5 (e). Black diamonds are observations and solid lines are the modeled values..
(27) 17. c). Thermal properties Figure 2-3 and Table 2-2 show the thermal conductivities of the substrates. The. thermal conductivity values are similar to those of artificial substrates reported in the literature. Zhao et al. (2014) obtained thermal conductivity values between ~ 0.2 and ~1.4 W m-1 K-1 while Campbell and Norman (2013) reported values that ranged from ~0 to ~2.0 W m-1 K-1 for natural soils. The thermal conductivity of the substrates increases with moisture in different forms depending on the substrate. Such increase is linear with moisture, except for the S4 substrate. The linear increase in thermal conductivity occurs due to the organic nature of the substrates (Campbell and Norman, 2013). The thermal conductivity of substrates S3, S4 and S5 increases from ~0.1 to ~0.9 W m -1 K-1 for dry and saturated conditions, respectively; whereas the thermal conductivity of the S1 and S2 substrates ranges between ~0.2 and ~0.7 W m-1 K-1. Thus, the thermal conductivity value is 5-8 times that of the dry thermal conductivity. These variations are similar to those obtained by Sailor and Hagos (2011), although the substrates investigated in this study show a larger water storage capacity. The S4 substrate has the largest water storage capacity and the largest fluctuation in its thermal conductivity. Consequently, its hydraulic and thermal behavior is expected to be more variable..
(28) 18. Figure 2-3.Thermal conductivity curves for substrates S1 (a), S2 (b), S3 (c), S4 (d), and S5 (e). Black diamonds are observations and solid lines are the modeled values. The error bars correspond to the standard deviation of three thermal conductivity measurements at each moisture level..
(29) 19. The volumetric heat capacity values (Table 2-2) indicate that the S2 substrate in a dry state is inappropriate to store heat, i.e., its vertical heat diffusion is large compared to the rest of substrates. Although in many porous media the volumetric heat capacity increases with moisture (Jury and Horton, 2004), the substrates S1, S2 and S5 showed constant values of thermal diffusivity as moisture increased (data not shown). This behavior occurs due to the linear behavior of the thermal conductivity of these substrates (Figure 2-3). 2.4.2 Simulation of water and heat transport through green roof substrates To evaluate the impacts of the substrates physical, hydrodynamic and thermal properties on water and heat transport through green roof substrates, we performed numerical simulations of a hypothetical roof system comprised by a 15 cm height and 100 cm width substrate installed with a slope of 1% on top of a 20 cm thick concrete roof that is above a room. Figure 2-4 shows the conceptual model used to evaluate the impacts of the substrate properties on roof performance. This configuration replicates one of the available modules in the Laboratory of Vegetative Infrastructure of Buildings (LIVE for its acronym in Spanish) at Pontificia Universidad Católica de Chile. The LIVE is located in Santiago, Chile (33°26’S, 70°39’ W), in a region with a semi-arid climate (Reyes et al., 2016). We did not include the vegetation layer since we focused on isolating the differences between the hydraulic and thermal behaviors of substrates. Thus, we compared the hydraulic and thermal performance of the roof system when the different substrates (S1-S5) are used..
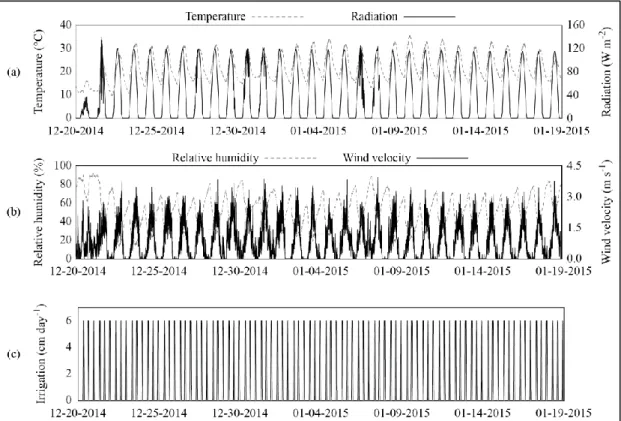
(30) 20. Figure 2-4.Green roof conceptual model used to run the numerical simulations. The numerical discretization used to solve the governing equations and the locations of observation points are also shown.. The coupled water and heat transport equations were solved using the HYDRUS2D software (Šimůnek et al., 2016). The hydrodynamic and thermal properties of each substrate were defined according to the experimental results presented above, while the hydrodynamic and thermal properties of concrete were obtained from the literature (Lamond and Pielert, 2006; Schneider et al., 2012). A uniform and arbitrary initial substrate water content of 0.3 cm-3 cm-3 was selected for the water flow simulations. Precipitation, irrigation and evaporation were used as the flow boundary conditions at the top of the substrate. We considered the meteorological data measured at LIVE during one of the summer months (Figure 2-5) to define the previous boundary conditions. The irrigation program considered 10 mm day-1 distributed in three pulses.
(31) 21. per day at 7 am, 2 pm, and 10 pm. The lateral boundary conditions were defined as impermeable walls, except in the zone where the drainage is located (Figure 2-5). This drainage was modeled using the seepage face boundary condition (Šimůnek et al., 2008), which assumes that there is no water flow as long as the pressure head is negative, and allows water to flow when the substrate becomes saturated. Under this last condition, atmospheric pressure is imposed at the boundary and the water flow is estimated using Darcy’s Law (1856). The interface between the concrete layer and the room (Figure 2-4) was modeled using a no-flow boundary condition. The cumulative water flow through the drain was used to compare the hydraulic performance of the different green roof substrates (S1-S5). The comparison was made by analyzing the breakthrough times (the first time when water exits from the drain), and the total volumes leaving the system. The initial condition for the heat transport simulations was a uniform temperature equal to 23 °C. At the top of the domain, the surface energy balance was used as boundary condition for the heat transport equation (Šimůnek et al., 2008):. Rn H Lv E G. (2.7). where Rn is the net radiation, H is the sensible heat flux, E is the evaporation rate and G is the soil heat flux. It is important to note that equation (2.7) couples the water flow and the heat transport through the evaporation term, LvE. Because HYDRUS-2D does not allow using the surface energy balance equation when coupling fluid flow and heat transport, we used the 1D version of the model, which does not have this limitation to solve equation (2.7) after assuming that evaporation is limited by the atmospheric conditions. Therefore, the resulting temperature at the top of the domain in the 1D simulations was used as the thermal boundary condition in the 2D simulations, and the evaporation rate –estimated with the soil resistance (Camillo and Gurney, 1986) and water vapor resistance (Campbell, 1985)– was used as the boundary condition for the water flow. Combining these boundary conditions ensures fulfilling the thermal surface energy balance. In each time-step, the validity of using the potential evaporation at the.
(32) 22. substrate-atmosphere interface was assessed by comparing the equilibrium conditions between the water in the substrate pores and the atmospheric water vapor. This validation was based on the method proposed by on by Philip and de Vries (1957), in which the minimum pressure head in the substrate surface that ensures potential evaporation, hA, is related to the air humidity, Hr, in the following way:. hA . RT ln H r Mg. (2.8). where R is the universal gas constant, T is absolute temperature, M is the molecular weight of water, and g is the gravitational acceleration. The lateral heat transport boundary conditions were defined as adiabatic. The thermal performance of the hypothetical roof system was assessed by assuming that the roof is over a single room that has adiabatic walls and floor, and determining the cumulative thermal energy (heating/cooling) required to maintain the room at a reference temperature Tref = 23 °C. This thermal energy was calculated by performing an energy balance considering the convective heat flux that occurs between the ceiling and the room. Thus, the thermal convection occurring inside the room is the result of a difference between the room’s bulk air temperature and the ceiling’s temperature (Causone et al., 2009). The convective heat flux was determined using equation (2.9) (Causone et al., 2009):. Q hc Tc Tref . (2.9). where Q correspond to the convective heat flux through the ceiling (per m2 of roof area), Tc is the temperature at the ceiling (i.e., at the bottom of the concrete layer), and hc is a convective heat transfer, which depends on the thermal stratification that occurs inside the room. When Tc Tref, buoyancy forces induce natural convection inside the room resulting in large values of hc; while when Tc Tref, low values of hc are expected.
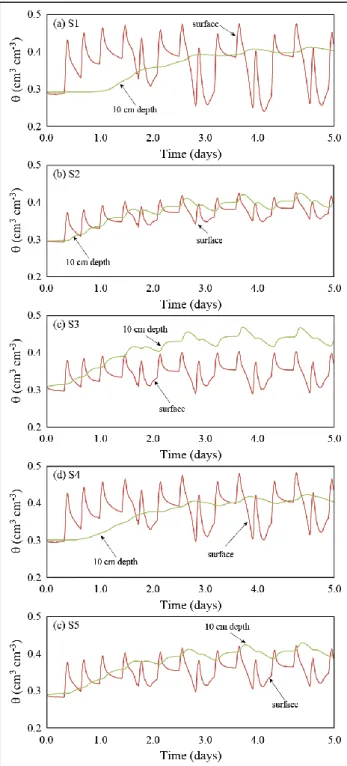
(33) 23. due to a stable thermal stratification within the room. We used heat transfer coefficients of 3.75 and 0.5 W m-2 °C-1 for Tc Tref and Tc Tref, respectively (Causone et al., 2009).. Figure 2-5: Meteorological and irrigation data used to drive the numerical simulations: (a) ambient temperature and solar radiation; (b) relative humidity and wind velocity; and (c) irrigation rate.. Figure 2-6 presents for each substrate the dynamics of the volumetric water content at the surface and at 10 cm below for the first five days of simulation. A daily cycle in all the substrates is observed, in which the water content increases after each irrigation and then decreases due to evaporation. Nevertheless, the same irrigation and meteorological conditions can produce different responses in each soil. For example, the substrates S1 and S4 present the larger moisture fluctuations at the substrate surface compared to the other substrates. In the second day of simulation, the surface moisture.
(34) 24. in substrate S1 quickly decreases to 0.25 cm3 cm-3, most likely due to the high nonlinearity of the water retention curve. At 10 cm depth, all the substrates present gradual moisture fluctuations with smaller amplitude than those occurring at the substrate surface. The moisture fluctuations during the first five days of simulation are mainly driven by irrigation and evaporation but not by drainage because the moisture content in all the substrates was less than saturation. The moisture of all substrates at 10 cm depth increases during the first five days of simulation. In addition, the amplitude of the moisture daily cycles is strongly related to the Ks. The S3 substrate presents the larger Ks and consequently, the larger daily variations of moisture at 10 cm depth. The moisture values during the first five days of simulation increase near to 0.4 cm3 cm-3 for all the substrates except for S3. The substrate S3 showed the highest moisture content at 10 cm depth, most likely due to the closeness of the initial water content to the saturation water content of this substrate (θs – θi = 0.23 cm3 cm-3), i.e., the S3 substrate saturates from the bottom before the rest of the substrates due to its smaller water retention capacity at low suctions (Figure 2-2c)..
(35) 25. Figure 2-6. Evolution of the volumetric water content at different depths during the first five days of simulation for substrates S1 (a), S2 (b), S3 (c), S4 (d), and S5 (e). The red line depicts the water content at the substrate surface and the green line represents the water content at 10 cm depth..
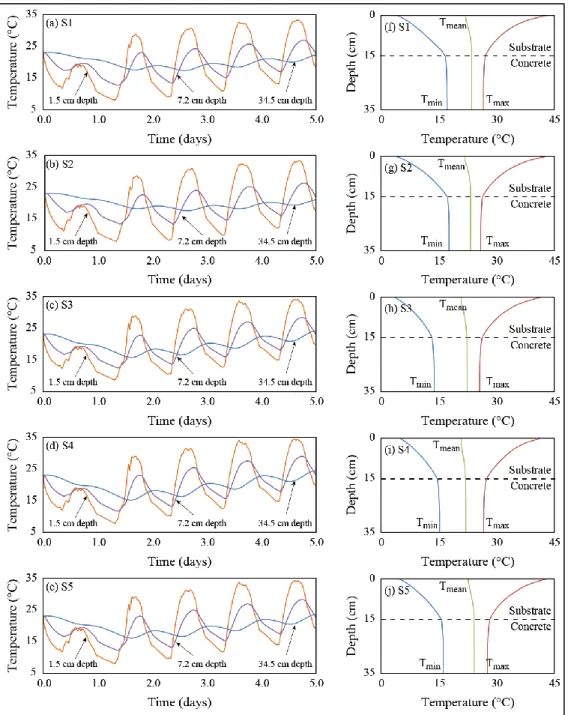
(36) 26. Figure 2-7 shows the cumulative water flux that exits from the bottom of each substrate throughout the simulations. The water breakthrough at the drainage occurs at 3.6 days for the substrate S3, while substrates S1 and S4 take almost 23 days to release water through the drainage. The substrate S5 drains water after 27 days of simulation and S2 does not drain water during the simulation period. The substrates hydrodynamic properties explain this behavior. The main hydrodynamic property influencing the breakthrough time is the saturated water content: smaller saturated water content implies shorter breakthrough times and greater cumulative water fluxes. In addition, the magnitude of the cumulative water fluxes also depends on the properties of the water retention curve and the atmospheric conditions, which can dry the substrates in different ways depending on the retention characteristics of each substrate.. Figure 2-7. Cumulative water flux exiting through the drain of the roof system during the 30 days of simulation. Substrates are subject to the environmental conditions and a daily irrigation of 10 mm.. Figure 2-8a-e present the thermal evolution during the first five days of simulation at 1.5, 7.5 (substrate) and 34.5 cm (concrete) depth below the surface (Figure 2-4 shows the location of these observation points). The maximum values of the daily temperatures at the atmosphere-substrate interface reach ~35°C during the first five days of simulation and increase to more than 40°C during the entire simulation. Minimum daily temperatures at the substrate surface are similar to the air temperature (Figure 2-5),.
(37) 27. except for the time between the first and the second day, when the temperatures at the substrate surface decline to ~5°C. The temperatures at the atmosphere-substrate interface of all the substrates are very similar. Figure 2-8f-j show the thermal envelope, i.e., the minimum and maximum temperatures at each depth within the roof system, using the different substrates for the 30 days of simulation. The minimum values are depicted in blue, the average values are represented in green, and the maximum values are shown in red. In general, the difference between the minimum and maximum temperatures at different depths reduces as depth increases. The magnitude of this difference is different for each substrate, showing the importance of the selection of the substrates. Note that this thermal amplitude should be reduced when adding the vegetation layer on top of the substrate (not analyzed here because it is out of the scope of this investigation). Our results show that the S1 and S2 substrates reduce more the thermal amplitude with depth than the rest of the substrates. The envelope of the S1 and S2 substrates is nearly symmetric, meaning that the thermal resistance of this substrate is similar for cooling or heating. At the surface of the S2 substrate a thermal amplitude of Ts = 38.8°C is observed, while the range of thermal oscillations at the bottom of the concrete is Tb = 9.5 °C. Note that the surface temperatures of S2 substrate oscillate the most of in response to the atmospheric conditions. However, the S2 substrate has a higher heat reduction capacity in the vertical direction trough the soil (77% amplitude reduction). In addition, the S2 substrate has the smallest variability at the bottom (Tb = 9.2°C). On the other hand, the S3 substrate has the highest thermal variability at the bottom (Tb = 11.9°C). The S4 substrate has the highest resistance to the atmospheric conditions (i.e., the smallest Ts); however, it has the lower amplitude reduction with depth (68%)..
(38) 28. Figure 2-8. (a)-(e) Modeled temperatures at different depths in the five substrates (1.5 and 7.2 cm depth) and modeled temperature near the bottom of the concrete slab (34.5 cm depth), during the first five days of simulation. (f)-(j) Average temperature profile (Tmean, green line) and temperature envelope in the roof system during the entire simulation. Maximum temperatures (Tmax) are depicted in red and minimum temperatures (Tmin) are displayed in blue..
(39) 29. The hydrodynamic properties also impact the heat flux trough the substrate and concrete. Therefore, by analyzing the average values of humidity and thermal properties of the substrate composition, the processes related to heat and water flow can be better understood. The average values through the 30 days of simulation at 0.5 cm depth show that the substrates with more air and porosity behave very differently. The S4 substrate has an average moisture of 0.48 cm3 cm-3, with a thermal conductivity of 0.76 W m-1 K1. , a volumetric heat capacity of 2.33 MJ m-3K-1 and a thermal diffusivity of 0.327 mm2 s-. 1. . The percentage of the solid material in the substrate is 38% and the percentage of air is. 14%. On the other hand, the S2 substrate has an average moisture of 0.44 cm 3 cm-3, with a thermal conductivity of 0.44 W m-1 K-1, a volumetric heat capacity of 2.02 MJ m-3 K-1, and a thermal diffusivity of 0.217 mm2 s-1. The percentage of the solid matrix in this substrate is 25% and the air percentage is 31%. Hence, the S4 substrate has less air and more water and solid matrix than the S2 substrate, and thus conducts more heat. On the other hand, the S2 substrate has a lower diffusion than S4. The S2 substrate presents large differences in volumetric heat capacity depending on its moisture state; note that the dry soil value, 0.682 MJ m-3 K-1 increases to 2.016 MJ m-3 K-1 for a volumetric water content of 44.3% and a volumetric air content of 31.5%, highlighting the importance of the volumetric water and air contents on the thermal properties..
(40) 30. Figure 2-9. (a) Heating cumulative thermal energy required to maintain a reference room temperature of 23°C below the roof system. (b) Cooling cumulative thermal energy required to maintain a reference room temperature of 23°C below the roof system. (c) Modeled temperatures at 35 cm depth (bottom of the concrete) throughout the 30 days of simulation..
(41) 31. Figure 2-9a-b show the cumulative thermal energy (heating and cooling) consumed to maintain 23°C in the room below the roof system for the 30 days of simulation. As the convective heat flux depends on the ceiling temperatures, Figure 2-9c presents the thermal evolution at the bottom of the concrete layer of the roof system. During the first five days the ambient is cooler than the room and thus the room needs to be heated. Because the convective heat flux when Tc Tref is larger than when Tc Tref – due to natural convection driven by buoyancy (Causone et al., 2009), more thermal energy is needed to keep the room at the reference temperature (compared to the situation when Tc Tref, where a stable thermal stratification occurs in the room). After five days, the ambient temperature increases and thermal energy is now required to cool the room. The range of energy consumption for heating varied between 1.60 and 1.92 kWh m-2, with the substrate S3 being the one that consumed less energy, and the substrates S1, S2 and S5 the ones that resulted in the highest energy consumption for heating. For cooling conditions, the energy consumption varied between 0.34 and 0.65 kWh m-2, with the substrate S2 being the one that consumed less energy for cooling, and the substrates S3 and S4 had the highest cooling thermal energy consumption. In these simulations, the thermal energy required for cooling was less than that required for heating because the warmer temperatures simulated at the ceiling were ~3°C larger than Tref, while the cooler temperatures were ~6°C cooler than Tref. The results of this investigation show that the S2 substrate is the one with the best capacity to store water. No water draining from S2 was simulated because of its large water storage capacity, due mainly to its large saturated water content. In terms of cumulative thermal energy, the substrate S2 decreases the cumulative thermal energy for cooling but increases the thermal energy for heating. The substrate S2 presents a low thermal conductivity and a large pore space. Hence, in dry conditions, the substrate S2 has an important fraction of air –and a low fraction of soil– within the pores, which reduces its thermal conductivity. In wet conditions the pores will be filled with water, which has a large volumetric heat capacity that reduces thermal diffusion within the roof. However, this last point could increase the energy consumption in winter.
(42) 32. (Charpentier, 2015). These results suggest that the thermal behavior of a green roof substrate not only depends on its thermal properties but also on its hydrodynamic properties. Hence, the water/heat coupling must be accounted for when defining the substrate to be used in a green roof. Although this study focuses on the hydraulic and thermal performance of green roof substrates, it is important to understand that some of the results presented here will change when a vegetation layer is added to a green roof. In this case, root water uptake will take place throughout the substrate profile according to the vertical root distribution, as opposed to what was modeled in our simulations where evaporation occurs at the substrate surface. Therefore, the moisture at the substrate surface will present less extreme values than those presented in this investigation (Figure 2-6). In addition, the vegetated green roof should dry less and slower than a non-vegetated roof, in a similar way than that described by Brunetti et al. (2016). Furthermore, since the evapotranspiration rate depends on the total plant resistance of each vegetation type (Campbell and Norman, 2013), it is likely that root water uptake will be smaller than the potential evapotranspiration rate that was used in this investigation. As a consequence, the suction within the substrate will be reduced and the average moisture level will increase. This increase in moisture content also increases the thermal conductivity of all the substrates (Figure 2-3). Nonetheless, it is expected that the thermal conductivity of the substrate S2 will remain smaller than that of the rest of the substrates. Also, when a vegetation layer is added to the roof, it is also expected to have lower temperatures at the substrate surface compared to those presented in this study (Figures 8a-e). These lower temperatures will be the result of the shadow made by leaves of the plants (e.g., see Getter et al., 2011).. 2.5. Conclusions. In this study, the physical, hydrodynamic and thermal properties of five green roof substrates were determined experimentally and then used to understand their impact on the performance of a hypothetical roof system by means of numerical simulations..
(43) 33. All the substrates have large hydraulic conductivity values, which promotes water transmission through the green roof under saturated conditions. Nonetheless under unsaturated conditions, in addition to the substrate volume storage, the response of the roof to the atmospheric forcing is strongly dependent on the substrate water retention characteristics. The thermal conductivity of the substrates under investigation were on the same order of magnitude than those of other substrates reported in the literature, showing an important increase in the thermal conductivity as moisture increases. The heat transport trough the substrates strongly depends on the fraction of water, air and solid particles within the substrate, and the large water storage volume allows the attenuation of the diurnal thermal signal at the lowest boundary of the roof. We found that the S2 substrate is the one with the best capacity to store water and to reduce storm-water runoff. In terms of cumulative thermal energy, the substrate S2 decreases the cumulative thermal energy for cooling but increases the thermal energy for heating. It presents a low thermal conductivity and a large pore space, which results in low thermal conductivity values for dry conditions. Nonetheless, under wet conditions its volumetric heat capacity reduces thermal diffusion within the substrate, which could increase energy consumption in winter. Our results showed that the behavior of the hypothetical roof system strongly depends on its hydrodynamic and thermal properties, and highlight the importance of using dynamic modeling for design because of the complex interactions between the hydraulic and thermal processes that occur in green roof substrates. Future research should focus on studying the coupled partially saturated water flow and heat transport when the vegetation layer is added to the green roof..
(44) 34. 3. A NEW METHOD TO DETERMINE HOW COMPACTION AFFECTS WATER. AND. HEAT. TRANSPORT. IN. POROUS. MEDIA. –. APPLICATION TO GREEN ROOF SUBSTRATES 3.1. Abstract. Although compaction affects the processes related to water and heat transport in porous media, there is a lack of investigations that deal with the effect of compaction on the coupled water and heat fluxes. Substrates are artificial porous media that are used for engineering and technological purposes. In this investigation, we studied the effect of compaction on the characterization of physical, hydrodynamic and thermal properties of five green roof substrates (S1-S5). The methodology of substrate compaction consists in a parametric analysis that uses the properties of a substrate with known bulk density, and then modifies the substrate properties to take into account how compaction affects water and heat fluxes. The substrate hydrodynamic properties in a compacted state show how the media’s pore-size decreases, increasing the capillary forces and reducing the water storage volume. The impact of compaction on the thermal properties of the five green roof substrates agrees with the behavior reported in the literature for compaction in natural soils, even when the substrates are artificial media. The thermal conductivity in a compacted state shows a general increase compared to the uncompacted state. We performed coupled heat and water transport numerical simulations to assess the impact of the changes in the previous properties on the hydraulic and thermal performance of a hypothetical roof system. Results show that the S2 substrate presents the smallest vertical diffusion, which reduces the heat flux through the roof system. Only numerical simulations demonstrate the complexity of the behavior of each substrate and their response as compaction occurs when atmospheric conditions drive this system.. Keywords: green roof substrate, soil compaction, hydraulic properties, thermal conductivity, coupled water and heat flow, urban sustainability.
(45) 35. 3.2. Introduction. Soil compaction plays a key role in solute transport, nutrient availability, crop productivity and water movement (Alaoui et al., 2011). The compaction of soils has been typically investigated without considering its impact on the coupled water and heat transport in porous media (Zhou et al., 2012; Charpentier, 2015). There are many investigations that deal with the impact of compaction on water fluxes (Aravena et al., 2013; Augeard et al., 2008; Alaoui et al., 2011), as well as many studies that investigate how compaction affects heat fluxes in soils (Sailor and Hagos, 2011; Zhao et al., 2014). Nonetheless, there is a lack of studies that have investigated the effect of compaction on the coupled water and heat transport in substrates. Substrates are engineered media that have improved performance compared to natural soils (Brown and Lundholm, 2015). They are typically used in many civil engineering applications. Their use in green roofs motivates this research because substrates provide water, nutrients and a support media for the vegetation (Campbell and Norman, 2013). Additionally, the water retention capacity and the thermal behavior of green roofs depend on the physical properties of the substrates (Sandoval et al., 2015).Therefore, to improve the overall performance of these systems is important to characterize the physical, hydrodynamic and thermal properties of green roof substrates and, in particular, the impact that substrate compaction has on water and heat transport in these systems. Water transport in porous media usually is represented using the Richards (1931) equation:. h h K K 1 t x x z z . (3.1). where θ is the volumetric water content; K() is the hydraulic conductivity curve; h is the pressure head; x and z are the horizontal and vertical spatial coordinates, respectively; and t is the time. The water retention curve, h(), and the hydraulic.
(46) 36. conductivity curve , K(), are two important properties that control water flow in a variably saturated media (Campbell and Norman, 2013), and are needed to solve equation (3.1). There are many expressions that can be used to represent the h() (Brooks and Corey, 1964; van Genuchten, 1980; Assouline et al., 1998). The most used equation to represent the h() is that proposed by van Genuchten (1980):. Se . r 1 s r 1 h n. . . (3.2). m. where Se is the effective saturation; θr, and θs are the residual and saturated volumetric water contents, respectively; α is the inverse of the air-entry pressure; and n and m are empirical parameters. Assouline et al. (1998) also proposed a water retention model that has been used to investigate the impact of compaction on both h() and K(); therefore, it is a relevant model for this investigation. The h() model proposed by Assouline et al. (1998) is given in equation (3.3):. . . . S e (h) 1 exp | h |1 | hL |1. . . . 0 h hL. (3.3). where and are two fitting parameters, and hL = 15 bar is the pressure head corresponding to a very low water content. It is also interesting to note that the parameters of the h() models of Assouline et al. (1998) and van Genuchten (1980) can be related using the following expressions:. = 0.51 n1.1. (3.4). = 1.21 1. (3.5). There are also many expression to represent the K(). The most used expression is the van Genuchten-Mualem model with m = 1–1/n (Mualem, 1976):.
(47) 37. . . K K S Sel 1 1 Se1 m. . m 2. (3.6). where KS is the saturated hydraulic conductivity, l is the pore-connectivity parameter which is typically assumed to be 0.5 (Mualem, 1976), and the Se is determined using the van Genuchten (1980) model. Assouline and Tartakovsky (2001), on the other hand, describes the K() using the following expression:. K K S. . . 1 1 1 , a h h 1 exp ah hL1 Se 1 1 1 hL1 . 2. . (3.7). where and are the incomplete and complete Gamma functions, respectively, and. . . . ah h 1 hL1 .. The heat flow in a porous medium has been typically described using the energy equation (Saito et al., 2006):. C p . T T T T T Cwqlx Cwqlz t x x z z x z. (3.8). where Cp(), and Cw are the volumetric heat capacities of the moist media and water, respectively; T is the temperature; qlx and qlz are the liquid flux density in the horizontal and vertical directions, respectively; and λ(θ) is the porous media apparent thermal conductivity, defined by (Jury and Horton, 2004):. 0 t Cw ql. (3.9). where βt is the thermal dispersivity; ql is the magnitude of the liquid flux density; and λ0(θ) is the thermal conductivity in absence of fluid flow. The volumetric heat capacity.
Figure

+7

Documento similar
Global agricultural green and blue water Global agricultural green and blue water consumptive uses and virtual water trade consumptive uses and virtual water trade.. in the
• How does the global consumption of rice relate to the use of different kinds of water at production regions?. • What is the role of the blue (surface and ground) and green water
Proportion of green and blue water footprint (WF) in open-air irrigated systems and average apparent water productivity (WAP) of the main producing provinces under different
- The amount of noise that reaches the interior is reduced as the green roof creates a natural protection barrier against noise. This allows the roof to last much longer than if
In Europe, there are different classes of water intended for human consumption according to its origin: natural mineral water (NMW) and spring water (SW) which are bottled waters,
Li, Investigation on the flow and convective heat transfer characteristics of nanofluids in the plate heat exchanger, Experimental Thermal and Fluid Science 76
Here we are interested in the study of transport properties of liquid water which are in general difficult to model accurately, using molecular simulation for their prediction,
Among the many interesting properties of transport at the nanoscale, this the- sis considers in detail a number of problems posed by the production and control of charge and
