Study of the Differential Activity of Thrombin
Inhibitors Using Docking, QSAR, Molecular
Dynamics, and MM-GBSA
Karel Mena-Ulecia1,2, William Tiznado1, Julio Caballero2*
1Departamento de Química, Facultad de Ciencias Exactas, Universidad Andres Bello, Avenida República 252, Santiago, Chile,2Centro de Bioinformática y Simulación Molecular, Facultad de Ingeniería,
Universidad de Talca, 2 Norte 685, Casilla 721, Talca, Chile
*[email protected]@yahoo.com
Abstract
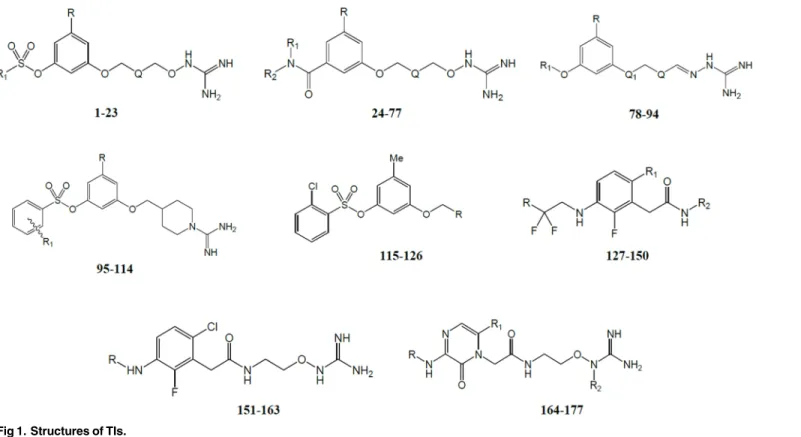
Non-peptidic thrombin inhibitors (TIs; 177 compounds) with diverse groups at motifs P1 (such as oxyguanidine, amidinohydrazone, amidine, amidinopiperidine), P2(such as cyano-fluorophenylacetamide, 2-(2-chloro-6-fluorophenyl)acetamide), and P3(such as pheny-lethyl, arylsulfonate groups) were studied using molecular modeling to analyze their interactions with S1, S2, and S3subsites of the thrombin binding site. Firstly, a protocol com-bining docking and three dimensional quantitative structure–activity relationship was per-formed. We described the orientations and preferred active conformations of the studied inhibitors, and derived a predictive CoMSIA model including steric, donor hydrogen bond, and acceptor hydrogen bond fields. Secondly, the dynamic behaviors of some selected TIs (compounds26,133,147,149,162, and177in this manuscript) that contain different molecular features and different activities were analyzed by creating the solvated models and using molecular dynamics (MD) simulations. We used the conformational structures derived from MD to accomplish binding free energetic calculations using MM-GBSA. With this analysis, we theorized about the effect of van der Waals contacts, electrostatic interac-tions and solvation in the potency of TIs. In general, the contents reported in this article help to understand the physical and chemical characteristics of thrombin-inhibitor complexes.
Introduction
Thromboembolic diseases are among the principal causes of mortality in the world. Vein thrombosis can progress to pulmonary embolism. These disorders, identified with the term venous thromboembolism (VTE), affect several million people around the world [1]. VTE is the third leading cause of cardiovascular-related death, after myocardial infarction and stroke [2].
The central role of the serine protease thrombin in thrombosis and haemostasis makes it an attractive target for antithrombotic therapy [3]. Thrombin catalyzes the conversion of soluble fibrinogen to insoluble fibrin in the clotting cascade, and also acts on other substrates such as
OPEN ACCESS
Citation:Mena-Ulecia K, Tiznado W, Caballero J (2015) Study of the Differential Activity of Thrombin Inhibitors Using Docking, QSAR, Molecular Dynamics, and MM-GBSA. PLoS ONE 10(11): e0142774. doi:10.1371/journal.pone.0142774
Editor:Freddie Salsbury, Jr, Wake Forest University, UNITED STATES
Received:June 2, 2015
Accepted:October 27, 2015
Published:November 24, 2015
Copyright:© 2015 Mena-Ulecia et al. This is an open access article distributed under the terms of the Creative Commons Attribution License, which permits unrestricted use, distribution, and reproduction in any medium, provided the original author and source are credited.
Data Availability Statement:All relevant data are within the paper and its Supporting Information files.
Funding:This work wassupported by the grant no. 1130141 (J.C.) from Fondecyt, Chile. The funders had no role in study design, data collection and analysis, decision to publish, orpreparation of the manuscript.
factor V, factor VIII, factor XI, and factor XIII. It is widely believed that an oral thrombin inhibitor (TI) could provide a new standard of care in anticoagulation therapy.
The discovery of small molecule TIs is an important goal for anti-thrombotic therapy [4]. In the last years, potent and selective inhibitors have been reported, such as pyridones, acet-amides, oxyguanidines, aminopiperidines, amidines, and amidinohydrazones [5–13]. These sets have shown that subtle structural differences in compounds (due to the presence of similar scaffolds or the same scaffolds with different substituents) can lead to big differences in their thrombin inhibitory activities.
The knowledge of the relevant structural features that positively influence the activity of TIs is important for the design of potent compounds. Molecular modeling has demonstrated to be a powerful support to investigate bioactive compounds and their structure-activity relationship (SAR) with the main purpose of identifying the molecular features that contribute to a high bioactivity. These methods have been applied for studying TIs. Several quantitative structure-activity relationship (QSAR) models were reported using approaches such as classic QSAR [14], CoMFA/CoMSIA [15,16], topological descriptors [17], and artificial neural networks [18]. Other reports used docking and molecular dynamics (MD) simulations to study struc-tural features of several TIs identified wit a high activity [19–21]. In general, these reports do not include an analysis of the interactions between inhibitors and different subsites of the thrombin binding site. An exception is the work of Nilsson et al. [22]. These authors designed a set of compounds to bind to the S2and S3subsites with no interactions in S1, and developed a
classic QSAR model to study the chemical features that are important for the prediction of their binding constants. Other exception is the work of Bhunia et al. [23], which used three dimensional (3D) QSAR and MD simulations to profile structural determinants for the selec-tivity of representative diverse classes of thrombin-selective inhibitors.
In the current work, we applied some of the popular molecular modeling methods to study the interactions of TIs with S1, S2, and S3subsites of the thrombin binding site. We studied the
orientations and SAR for 177 TIs by using a protocol that includes docking and the 3D-QSAR method CoMSIA. Additionally, we analyzed the dynamical behavior for some selected com-pounds (26,133,147,149,162, and177) by using MD and free energy calculations. By means of a comparison of the selected systems, we gained further insight into the role played by differ-ent TI molecular constitudiffer-ents in the binding affinities due to interactions with differdiffer-ent subsites in the thrombin active site.
Materials and Methods
Data set
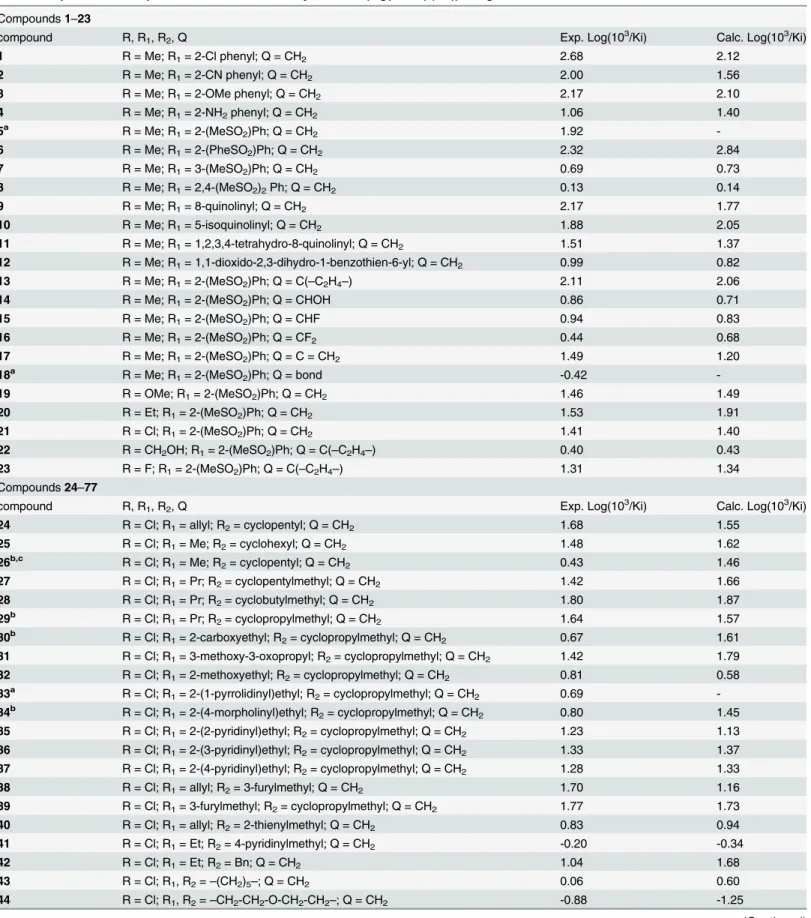
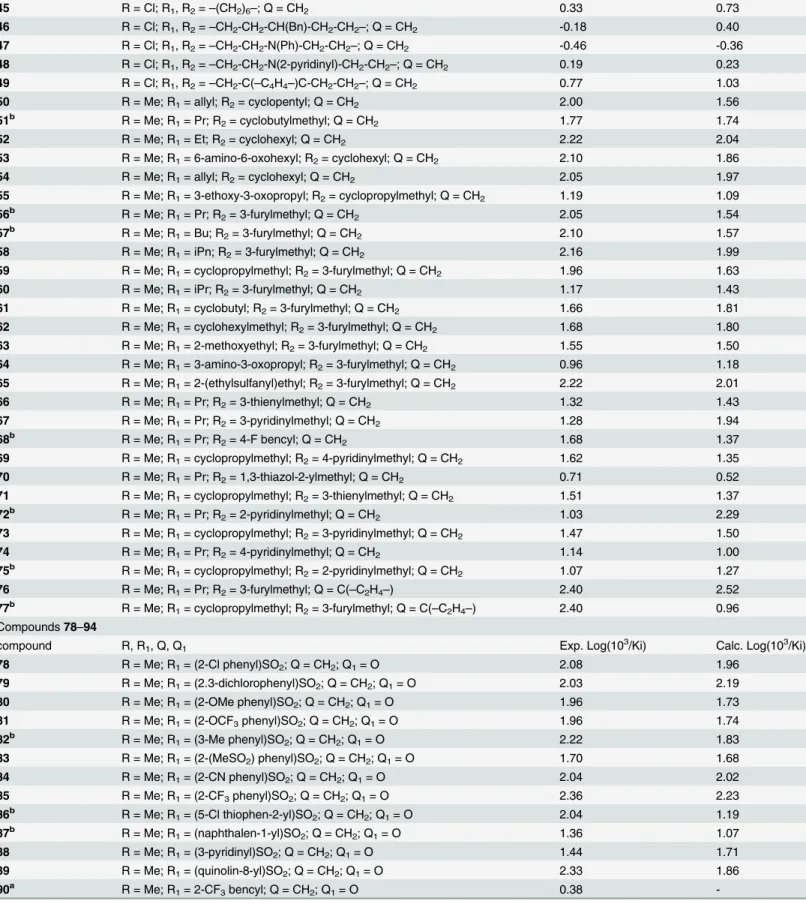
The primary structures and activities of 177 TIs were taken from the literature [5–13]. Inhibi-tory activities were collected and transformed into log(103/Ki) values. Ki values are in nM and represent the enzyme inhibition constants. TI structures are inFig 1and their biological activi-ties used in this study are summarized inTable 1. The chemical structures were sketched using the molecular editor of Maestro 9.0 software suite [24].
Docking
completed using the Protein Wizard Preparation module also available in Maestro software. A grid box of 30Å × 30Å × 30Å was centered on the center of mass of the inhibitor in this crystal structure. The module LigPrep 2.4 [29] was used to assign ionization states, stereochemistries, and ring conformations of the ligands. Docking parameters were used as in previous works [30], Glide standard (SP) and extra-precision (XP) modes were used. The better docking poses for each ligand were examined according to their relative total energy scores. Among docking poses, the more energetically favorable conformation was selected by considering the total energy value.
CoMSIA calculations
Compound structures and inhibitory activities as log(103/Ki) values were considered for CoM-SIA calculations. The relative alignment of the compounds to set field calculations was inside the binding site. For this, the 3D conformations previously obtained by docking simulations were used. QSAR modeling was performed using the Sybyl 7.3 software of Tripos [31]. The data set was divided into two sub data sets (143 and 34 compounds were in training and test sets respectively) for external validation process. The molecules contained in the training set were placed in a rectangular grid extended beyond 4 Å in each direction from the more external coordinates of each molecule. The interaction energies between a hypothetical atom (a sp3 hybridized carbon atom with +1 charge) and all compounds were computed at the defined points, using a volume-dependent lattice with 2.0 Å grid spacing. Then, partial least squares (PLS) method was applied using standard Sybyl parameters, and considering an optimal num-ber of components determined by optimization of leave-one-out (LOO) cross-validation Q2 value (using SAMPLS [32] sampling method). Similarity was expressed in terms of steric Fig 1. Structures of TIs.
Table 1. Experimental and predicted thrombin inhibitory activities (log(103/Ki) (nM)) using CoMSIA-SDA model.
11 R = Me; R1= 1,2,3,4-tetrahydro-8-quinolinyl; Q = CH2 1.51 1.37
12 R = Me; R1= 1,1-dioxido-2,3-dihydro-1-benzothien-6-yl; Q = CH2 0.99 0.82
13 R = Me; R1= 2-(MeSO2)Ph; Q = C(–C2H4–) 2.11 2.06
31 R = Cl; R1= 3-methoxy-3-oxopropyl; R2= cyclopropylmethyl; Q = CH2 1.42 1.79
Table 1. (Continued)
compound R Exp. Log(103/Ki) Calc. Log(103/Ki)
115 R = 3-amino-3-iminopropyl 0.34 0.73
116 R = 5-amino-5-iminopentyl 1.16 0.94
117 R = 4-[amino(imino)methyl]cyclohexyl -0.32 0.27
118b R = 4-[amino(imino)methyl]phenyl 0.96 0.54
119 R = 3-[amino(imino)methyl]phenyl 1.00 0.77
120 R = 1-ethanimidoyl-4-piperidinyl -0.11 0.85
121 R = [methyl(4-pyridinyl)amino]methyl 1.96 2.27
122b R = 1-[amino(imino)methyl]-4-piperidinyl 2.34 1.09
123b R = 1-[amino(imino)methyl]-3-piperidinyl 0.50 0.03
124 R = 3-{[amino(imino)methyl]amino}ethyl 1.48 1.23
125b R = 3-{[amino(imino)methyl]amino}propyl 1.89 1.45
126 R = 3-{[amino(imino)methyl]amino}butyl 0.59 0.41
Compounds127–150
compound R. R1. R2 Exp. Log(103/Ki) Calc. Log(103/Ki)
127 R = phenyl; R1= CN; R2= 2-guanidinooxy-ethyl 2.64 3.10
128 R = pyridin-2-yl; R1= CN; R2= 2-guanidinooxy-ethyl 2.92 3.34
129 R = 3-methylpyridin-2-yl; R1= CN; R2= 2-guanidinooxy-ethyl 2.00 2.45
130 R = 4-methylpyridin-2-yl; R1= CN; R2= 2-guanidinooxy-ethyl 2.54 2.67
131 R = 5-methylpyridin-2-yl; R1= CN; R2= 2-guanidinooxy-ethyl 2.92 2.71
132 R = 6-methylpyridin-2-yl; R1= CN; R2= 2-guanidinooxy-ethyl 3.10 2.43
Table 1. (Continued)
133c R = 5-Cl-pyridin-2-yl; R
1= CN; R2= 2-guanidinooxy-ethyl 3.24 3.35
134 R = 8-quinolyl; R1= CN; R2= 2-guanidinooxy-ethyl 3.42 2.96
135 R = 3-Cl-phenyl; R1= CN; R2= 2-guanidinooxy-ethyl 2.77 2.73
136 R = 3-F-phenyl; R1= CN; R2= 2-guanidinooxy-ethyl 2.50 2.46
137b R = 3.4-diF-phenyl; R
1= CN; R2= 2-guanidinooxy-ethyl 2.75 3.43
138 R = 2-SO2Me-phenyl; R1= CN; R2= 2-guanidinooxy-ethyl 3.19 2.94
139b R = 1-oxy-2-pyridyl; R1= CN; R2= 2-guanidinooxy-ethyl 2.89 3.29
140a R = 5-Cl-1-oxy-2-pyridyl; R
1= CN; R2= 2-guanidinooxy-ethyl 3.18
-141 R = pyridin-2-yl; R1= CN; R2= 2-methylguanidinooxy-ethyl 2.05 1.71
142 R = pyridin-2-yl; R1= CN; R2= (6-aminopyridin-3-yl)methyl 1.96 2.30
143 R = pyridin-2-yl; R1= CN; R2= (6-amino-2-methylpyridin-3-yl)methyl 3.11 2.87
144 R = pyridin-2-yl; R1= CN; R2= (3-fluoropyridin-2-yl)methyl 1.48 2.06
145 R = pyridin-2-yl; R1= CN; R2= (3-aminobenzo[d]isoxazol-6-yl)methyl 1.72 1.57
146 R = Ph; R1= Cl; R2= (6-NH2-2-Me-3-pyridyl)methyl 1.99 2.54
147c R = Ph; R1= Cl; R2= (6- NH2-2.4-dimethyl-3-pyridyl)methyl 2.48 2.45
148 R = 4-F-1-naphthyl; R1= Cl; R2= (6-NH2-2-Me-3-pyridyl)methyl 2.55 2.54
149c R = 5-Cl-2-pyridyl; R
1= Cl; R2= (6-NH2-2-Me-3-pyridyl)methyl 3.16 2.69
150 R = 5-Cl-1-oxy-2-pyridyl; R1= Cl; R2= (6-NH2-2-Me-3-pyridyl)methyl 3.05 2.89
Compounds151–163
compound R Exp. Log(103/Ki) Calc. Log(103/Ki)
151b R = 2.2-difluoro-2-phenylethyl 1.33 1.61
152 R = 2.2-difluoro-2-(pyridin-3-yl)ethyl 1.47 1.33
153 R = 2.2-difluoro-2-(quinolin-8-yl)ethyl 2.57 2.48
154 R = 2.2-difluoro-2-(isoquinolin-5-yl)ethyl 2.33 2.88
155b R = phenylsulfonyl -0.11 0.19
156 R = 2-methyl-2-(pyridin-2-yl)propyl 1.24 1.55
157 R = 2-methyl-2-(pyridin-3-yl)propyl 0.89 0.42
158b R = 2.2-di
fluoro-2-(1-fluoronaphthalen-4-yl)ethyl 2.51 2.87
159 R = 2.2-difluoro-2-(pyridin-2-yl)ethyl 2.07 2.07
160 R = 2.2-difluoro-2-(quinolin-3-yl)ethyl 0.77 1.02
161 R = 2-(5-chloropyridin-2-yl)-2.2-difluoroethyl 2.75 2.55
162b,c R = (1-(pyridin-2-yl)cyclopropyl)methyl 1.24 0.95
163b R = (1-(pyridin-3-yl)cyclopropyl)methyl 0.85 1.53
occupancy, electrostatic interactions, local hydrophobicity, hydrogen bond (HB) donor, and HB acceptor properties, using a 0.3 attenuation factor in all CoMSIA applications.
Molecular dynamics and MM-GBSA calculations
Complexes of the compounds26,133,147,149,162, and177inside thrombin active site were studied by MD simulations. All simulations were performed using the NAMD software pack-age [33]. The initial coordinates for the MD calculations were taken from the docking experi-ments. To mimic the aqueous environment, an equilibrated water box with sides of 100 Å, centered on the mass center of each inhibitor, was used to solvate the thrombin-ligand system. Protein and inhibitors were described using the optimized potential for liquid simulations CHARMM force field [34] and the CGenFF force field [35], respectively. In turn, the water molecules belonging to the solvent box were described using the flexible TIP3P potential [36,37].
Energy minimization was performed on the models using conjugate gradient method (20.000 steps) to reduce any close contacts. Afterwards, the system was further equilibrated during 2.0 ns. The production run consisted of an MD simulation of 5.0 ns. In all cases, we applied a constraint to the backbone amino acids, we used the NPT ensemble at 300 K, we set a time step of 1 fs to solve the equations of motion, and we set a switched cutoff distance of 9.0 Å.
The free energy calculations were accomplished using the MM-GBSA method [38]. This method combines molecular mechanics energy and implicit solvation models at a reasonable computational cost, leading to outstanding results in several biological systems in recent years [39–41]. We applied this method to 500 snapshots extracted from the 5.0 ns production MD trajectories (explicit TIP3P water molecules and ions were removed for this).
Protein–ligand binding free energy using MM-GBSA was calculated as the difference between the energy of the bound complex and the energy of the unbound protein and inhibitor compound. The method allows for free energy decomposition into contributions originating from different types of physico-chemical interactions. Specifically, the energy is calculated for the protein–ligand complex, the ligand, and the protein, and their energies were computed using the CHARMM force field with the generalized Born implicit solvent model, in order to calculate the averaged binding free energy (ΔG) according to the following equation:
DGbinding ¼DEMMþDGsolvTDS ð1Þ
whereΔEMMincludesΔEinternal(bond, angle, and dihedral energies),ΔEelect(electrostatic), and
ΔEvdw(van der Waals) energies;ΔGsolvis the electrostatic solvation energy (polar and
MM-GBSA (or MM-PBSA) free energies for similar systems [38,42,43]. In this work MM-GBSA calculations were also achieved in NAMD software [33]; the entropy term‒TΔS
was not calculated to reduce computational time.
Results and Discussion
Docking results
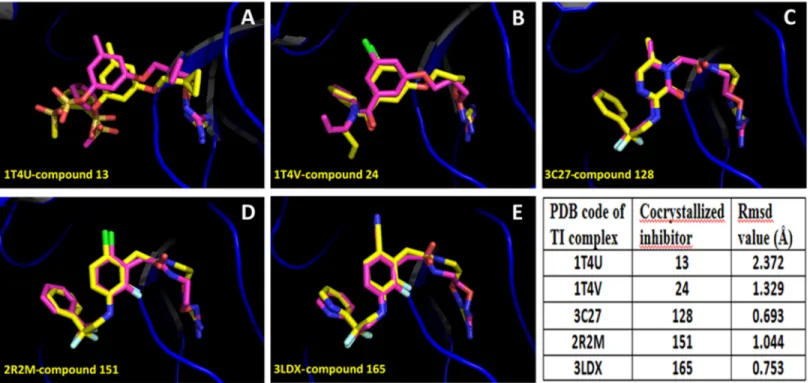
First, we applied docking methodology in order to reproduce the crystal structures of throm-bin-ligand complexes for compounds13,24,128,151, and165(accession codes in PDB: 1T4U, 1T4V, 3C27, 2R2M, and 3LDX respectively). This initial test was used to assess the qual-ity of the docking method to reproduce known structures. InFig 2is shown that the docked structures fitted in an acceptable way with available inhibitor X-ray crystal structures; all the inhibitors were adequately oriented. The values of the root mean square deviation (RMSD) for the docked structures with respect to the co-crystal inhibitor structures considering all heavy atoms were<2.0 Å in almost all the cases analyzed. Considering that 2.0 Å is the threshold value that differentiates between correct and incorrect docking solutions [44], we can state that Glide found the correct binding mode of the ligands in four of the five cases analyzed. Despite compound13had the RMSD value above 2.0 Å, it had the expected orientation in the throm-bin throm-binding site. The high RMSD value for compound13was due to a small displacement of P2group, and a different orientation of the P3group of the docked conformation with respect
to the conformation in the crystallographic structure.
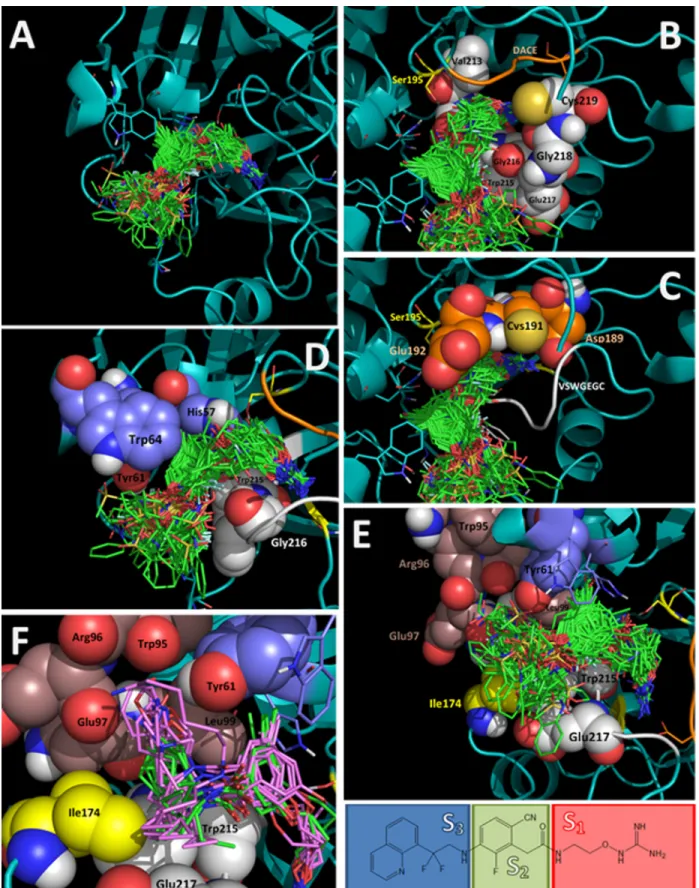
The remaining compounds were docked following the same docking protocol. The analysis of the docking poses obtained for all 177 ligands shows that all compounds adopt the same binding mode (Fig 3; mol2 files are inS1 File). This similar binding mode was expected since Fig 2. Alignment of inhibitor docked structures on inhibitor X-ray reference structures, for the TI complexes. (A)Compound13(PDB: 1T4U);(B)
compound24(PDB: 1T4V);(C)compound128(PDB: 3C27),(D)compound151(PDB: 2R2M);(E)compound165(PDB: 3LDX). Crystal structures are represented in yellow, and docking results are represented in purple. Docking accuracy is reported by means of RMSD values.
Fig 3. Alignment of all docked structures within the thrombin binding site (docked ligands are in green stick representation in A-E). (A)Full view of the binding site.(B)Subsite S1, residues of the VSWGEGC motif are represented with white spheres, DACE motif is represented as an orange loop, Ser195
all compounds contain groups with suitable features to occupy S1, S2, and S3subsites of the
thrombin binding site.
The S1subsite is a large cavity bounded in one part by the residues contained in the
sequence VSWGEGC (Val213-Ser214-Trp215-Gly216-Glu217-Gly218-Cys219). The back-bone atoms of these residues and the side chain atoms of Val213 form a semicircle controlling the shape of the S1subsite (Fig 3B). The other part of the S1subsite is bounded by the residues
contained in the sequence DACE (Asp189-Ala190-Cys191-Glu192), where Asp189 contributes with a negative charge, Cys191 forms a disulfide bond with Cys219 from the VSWGEGC motif, and the residues Ala190, Cys191, and Glu192 contribute with their backbone atoms (Fig 3C). The hydroxyl of the residue Ser195 and the CH2of Gly226 also face the subsite S1. In
gen-eral, all compounds kept the electrostatic interactions between a HB donor group in P1and the
side chain carboxylate of Asp189. The backbone carbonyle groups of Gly218 and Ala190 are close to the site where interactions with Asp189 are formed; therefore they contribute with neg-ative density to attract the P1group (according to crystal structures previously reported,
Gly218 can form HB with the P1group). The S1subsite can bound linear or cyclic groups that
can adopt several conformations. The residue Ser195 (serine from the catalytic triad) has the side chain hydroxyl facing the entrance of S1; polar groups in this zone can interact with this
residue (for instance, NH group in compounds128,151, and165).
The S2subsite is delimited on one side by the residues Tyr61 and Trp64 from the YPPW
insertion loop, and the His57 from the catalytic triad. On the other side S2is delimited by the
residues Trp215 and Gly216 from the motif VSWGEGC (Fig 3D). The S2subsite was occupied
by central aromatic group in all the docked compounds. The residues His57, Tyr61, and Trp64 form a small hole that is occupied by short substituents such as CH3, CN, or halogens. When
bigger substituents (for instance OCH3in the low active compound91) are present, the ligand
central aromatic ring changes its orientation to place the bulky substituent out of the hole. The residue Trp215 exposes Cαand Cβ(CH and CH2groups) to the S2subsite; therefore it
contrib-utes to establish hydrophobic interactions in the portal between S2and S1. Finally, the residue
Gly216 exposes backbone CO and NH groups, and several TIs form HBs with them (for instance, the highly active compounds164‒177that contain the 3-aminopyrazin-2(1H)-one scaffold form HB with both Gly258 backbone groups).
The S3subsite is an ample pocket exposed to the solvent bounded in one part by the residues
contained in the sequence WRENL (Trp95-Arg96-Glu97-Asn98-Leu99). The backbone atoms of these residues and the side chain atoms of Leu99 form a wall where three CO groups (from Trp95, Arg96, and Glu97) are facing the S3subsite (Fig 3E and 3F). Very close to this
wall, the side chain hydroxyl group of Tyr61 faces to the S3subsite. The other part of the S3
subsite is delimited by the hydrophobic chemical groups of the side chains of the residues Ile174, Trp215, and Glu217. Interestingly, S3subsite has a hydrophilic wall (backbone CO
groups of Trp95, Arg96, and Glu97, and side chain hydroxyl group of Tyr61) and a hydropho-bic wall (side chains of the residues Leu99, Ile174, Trp215, and Glu217). Docking results show that the S3subsite tolerates the presence of different aromatic groups. Very hydrophobic P3
groups were located close to the hydrophobic wall and groups with some polarity were located close to the hydrophilic wall. Very large P3groups were also oriented towards the hydrophobic
wall because a bigger available space in this area. For compounds that have a P1moiety with white loop, Ser195 is represented with yellow sticks.(D)Subsite S2, residues His57, Tyr61, and Trp64 are represented with violet spheres, and residues
Trp215 and Gly216 from the VSWGEGC motif are represented with white spheres.(E,F)Subsite S3, residues of the WRENL motif are represented with
brown spheres, residues Trp215 and Glu217 from the VSWGEGC motif are represented with white spheres, and Ile174 is represented with yellow spheres. In f several compounds that have a P1moiety with two branches are represented: compounds with two hydrophobic branches are represented with green
sticks, and compounds with one of the branches containing a polar group are represented with pink sticks.
two branches (compounds24‒77) we found that branches are distributed according to polar-ity. If the two branches are hydrophobic, both groups are located close to the hydrophobic face (compounds in green inFig 3E), but if one of the branches contains a polar group, it is located close to the hydrophilic face and the other branch is located close to the hydrophobic face (compounds in pink colour inFig 3E).
CoMSIA results
CoMSIA models were carried out to provide information about the structural features affecting the thrombin inhibitory activity of the compounds under study. The use of conformations aligned using the binding site (obtained by docking) allows identifying the relevant pharmaco-phoric features required to best match in the binding site [45]. In this sense, the best model reported below accounts for the desired features that characterize the most potent TIs.
Firstly, the CoMSIA models were developed by including one field, and then, these fields were combined and the statistical quality of hybrid models was analyzed by considering Q2 val-ues [46]. According to this analysis, we detected that compounds5,18,33,90, and140 pre-sented large residuals in all models; in this sense, they were excluded as outliers. Outliers are those compounds that have unexpected biological activities and are unable to fit in a QSAR model [47].
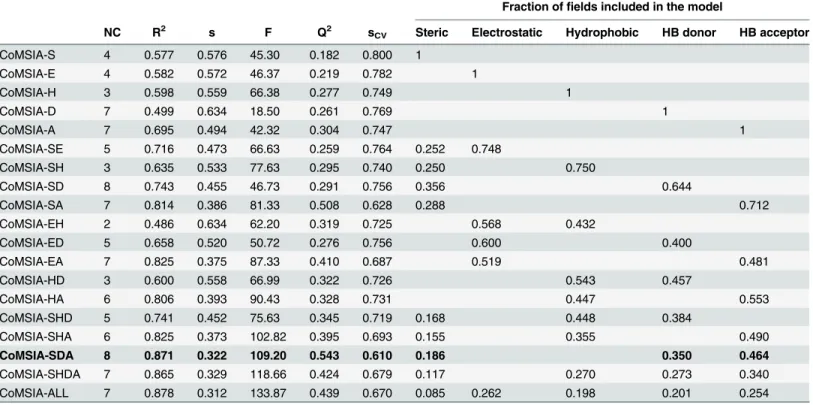
The list of CoMSIA models using different fields, without considering outlier compounds, is presented inTable 2. All the combinations were tested but only the more relevant ones are reported inTable 2(models including one field, models including two fields with Q2>0.2, Table 2. Stepwise development of CoMSIA models by using SAMPLS and different field combinations.
Fraction offields included in the model
NC R2 s F Q2 sCV Steric Electrostatic Hydrophobic HB donor HB acceptor
CoMSIA-S 4 0.577 0.576 45.30 0.182 0.800 1
CoMSIA-E 4 0.582 0.572 46.37 0.219 0.782 1
CoMSIA-H 3 0.598 0.559 66.38 0.277 0.749 1
CoMSIA-D 7 0.499 0.634 18.50 0.261 0.769 1
CoMSIA-A 7 0.695 0.494 42.32 0.304 0.747 1
CoMSIA-SE 5 0.716 0.473 66.63 0.259 0.764 0.252 0.748
CoMSIA-SH 3 0.635 0.533 77.63 0.295 0.740 0.250 0.750
CoMSIA-SD 8 0.743 0.455 46.73 0.291 0.756 0.356 0.644
CoMSIA-SA 7 0.814 0.386 81.33 0.508 0.628 0.288 0.712
CoMSIA-EH 2 0.486 0.634 62.20 0.319 0.725 0.568 0.432
CoMSIA-ED 5 0.658 0.520 50.72 0.276 0.756 0.600 0.400
CoMSIA-EA 7 0.825 0.375 87.33 0.410 0.687 0.519 0.481
CoMSIA-HD 3 0.600 0.558 66.99 0.322 0.726 0.543 0.457
CoMSIA-HA 6 0.806 0.393 90.43 0.328 0.731 0.447 0.553
CoMSIA-SHD 5 0.741 0.452 75.63 0.345 0.719 0.168 0.448 0.384
CoMSIA-SHA 6 0.825 0.373 102.82 0.395 0.693 0.155 0.355 0.490
CoMSIA-SDA 8 0.871 0.322 109.20 0.543 0.610 0.186 0.350 0.464
CoMSIA-SHDA 7 0.865 0.329 118.66 0.424 0.679 0.117 0.270 0.273 0.340
CoMSIA-ALL 7 0.878 0.312 133.87 0.439 0.670 0.085 0.262 0.198 0.201 0.254
NC is the number of components from PLS analysis; R2is the square of the correlation coefficient; S is the standard deviation of the regression; F is the
Fischer ratio; Q2and S
cvare the correlation coefficient and standard deviation of the leave-one-out (LOO) cross-validation, respectively. The best model is
indicated in boldface.
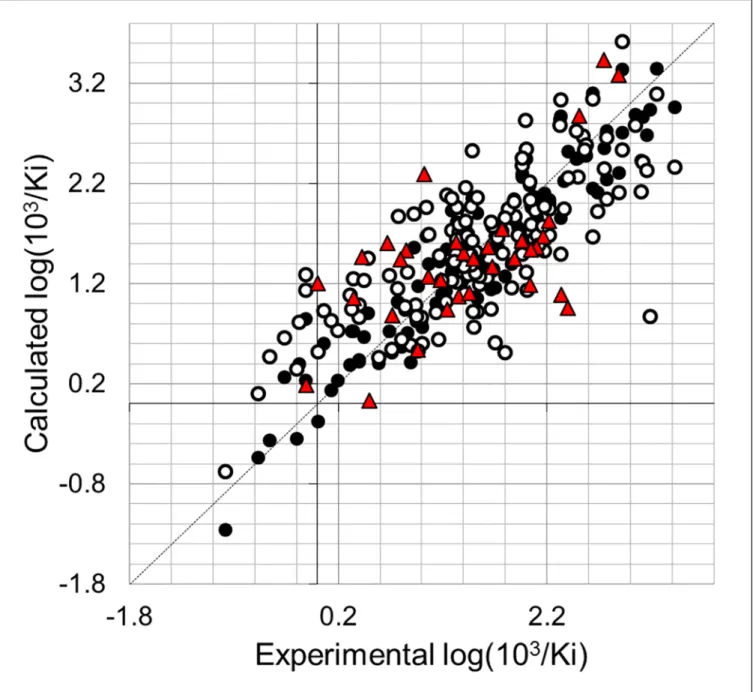
models including three or more fields with Q2>0.3. The internal predictability of the models was the criterion that was used to select the best QSAR model. We observed that CoMSIA models using one field were statistically unacceptable (Q2<0.5). The analysis of the hybrid models yielded the model CoMSIA-SDA with the best Q2value of 0.543. This model combines steric, HB donor, and HB acceptor fields. We included other fields and we observed that it does not produce an improvement in the internal validation of the model CoMSIA-SDA, since models including more fields had lower Q2values (Table 2). The model CoMSIA-SDA was derived by using eight components and showed contributions of the steric field of 18.6%, HB donor field of 35.0%, and the HB acceptor field of 46.4%. In addition, it explains 87.1% of the variance, has a low standard deviation (s = 0.322), and a high Fischer ratio (F = 109.20). The predictions of log(103/Ki) values for the 138 TIs from the training set using model CoM-SIA-SDA are shown inTable 1. The correlation between the calculated and experimental val-ues of log(103/Ki) (from training and LOO cross-validation) is shown inFig 4. Plots of the LOO cross-validation predictions reveal that the proposed model is able to discriminate between the most active and the less active compounds. Considering that the CoMSIA approach was applied to a big dataset, we consider that the value of Q2= 0.543 reflects that there is no redundancy in the training set since each member of the training set is important for the model [48].
We also used model CoMSIA-SDA to predict the TI inhibitory activities of the test set com-pounds. The values are given inTable 1and correlation between the calculated and experimen-tal values are also represented inFig 4. This analysis reveals that the proposed model also predicted adequately all the compounds in the test set.
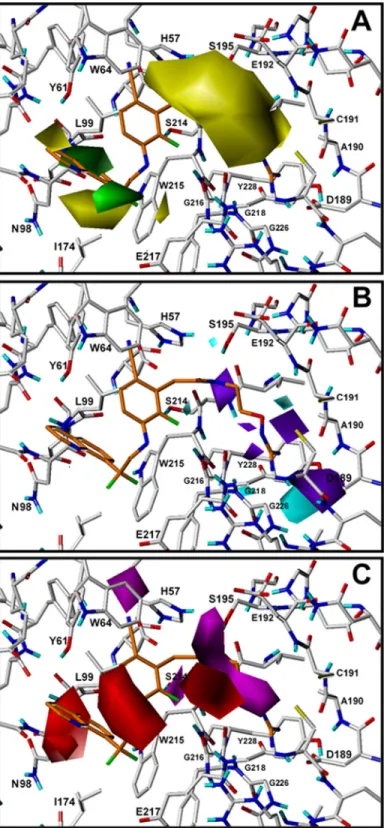
The contour plots of the CoMSIA steric, HB donor, and HB acceptor fields are presented in Fig 5for the best model CoMSIA-SDA. To aid in visualization, compound134is displayed in the maps with a superposition of the contour plots on active-site residues. The representation of contour plots and the thrombin active site in the same 3D space helps in delineating the rela-tionship between the relevant chemical properties of the more active compounds and the chemical groups of the residues in the active site.
The colored isopleths in the map represent the 3D space where the structural properties changes are related to the changes in thrombin inhibitory potency. Green and yellow isopleths inFig 5Aindicate regions where bulky groups increase and decrease the inhibitory activity, respectively. A large region of yellow contour at S1subsite suggests that bulky groups are not
desired in this zone. This feature indicates that linear groups should be prioritized rather than branched groups in S1. Other yellow isopleths at S3subsite near the residues Ile174 and Tyr61
and green isopleths near the residues Glu217 and Leu99 indicate that bulky groups extended to the more hydrophilic part of S3decrease the inhibitory activity, but groups extended to the
hydrophobic part of S3increase the inhibitory activity. The predictions of chemical features of
substituents in S3according to the analysis of steric fields included in CoMSIA-SDA model are
difficult since it is difficult to foresee their occupation and interactions in this wide cavity. Cyan and purple isopleths inFig 5Bare in regions where HB donor groups favor and disfa-vor the activity, respectively. On the other hand, inFig 5Cmagenta isopleths indicate regions where HB acceptors enhance the activity, and red isopleths indicate regions where HB accep-tors decrease the activity. Interestingly, all the cyan and purple isopleths are located at S1
sub-site. The cyan and purple isopleths near Asp189, Gly218, Gly226, and Tyr228 represent 3D spaces that the model identified that are affected by the presence of HB donor groups in the deeper region of S1. The purple isopleth near Ser214, the red isopleth near Gly216, and the
magenta isopleth near Cys191 and Glu192 indicate that the entrance to S1is affected by the
presence of HB donor and acceptor groups. Two red isopleths in S3indicate that HB acceptor
exposed to solvent between Glu217 and Trp64. The magenta isopleth in S2near His57 indicates
that HB acceptor groups such as CN are desired in this zone.
Free energy calculations results
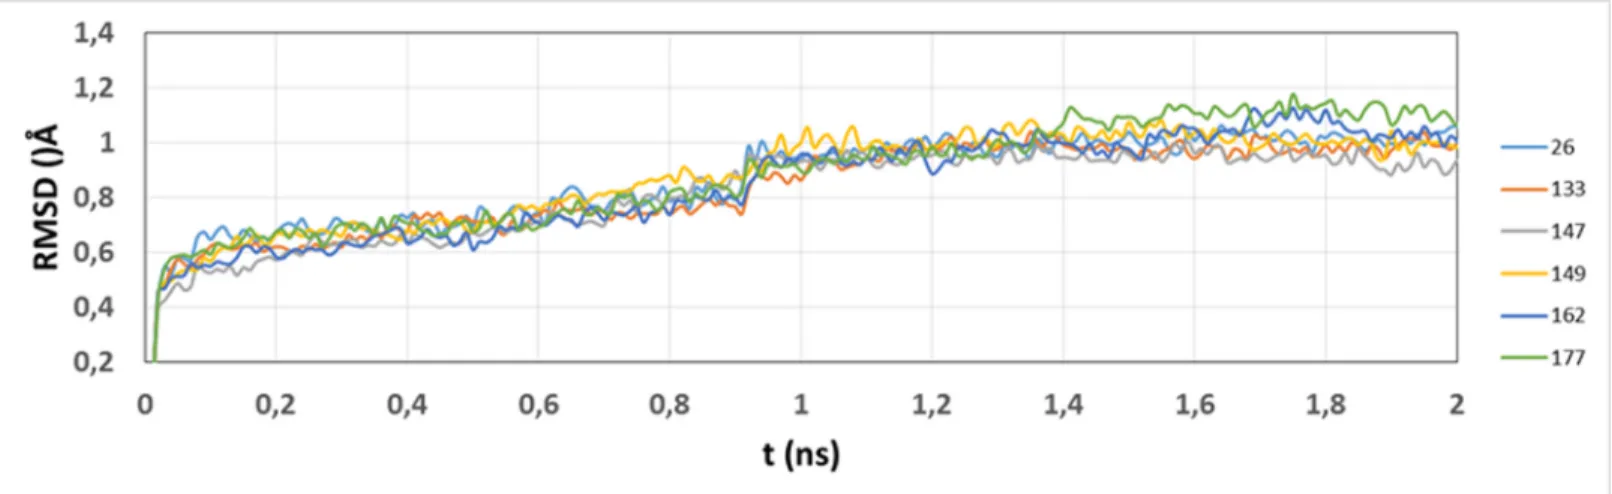
Compounds26,133,147,149,162, and177were selected as a sample for deriving free energy calculations using MM-GBSA method. The study includes a previous conformational sampling using MD simulations to consider averaged properties and to get more realistic conditions. Sta-bility of the MD trajectories using the RMSD of the positions for all the protein atoms as a Fig 4. Scatter plot of the experimental activities versus predicted activities for model CoMFA-SDA: (●) training set predictions (○) LOO cross-validated predictions (red▲) test set predictions.
Fig 5. CoMSIA contour maps for TIs deriving from model CoMSIA-SDA.The amino acid residues located close to the binding pocket of thrombin are represented for comparing their position with the position of isopleths derived from the model. Compound134is shown inside the field.(A)Steric field: green isopleths indicate regions where bulky groups enhance the activity and yellow isopleths indicate regions where bulky groups disfavor the activity.(B). HB donor field: cyan isopleths indicate regions where HB donors favor the activity, and purple isopleths indicate regions where HB donors disfavor the activity.(C)HB acceptor fields: magenta isopleths indicate regions where HB acceptors enhance the activity, and red isopleths indicate regions where HB acceptors decrease the activity.
function of simulation time was evaluated; RMSD was almost constant after the equilibration process (2.0 ns) for all the systems (Fig 6).
The above mentioned compounds were selected from data set having in mind the differ-ences in their activities against thrombin and their differdiffer-ences in the substitution and structural characteristics of the groups located at S1, S2and S3. In this sense, MM-GBSA paradigm
allowed finding the role of physico-chemical terms in the binding potency when different groups located at S1, S2, and S3are changed. Guanidinooxy groups as substituent of
N-ethylace-tamide or n-propanol, and 2-amino-6-methylpyridin-5-yl groups were considered in S1.
Methyl, Cl, F, CN, and oxo groups were considered in the aromatic ring in S2.
2,2-Difluoro-2-arylethyl, (1-arylcyclopropyl)methyl, arylethyl, cyclopentyl groups were considered as chem-ical features in S3.
MD allows analyzing the effect of the water media, the movement of the ligand inside the binding site, the movement of the residues in the binding site, and the stability of HBs. In gen-eral, from the analysis of all the simulations, it is possible to identify different water characteris-tics in the pockets S1, S2, and S3. There are many water molecules in S3which is the more
exposed site to the water media, most of these molecules move freely and the other ones have occasional interactions with polar groups forming HBs. On the other hand, there are no water molecules in S2during MD simulations. Finally, there are some water molecules at S1trapped
in HB networks formed between the ligands and the enzyme; these water molecules have a very limited movement. Interestingly, it is easy to differentiate S1, S2, and S3pockets according to
the distinct water dynamical behavior, and this is highly related to the TI characteristics in each pocket disclosed by docking analysis. The dynamic of the studied ligands using MD simu-lations revealed that groups at S1form stable HB interactions, groups at S2are anchored in a
hydrophobic cage, and groups at S3have a free movement.
The MM-GBSA free energy calculations were employed to get quantitative estimates for the binding free energies of the inhibitors inside the thrombin active site. We found a high correla-tion (R2= 0.751,Fig 7) between calculatedΔG values and the experimental ones (the experi-mental values were expressed asΔΔG values with respect to the most active selected compound 133). However, only six compounds were considered; due to reduced data, we cannot conclude that MM-GBSA was able to explain the trend of the modeled TIs, but we can analyze the free energy components such as van der Waals (VDW), electrostatic, and solvation contributions to give detailed molecular information about the selected systems. The purpose is to evaluate Fig 6. Time dependence of the RMSD for protein atoms from starting structures during equilibration process.RMSD for the studied systems are represented in colors indicated at the right.
the role of the physico-chemical features when different substituents are presented. The results of the predictedΔG values and the physico-chemical componentsΔEvdw,ΔEelect, andΔGsolvfor
the complexes were summarized inTable 3. To get a better view on which energy terms have more impact on the inhibitory potency, these individual energy components were compared. FromTable 3, it can be seen thatΔEvdwhas the major favorable contribution to the total free
energy, but there is no big difference among this value for different complexes. In this sense, the VDW energy term is not primarily responsible for differentiating the binding affinity of the selected TIs. However, some of the most negativeΔEvdwvalues were obtained for the most
Fig 7. Correlation between experimentalΔΔG (calculated from Ki values of compounds) and calculatedΔG values using MM-GBSA.Experimental
ΔG was calculated from Ki values of compounds, andΔΔG was calculated usingΔG of compound133as reference.
active compounds133and149. The solvation term also has the same effect in most of the com-plexes with a favorable contribution to the global free energy. Strangely, this term is positive for the most active compound133. On the contrary, the electrostatic term was only favorable for compound133, and the worst contribution of this term was for the less active compound26.
The analysis of the MM-GBSA terms indicates that not any physico-chemical property has a preponderant role in the potency of TIs. It is expected that this behavior could be maintained if we consider the remaining compounds considering the complexity of the thrombin binding site in S1, S2, and S3pockets. We previously observed that these pockets have very different
characteristics; therefore, each of them could be modulated considering different physico-chemical features. However, the binding affinity can be the result of the combination of the particular effect of these features in each pocket.
Conclusions
In this work, we report a theoretical study on drug design area for thrombin inhibitors (TIs). We selected a data set of 177 compounds with diverse groups at motifs P1, P2, and P3, and
explored the 3D positioning of them inside the thrombin active site pockets S1, S2, and S3by
docking experiments. Our approach reproduced the previously reported position of com-pounds13,24,128,151, and165inside thrombin’s active site. The remaining compounds were oriented in a similar manner. The interactions established for all compounds within thrombin binding site were carefully described.
Additionally, predictive QSAR models were built by using CoMSIA method. We found that CoMSIA-SDA including 138 compounds in the training set was the best among the explored models. This model included steric, HB donor, and HB acceptor fields. It was validated by LOO cross-validation and then it was used in the prediction of an external set which contains 34 compounds that were not included during the training process. The CoMSIA model could be used to predict novel candidates; moreover, the interpretation of the CoMSIA fields makes it possible to draw conclusions concerning the most appropriate features for novel analogues. Finally, six compounds were selected and were subjected to MD and free energy calculations using MM-GBSA method. The dynamical behavior of the systems were revealed by MD; it was interesting to note that water molecules have completely different dynamical behavior in pock-ets S1, S2, and S3, which is related to the desired characteristics of motifs P1, P2, and P3of TIs.
The free energy calculations using MM-GBSA allowed studying the role of physico-chemical parameters such as van der Waals interactions, electrostatic interactions, and solvation. It was found that not any component was preponderant in the study of the differential potency of inhibitors.
Table 3. Predicted MM-GBSA free energies (kcal/mol) and individual energy terms of the thrombin-inhibitor complexes for selected compounds.
compound ΔGcalc ΔGvdw ΔGelect ΔGsolv ΔΔGexp
a ExperimentalΔΔG was calculated usingΔG of compound133as reference.
Supporting Information
S1 File. Docking poses obtained for the TIs in mol2 format. (ZIP)
Author Contributions
Conceived and designed the experiments: JC. Performed the experiments: KMU. Analyzed the data: JC WT. Contributed reagents/materials/analysis tools: JC. Wrote the paper: JC.
References
1. Qaseem A, Chou R, Humphrey LL, Starkey M, Shekelle P. Venous Thromboembolism Prophylaxis in Hospitalized Patients: A Clinical Practice Guideline From the American College of Physicians. Ann Intern Med. 2011; 155: 625–632. doi:10.1059/0003-4819-155-9-201111010-00011PMID:22041951
2. Melnikova I. The anticoagulants market. Nat Rev Drug Discov. 2009; 8: 353–353. doi:10.1038/nrd2851 PMID:19390569
3. Tanaka KA, Key NS, Levy JH. Blood coagulation: hemostasis and thrombin regulation. Anesth Analg. 2009; 108: 1433–1446. doi:10.1213/ane.0b013e31819bcc9cPMID:19372317
4. Coppens M, Eikelboom JW, Gustafsson D, Weitz JI, Hirsh J. Translational success stories: develop-ment of direct thrombin inhibitors. Circ Res. 2012; 111: 920–929. doi:10.1161/CIRCRESAHA.112. 264903PMID:22982873
5. Tomczuk B, Lu T, Soll RM, Fedde C, Wang A, Murphy L, et al. Oxyguanidines: application to non-pep-tidic phenyl-based thrombin inhibitors. Bioorg Med Chem Lett. 2003; 13: 1495–1498. PMID:12668020
6. Lu T, Markotan T, Coppo F, Tomczuk B, Crysler C, Eisennagel S, et al. Oxyguanidines. Part 2: Discov-ery of a novel orally active thrombin inhibitor through structure-based drug design and parallel synthe-sis. Bioorg Med Chem Lett. 2004; 14: 3727–3731. doi:10.1016/j.bmcl.2004.05.002PMID:15203151
7. Soll RM, Lu T, Tomczuk B, Illig CR, Fedde C, Eisennagel S, et al. Amidinohydrazones as guanidine bioisosteres: application to a new class of potent, selective and orally bioavailable, non-amide-based small-molecule thrombin inhibitors. Bioorg Med Chem Lett. 2000; 10: 1–4. PMID:10636229
8. Lu T, Soll RM, Illig CR, Bone R, Murphy L, Spurlino J, et al. Structure-activity and crystallographic anal-ysis of a new class of non-amide-based thrombin inhibitor. Bioorg Med Chem Lett. 2000; 10: 79–82. PMID:10636249
9. Lu T, Tomczuk B, Bone R, Murphy L, Salemme FR, Soll RM. Non-peptidic phenyl-based thrombin inhibitors: exploring structural requirements of the S1 specificity pocket with amidines. Bioorg Med Chem Lett. 2000; 10: 83–85. PMID:10636250
10. Lu T, Tomczuk B, Illig CR, Bone R, Murphy L, Spurlino J, et al. In vitro evaluation and crystallographic analysis of a new class of selective, non-amide-based thrombin inhibitors. Bioorg Med Chem Lett. 1998; 8: 1595–1600. PMID:9873397
11. Kreutter KD, Lu T, Lee L, Giardino EC, Patel S, Huang H, et al. Orally efficacious thrombin inhibitors with cyanofluorophenylacetamide as the P2 motif. Bioorg Med Chem Lett. 2008; 18: 2865–2870. doi: 10.1016/j.bmcl.2008.03.087PMID:18420408
12. Lee L, Kreutter KD, Pan W, Crysler C, Spurlino J, Player MR, et al. 2-(2-Chloro-6-fluorophenyl)acet-amides as potent thrombin inhibitors. Bioorg Med Chem Lett. 2007; 17: 6266–6269. doi:10.1016/j. bmcl.2007.09.013PMID:17889527
13. Lu T, Markotan T, Ballentine SK, Giardino EC, Spurlino J, Crysler CS, et al. Discovery and clinical eval-uation of 1-{N-[2-(amidinoaminooxy)ethyl]amino}carbonylmethyl-6-methyl-3-[2,2-difluoro-2-pheny-lethylamino]pyrazinone (RWJ-671818), a thrombin inhibitor with an oxyguanidine P1 motif. J Med Chem. 2010; 53: 1843–1856. doi:10.1021/jm901802nPMID:20102150
14. Kontogiorgis CA, Hadjipavlou-Litina D. Quantitative Structure—Activity Relationships (QSARs) of Thrombin Inhibitors: Review, Evaluation and Comparative Analysis. Current Medicinal Chemistry. 2003; 10: 525–577. doi:10.2174/0929867033457935PMID:12678789
15. Böhm M, Stürzebecher J, Klebe G. Three-Dimensional Quantitative Structure−Activity Relationship Analyses Using Comparative Molecular Field Analysis and Comparative Molecular Similarity Indices Analysis To Elucidate Selectivity Differences of Inhibitors Binding to Trypsin, Thrombin, and Factor Xa. J Med Chem. 1999; 42: 458–477. doi:10.1021/jm981062rPMID:9986717
17. Deswal S, Roy N. Quantitative structure activity relationship studies of aryl heterocycle-based thrombin inhibitors. Eur J Med Chem. 2006; 41: 1339–1346. doi:10.1016/j.ejmech.2006.07.001PMID: 16884829
18. Ramírez-Galicia G, Garduño-Juárez R, Correa-Basurto J, Deeb O. Exploring QSARs for inhibitory effect of a set of heterocyclic thrombin inhibitors by multilinear regression refined by artificial neural net-work and molecular docking simulations. Journal of Enzyme Inhibition and Medicinal Chemistry. 2012; 27: 174–186. doi:10.3109/14756366.2011.582467PMID:21635208
19. Muley L, Baum B, Smolinski M, Freindorf M, Heine A, Klebe G, et al. Enhancement of hydrophobic interactions and hydrogen bond strength by cooperativity: synthesis, modeling, and molecular dynam-ics simulations of a congeneric series of thrombin inhibitors. J Med Chem. 2010; 53: 2126–2135. doi: 10.1021/jm9016416PMID:20148533
20. Silva V de A, Cargnelutti MT, Giesel GM, Palmieri LC, Monteiro RQ, Verli H, et al. Structure and Behav-ior of Humanα-Thrombin upon Ligand Recognition: Thermodynamic and Molecular Dynamics Studies. PLoS ONE. 2011; 6: e24735. doi:10.1371/journal.pone.0024735PMID:21935446
21. de Candia M, Fiorella F, Lopopolo G, Carotti A, Romano MR, Lograno MD, et al. Synthesis and biologi-cal evaluation of direct thrombin inhibitors bearing 4-(piperidin-1-yl)pyridine at the P1 position with potent anticoagulant activity. J Med Chem. 2013; 56: 8696–8711. doi:10.1021/jm401169aPMID: 24102612
22. Nilsson M, Hämäläinen M, Ivarsson M, Gottfries J, Xue Y, Hansson S, et al. Compounds Binding to the S2−S3 Pockets of Thrombin. J Med Chem. 2009; 52: 2708–2715. doi:10.1021/jm8011849PMID: 19371038
23. Bhunia SS, Roy KK, Saxena AK. Profiling the Structural Determinants for the Selectivity of Representa-tive Factor-Xa and Thrombin Inhibitors Using Combined Ligand-Based and Structure-Based
Approaches. J Chem Inf Model. 2011; 51: 1966–1985. doi:10.1021/ci200185qPMID:21761917
24. Maestro, version 9.0, 2007. New York, NY.: Schrödinger, LLC;
25. Caballero J, Vergara-Jaque A, Fernández M, Coll D. Docking and quantitative structure–activity rela-tionship studies for sulfonyl hydrazides as inhibitors of cytosolic human branched-chain amino acid aminotransferase. Mol Divers. 2009; 13: 493–500. doi:10.1007/s11030-009-9140-1PMID:19350404
26. Caballero J, Quiliano M, Alzate-Morales JH, Zimic M, Deharo E. Docking and quantitative structure– activity relationship studies for 3-fluoro-4-(pyrrolo[2,1-f][1,2,4]triazin-4-yloxy)aniline, 3-fluoro-4-(1H-pyr-rolo[2,3-b]pyridin-4-yloxy)aniline, and 4-(4-amino-2-fluorophenoxy)-2-pyridinylamine derivatives as c-Met kinase inhibitors. J Comput-Aided Mol Des. 2011; 25: 349–369. doi:10.1007/s10822-011-9425-1 PMID:21487786
27. Fuentes E, Badimon L, Caballero J, Padró T, Vilahur G, Alarcón M, et al. Protective mechanisms of adenosine 5’-monophosphate in platelet activation and thrombus formation: Thromb Haemost. 2014; 111: 491–507. doi:10.1160/TH13-05-0386PMID:24306059
28. Friesner RA, Banks JL, Murphy RB, Halgren TA, Klicic JJ, Mainz DT, et al. Glide: A New Approach for Rapid, Accurate Docking and Scoring. 1. Method and Assessment of Docking Accuracy. J Med Chem. 2004; 47: 1739–1749. doi:10.1021/jm0306430PMID:15027865
29. Ligprep, version 2.5, 2011. New York, NY.: Schrödinger, LLC;
30. Munoz C, Adasme F, Alzate-Morales JH, Vergara-Jaque A, Kniess T, Caballero J. Study of differences in the VEGFR2 inhibitory activities between semaxanib and SU5205 using 3D-QSAR, docking, and molecular dynamics simulations. J Mol Graph Model. 2012; 32: 39–48. doi:10.1016/j.jmgm.2011.10. 005PMID:22070999
31. SYBYL, version 7.3. 1699 South Hanley Rd., St. Louis, MO 63144, USA.: Tripos Inc.; 2006.
32. Bush BL, Nachbar RB. Sample-distance partial least squares: PLS optimized for many variables, with application to CoMFA. J Comput-Aided Mol Des. 1993; 7: 587–619. doi:10.1007/BF00124364PMID: 8294948
33. Phillips JC, Braun R, Wang W, Gumbart J, Tajkhorshid E, Villa E, et al. Scalable molecular dynamics with NAMD. J Comp Chem. 2005; 26: 1781–1802. doi:10.1002/jcc.20289
34. MacKerell AD, Bashford D, Bellott M, Dunbrack RL, Evanseck JD, Field MJ, et al. All-Atom Empirical Potential for Molecular Modeling and Dynamics Studies of Proteins. J Phys Chem B. 1998; 102: 3586– 3616. doi:10.1021/jp973084fPMID:24889800
35. Vanommeslaeghe K, Hatcher E, Acharya C, Kundu S, Zhong S, Shim J, et al. CHARMM general force field: A force field for drug-like molecules compatible with the CHARMM all-atom additive biological force fields. J Comput Chem. 2010; 31: 671–690. doi:10.1002/jcc.21367PMID:19575467
37. Steinbach PJ, Brooks BR. New spherical-cutoff methods for long-range forces in macromolecular simu-lation. J Comput Chem. 1994; 15: 667–683. doi:10.1002/jcc.540150702
38. Massova I, Kollman PA. Combined molecular mechanical and continuum solvent approach (MM-PBSA/GBSA) to predict ligand binding. Perspectives in Drug Discovery and Design. 2000; 18: 113– 135. doi:10.1023/A:1008763014207
39. Homeyer N, Gohlke H. Free Energy Calculations by the Molecular Mechanics Poisson−Boltzmann Sur-face Area Method. Mol Inf. 2012; 31: 114–122. doi:10.1002/minf.201100135
40. Adasme-Carreño F, Muñoz-Gutierrez C, Caballero J, Alzate-Morales J. Performance of The MM/GBSA Scoring Using a Binding Site Hydrogen Bond Network-Based Frame Selection: The Protein Kinase Case. Phys Chem Chem Phys. 2014; 16: 14047–14058. doi:10.1039/C4CP01378FPMID:24901037
41. Mena-Ulecia K, Vergara-Jaque A, Poblete H, Tiznado W, Caballero J. Study of the Affinity between the Protein Kinase PKA and Peptide Substrates Derived from Kemptide Using Molecular Dynamics Simu-lations and MM/GBSA. PLoS ONE. 2014; 9: e109639. doi:10.1371/journal.pone.0109639PMID: 25275314
42. Hou T, Yu R. Molecular Dynamics and Free Energy Studies on the Wild-type and Double Mutant HIV-1 Protease Complexed with Amprenavir and Two Amprenavir-Related Inhibitors: Mechanism for Binding and Drug Resistance. J Med Chem. 2007; 50: 1177–1188. doi:10.1021/jm0609162PMID:17300185
43. Wang W, Kollman PA. Computational study of protein specificity: The molecular basis of HIV-1 prote-ase drug resistance. PNAS. 2001; 98: 14937–14942. doi:10.1073/pnas.251265598PMID:11752442
44. Gohlke H, Hendlich M, Klebe G. Knowledge-based scoring function to predict protein-ligand interac-tions. J Mol Biol. 2000; 295: 337–356. doi:10.1006/jmbi.1999.3371PMID:10623530
45. Caballero J, Zilocchi S, Tiznado W, Collina S, Rossi D. Binding studies and quantitative structure-activ-ity relationship of 3-amino-1H-indazoles as inhibitors of GSK3β. Chem Biol Drug Des. 2011; 78: 631– 641. doi:10.1111/j.1747-0285.2011.01186.xPMID:21756288
46. Caballero J, Fernández M, González-Nilo FD. Structural requirements of pyrido[2,3-d]pyrimidin-7-one as CDK4/D inhibitors: 2D autocorrelation, CoMFA and CoMSIA analyses. Bioorg Med Chem. 2008; 16: 6103–6115. doi:10.1016/j.bmc.2008.04.048PMID:18468903
47. Verma RP, Hansch C. An approach toward the problem of outliers in QSAR. Bioorg Med Chem. 2005; 13: 4597–4621. doi:10.1016/j.bmc.2005.05.002PMID:15951183