DISCOVERY OF RR LYRAE STARS IN THE NUCLEAR BULGE OF THE MILKY WAY
Dante Minniti1,2,3, Rodrigo Contreras Ramos1,4, Manuela Zoccali1,4, Marina Rejkuba5,6, Oscar A. Gonzalez7, Elena Valenti5, and Felipe Gran1,4
1
Instituto Milenio de Astrofisica, Santiago, Chile;dante@astrofisica.cl,[email protected] 2
Departamento de Fisica, Facultad de Ciencias Exactas, Universidad Andres Bello Av. Fernandez Concha 700, Las Condes, Santiago, Chile 3
Vatican Observatory, V00120 Vatican City State, Italy 4
Pontificia Universidad Catolica de Chile, Instituto de Astrofsica, Av. Vicuna Mackenna 4860, Santiago, Chile 5
European Southern Observatory, Karl-Schwarszchild-Str. 2, D-85748 Garching bei Muenchen, Germany 6
Excellence Cluster universe, Boltzmannstr. 2, D-85748, Garching, Germany 7
UK Astronomy Technology Centre, Royal Observatory, Blackford Hill, Edinburgh, EH9 3HJ, UK
Received 2016 August 11; revised 2016 September 8; accepted 2016 September 12; published 2016 October 7
ABSTRACT
Galactic nuclei, such as that of the Milky Way, are extreme regions with high stellar densities, and in most cases, the hosts of a supermassive black hole. One of the scenarios proposed for the formation of the Galactic nucleus is merging of primordial globular clusters. An implication of this model is that this region should host stars that are characteristically found in old Milky Way globular clusters. RR Lyrae stars are primary distance indicators, well known representatives of old and metal-poor stellar populations, and therefore are regularly found in globular clusters. Here we report the discovery of a dozen RR Lyrae type ab stars in the vicinity of the Galactic center, i.e.,
in the so-called nuclear stellar bulge of the Milky Way. This discovery provides the first direct observational
evidence that the Galactic nuclear stellar bulge contains ancient stars(>10 Gyr old). Based on this we conclude
that merging globular clusters likely contributed to the build-up of the high stellar density in the nuclear stellar bulge of the Milky Way.
Key words:catalogs –editorials, notices –miscellaneous–surveys
1. INTRODUCTION
There are very limited observational tests that can be applied to shed light on the origins of galactic nuclei, using their stars and black holes. The only galactic nucleus where detailed
stellar population properties can be derived with sufficiently
high resolution and accuracy is that of the Milky Way, making it a fundamental testbed for different formation models. There we can in principle resolve individual stars, probing a wide range of stellar ages and metallicities. There are two main scenarios proposed for the formation of the nuclear bulge of the Milky Way, and of all galactic nuclei in general: merging of
globular clusters(Tremaine et al.1975; Capuzzo-Dolcetta1993;
Gnedin et al.2014; Guillard et al.2016), and fast gas accretion
and star formation onto the central region(Milosavljević2004;
Schinnerer et al.2008).
Here we concentrate on testing thefirst of these two theories.
In that scenario, dynamical friction causes orbital decay, dragging globular clusters deep into the potential well, where they merge and form a high-density nuclear bulge with a nuclear star cluster at its center. While merging globular clusters typically bring in old stellar populations, comparison with observations requires some additional in situ star
formation (Antonini et al.2015), or subsequent growth of the
newly formed nuclear cluster via wet merger with other clusters that bring with them additional gas reservoirs that contribute
younger stars (Guillard et al. 2016). Therefore, young or
intermediate-age stellar populations often dominate the total light in galactic nuclei, even in cases where they make a minor contribution to the total stellar mass. It is then very difficult, in an environment like the Galactic center, to establish the presence of the ancient stellar populations, and to estimate their ages and metallicities. Such old populations must be present if the nuclear bulge of the Milky Way was made through the
merging of primordial globular clusters (
Capuzzo-Dolcetta1993).
Theoretically, if the nuclear stellar bulge formed through the merging of several globular clusters, the expected extension of
thefinal merger product is about 100 pc(Capuzzo-Dolcetta1993;
Antonini et al.2012; Antonini2014; Gnedin et al.2014). This
size appears to be obtained by the simulations regardless of the
presence or absence of a central massive black hole(
Capuzzo-Dolcetta 1993; Capuzzo-Dolcetta & Miocchi 2008;
Capuzzo-Dolcetta & Mastrobuono-Battisti 2009; Antonini et al. 2012;
Antonini2014).
Observationally, the nuclear bulge of the Milky Way is well
fit by two components: the nuclear star cluster, a compact
component with a half-light radius of 4 pc (2 arcmin) that
dominates the inner 30 pc, and the nuclear stellar bulge, a
shallower component extending out to about 120 pc(Launhardt
et al.2002). This size is comparable to the sizes of well studied
nuclear stellar bulges of other external galaxies (Lotz et al.
2001; Carollo et al.2002; Hartmann et al.2011).
As globular clusters are tidally disrupted, they yield their
stars, including RR Lyrae, to thefield. So far, there has been no
search for variable stars that was deep enough tofind RR Lyrae
in the complex Galactic center region. However, this can now be tested observationally with the VISTA Variables in the Via
Lactea (VVV) ESO public survey (Minniti et al.2010; Saito
et al. 2012), which contains deep multi-epoch photometry in
the near-IR, allowing us tofind faint variable sources.
In the present search we also find numerous bright LPVs/
Miras, eclipsing binaries, Cepheids, and microlensing events,
which will be reported elsewhere. Here we concentrate only
on the RR Lyrae because in this context they play a crucial role. Their properties make them prime representatives of the
primordial stellar populations of the Milky Way because: (a)
they have a well known period–luminosity(P–L)relation, and
are therefore excellent distance indicators;(b)they have a very narrow range of intrinsic colors, which makes them excellent reddening indicators; and (c)they are old (age>10 Gyr) and metal-poor(i.e.,[Fe/H]<−0.5).
2. VVV SURVEY PHOTOMETRY
The limiting magnitudes (Ks∼18 mag, J∼20 mag) and spatial resolution(∼0.8 arcsec)of the near-IR data provided by
the VVV survey enable for thefirst time a successful search of
RR Lyrae throughout the Galactic center region. The
point-spread function (PSF)-fitting photometry of the individual
VVV images for∼100 epochs of the tiles b333 and b334 was
carried out following the procedure described by Alonso-García et al. (2015)and Minniti et al. (2015). The search for periodic variable stars, phasing of the light curves, and
classification of the RR Lyrae type ab were made following
the strategies outlined by Gran et al. (2016)and Dékány et al.
(2013). We searched for RR Lyrae with magnitudes of
12<Ks<17, amplitudes of 0.2<A<1.0, and periods of 0.3<P<1.0 days.
Extreme crowding and extinction variations are clearly
evident in near-IR images taken by the VVV survey(Figure1).
Searching for RR Lyrae in the most crowded and reddened region of the Milky Way is therefore a daunting task, in which
several problems need to be faced and sorted out. Specifically,
the completeness depends on the position in thefield, as these
are near-IR mosaics. The stellar density is very high, and the
presence of numerous saturated stars in thefield that obliterate
their surroundings is a limiting factor in the photometry. In addition, the large and differential reddening, highly variable even on small spatial scale, affects the photometric complete-ness, although the effect is less severe than the crowding. Indeed, the VVV photometry is generally deep enough to reach
well below the RR Lyrae region of the color–magnitude
diagram even in the most reddened region at the distance of the
Galactic center (Figure 3). The photometric completeness in
this region measured from red clump giants at
14.3<Ks<15.9, the magnitude range of the spanned by
the observed RR Lyrae, has an average value of 80%(Valenti
et al.2016). However, the variable seeing and uneven sampling
of the observed epochs contribute to further reducing the completeness of our sample. The faint magnitudes of the
targets also prevent us fromfinding/classifying RR Lyrae that
have very small amplitudes(<0.2 mag).
For all these reasons, we do not claim full completeness for the detection of RR Lyrae, but conversely we expect many more to be found in dedicated high-resolution deep searches that might enable us to establish the total RR Lyrae density number in the Galactic center region.
The shape of the light curves is also an important limiting factor, with contamination from eclipsing binaries being a serious problem for the sinusoidal light curves, and therefore limiting us to mostly select RRab with asymmetric light curves.
The total number of epochs(i.e., points in the light curves)is
∼100 epochs, generally sufficient to select RR Lyrae with
confidence. However, sampling is a problem, with many good
candidates that need to be discarded as aliases. We therefore have many more RR Lyrae candidates for which additional observations are needed in order to measure their periods accurately. These observations will be acquired during the next
three years as part of the VVV extended survey(VVVX).
3. THE INNERMOST RR LYRAE
Here we report the discovery of a dozen RR Lyrae type ab
(fundamental mode pulsators) stars within 36 arcmin (84 pc)
from the Galactic center(Figure1), plus a couple of c-type RR
Lyrae (pulsating in their first overtone). We measure accurate
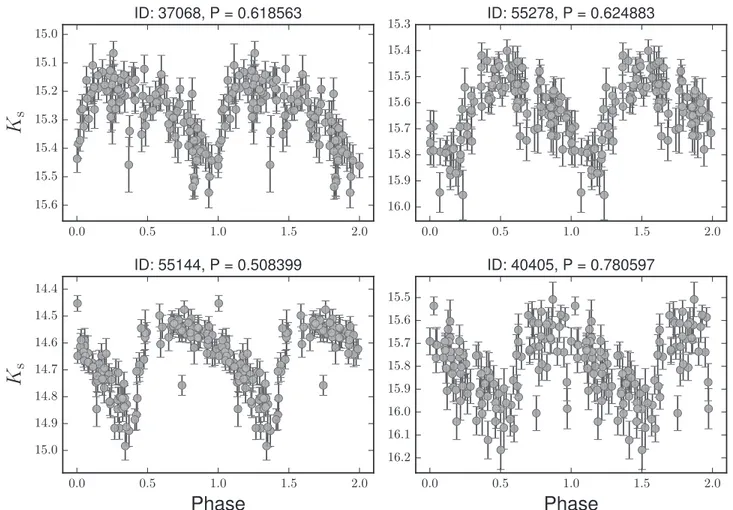
positions, projected distances from the Galactic center, mean IR magnitudes and colors, periods, and amplitudes for all of our targets(Table1). The clear variability signature of RR Lyrae, including their characteristic saw-tooth light curve shape
(Figure 2), and their measured amplitudes and periods, are
the unambiguous signatures that we are detecting individual ancient and faint RR Lyrae, and not stellar blends or other artifacts.
We also found a candidate type II Cepheid at a projected
distance of 45pc (20 arcmin) from the Galactic center. This
type II Cepheid withP=1.809 days, mean Ks=14.66, and
(J-Ks)=4.02, is also representative of an old and
metal-poor population present in the vicinity of the nuclear star cluster. A fundamental implication about the old age of the variable stars found here is that the nuclear stellar bulge must have been in place since the origins of the Milky Way. In
addition, we discovered several more bonafide RR Lyrae over a
wider area, within 36–50 arcmin (84–109 pc) of the Galactic
center, just outside of the nuclear bulge.
The near-IR color–magnitude diagram obtained from PSF
fitting photometry shows the high extinction of thefield where
these RR Lyrae have been discovered(Figure3). The target RR
Lyrae are fainter and bluer than the bulge red clump giants. When taking into account the large extinction differences
across the bulge, the comparison of the color–magnitude
diagram of these RR Lyrae and those in other regions of the bulge(Minniti et al.2010; Saito et al.2012)is consistent with them being RR Lyrae located in the region of the Galactic center.
Figure 1.Location of the RR Lyrae type ab stars. Near-infrared JHKs color image of the Galactic center region from the VVV survey(Minniti et al.2010). The extensions of the nuclear star cluster(R∼35 pc), and the nuclear bulge
3.1. Extinction Corrections
Extinction corrections to the measured near-IR magnitudes are a mandatory step in order to assess the location of the sample RR Lyrae within the Galactic nucleus. The RR Lyrae lie in the instability strip, which is a narrow band in the color–
magnitude diagram, and their intrinsic colors can be assumed to
be(J-K)0=0.150.05mag. Although we only have Ks
-band light curves and a single (or a few) J-band epoch, the
color corrections for de-reddened RR Lyrae due to the singleJ
-band observation is negligible(Dékány et al.2013; Gran et al.
2016). In fact, the color variation along the light curves is
Table 1
Photometric Observationsa
ID R.A. Decl. R Ks J (J-Ks) P A
(J2000) (J2000) arcmin days
40405 266.17164326 −28.86342987 15.5 15.78 20.05 4.27 0.780597 0.32
65743 266.40425763 −29.31187570 18.3 14.27 18.17 3.90 0.594484 0.22
55278 266.79651367 −29.08202592 20.4 15.60 19.07 3.47 0.624883 0.35
37068 266.28880383 −28.68220478 20.7 15.26 18.34 2.98 0.618563 0.30
80042 266.62151461 −28.71032145 20.8 15.44 18.63 3.19 0.408153 0.29
84844 266.06131561 −28.83296846 21.4 15.87 19.69 3.82 0.549641 0.36
58214 266.11652879 −28.65279182 26.5 15.79 18.87 3.08 0.403153 0.26
55144 266.10448919 −28.65918014 26.6 14.64 18.00 3.36 0.508399 0.39
89691 266.24177968 −28.58633606 26.9 15.74 19.33 3.59 0.376027 0.25
33007 266.92238653 −28.83231159 28.6 15.27 18.74 3.47 0.621276 0.24
42332 266.10220084 −28.61729278 28.7 15.34 17.93 2.59 0.520099 0.30
65271 266.26347962 −28.47343076 33.1 14.81 17.75 2.94 0.369534 0.30
8444 266.09247811 −28.51255523 34.3 15.52 18.60 3.08 0.487035 0.44
33289 266.20795127 −28.43858475 35.9 15.58 18.61 3.03 0.480476 0.33
Note.
a
Typical photometric errors areσKs=0.01 mag, andσJ=0.06 mag. Periods are good to 10−5days, andKs-band amplitude errors areσA=0.02 mag.
typically small in the near-IR(D(J-Ks)<0.05mag). When
computing the reddening for a specific target, the most
important systematic error is the uncertain slope of the
reddening law(Majaess et al.2016; Nataf et al.2016; Gonzalez
et al. 2012). For example, comparing Ak =0.528E J( -K)
given by Nishiyama et al. (2009) with Ak =0.72E J( -K)
from Cardelli et al. (1989), and Ak =0.435E J( -K) from
Alonso-García et al. (2015), the corresponding differences for
the typical extinction values of the Galactic center region
(E J( -K)~3.0 4.0– ) are significant. Adopting the most
recent value given by Alonso-García et al.(2015)that applies
to the VVV data, and which also agrees with the slope of the
reddened red giant clump seen in the color–magnitude diagram
(Figure3), wefind for each candidate the reddeningE J( -Ks)
and extinctionAklisted in Table2.
3.2. Metallicities
In order to explore the properties of globular clusters that could have initially formed the Galactic nuclear bulge, we examine the properties of the Oosterhoff type I and II globular
cluster populations(Oosterhoff1939; Catelan2009). A way to
distinguish between these two populations is by measuring the average periods of their RR Lyrae, which are shorter in the
mean for type I(á ñ =P 0.55days)than for type II Oosterhoff
cluster populations(á ñ =P 0.65days) (Catelan2009). Wefind that the distribution of periods of the nuclear bulge RR Lyrae
has a mean ofP=0.55 days, resembling an Oosterhoff type I
population(more metal-rich than[Fe/H]=−1.6 dex). Alternatively, the mean metallicities for RR Lyrae type ab can be estimated using their period-amplitude-metallicity relations. After discarding the RR Lyrae type c, we obtain mean metallicities ofá[Fe H]ñ=−1.0,−1.4, and−1.3 dex for the sample RR Lyrae using the calibrations from Alcock et al. (2000), Yang et al.(2010), and Feast et al.(2010), respectively.
The Bailey diagram is shown in Figure4, in comparison to the
bulge RR Lyrae. The resulting individual metallicities using the
Galactic RR Lyrae calibration from Feast et al. (2010, which
should only be taken as indicative until spectroscopic
measure-ments become available), are listed in Table 2. Therefore, we
suggest that most of the merged clusters were Oosterhoff type I globulars (with −1.6<[Fe/H]<−0.9 dex).Even though we cannot deny that a few of the primordial globular clusters that merged into the nuclear stellar bulge might have been very metal-poor(with[Fe/H]<−2 dexlikeVVV-RRL-40405), they do not appear to be the dominant population. Interestingly, the star VVV-RRL-40405 that is located only 16 arcmin away from the Galactic center is the most metal-poor star of this sample,
Table 2
Measured Stellar Parameters
ID E(J−Ks)a AK (m-M)0b Deb (m-M)0c Dec [Fe/H]a Comments
(kpc) (kpc) (dex)
40405 4.12 1.79 14.67 8.6 14.92 9.6 −2.2 RRab
65743 3.75 1.63 13.02 4.0 13.27 4.5 −1.5 RRab foreground?
55278 3.32 1.44 14.59 8.3 14.85 9.3 −1.6 RRab
37068 2.83 1.23 14.45 7.8 14.67 8.6 −1.6 RRab
80042 3.04 1.32 14.09 6.6 14.32 7.3 −0.6 RRab
84844 3.67 1.60 14.56 8.2 14.82 9.2 −1.3 RRab
58214 2.93 1.27 14.47 7.8 14.71 8.8 −0.6 RRab
55144 3.21 1.40 13.45 4.9 13.70 5.5 −1.2 RRab foreground?
89691 3.44 1.50 14.12 6.7 14.36 7.4 −0.5 RRc
Case 1: found using the P–L relation given by Equation(14)from Muraveva et al.(2015)and the extinctions listed in Table1. c
Case 2: found using the P–L–Z relation of Alonso-García et al.(2015)and assuming a mean[Fe/H]=−1 dex.
Figure 3.VVV near-infrared color–magnitude diagram for the Galactic center region showing the position of the nuclear bulge RR Lyrae(black stars). For comparison, the unreddened outer bulge RR Lyrae Gran et al.(2016)are shown to the left of the color–magnitude diagram(white dots). The direction of the reddening vector is also shown. This vector is afit to the shape of the reddened clump giants, and agrees with the slope measured by Alonso-García et al.
with[Fe/H]∼−2.2 dex.This very metal-poor object is thefirst RR Lyrae that is a likely member of the nuclear star cluster. Knowing its intrinsic color, distance, and extinction (Table2),
we can estimate its visual magnitude,V=29.5 mag, much too
faint and out of reach for current optical instruments.
3.3. Distances
In order to compute distances we also have to take into account the different sources of errors. An important systematic
error is the absolute magnitude scale for the P–L relation. We
make two different assumptions to compute distances, in order to illustrate the uncertainties involved. First(case 1), we use the
P–L relation given by Equation(14) from Muraveva et al.
(2015)that is based on the cleanest sample of Hipparcosand
Hubble Space Telescope RR Lyrae parallaxes, and the
extinctions listed in Table 2, obtaining distances that are
consistent with membership to the Galactic nuclear bulge.
Second (case 2), as the P–L relation also depends on the
chemical composition(the so-called P–L–Z relation), assuming that these RR Lyrae are the debris of Oosterhoff type I globular
clusters, we adopt a mean [Fe/H]=−1.0 dexin the P–L–Z
relation of Alonso-García et al. (2015), as well as a steeper
extinction law from Nishiyama et al. (2009). In this way we
also obtain distances that are consistent with membership to the Galactic nuclear bulge, but larger in the mean by about 500 pc
that in the first case considered above. For both cases Table2
summarizes the RR Lyrae reddenings, extinctions, distance moduli, and distances in kiloparsecs from the Sun, and metallicities. In all this we have also assumed that the photometric VVV zero point error is negligible(<0.01 mag).
The distance distributions of the RR Lyrae in our sample compared with 1019 RR Lyrae type ab recently discovered in the
outer bulge from the VVV survey (Gran et al. 2016) have
consistent peak values. The distribution of the present sample is very concentrated, much more so than the observed distribution of RR Lyrae in the inner and outer bulge. Considering all these uncertainties, we can conclude that most of our RR Lyrae are located at the distance of the Galactic center. Only two of the
brightest ones(VVV-RRL-65743, and VVV-RRL-55144)could
be foreground objects, although we cannot completely discard the possibility that they are blended sources. The two main types of sources that brighten an object in this region would be bulge clump stars(which are redder), or foreground disk stars(which are bluer). However, the colors alone cannot help to distinguish these possibilities, given the large and non-uniform reddening.
4. CONCLUSIONS
For the first time, we find that there are RR Lyrae in the
region well within the nuclear stellar bulge of our Galaxy, suggesting that they could be the remains of the primordial globular clusters that built up the nuclear bulge. The dozen RR Lyrae stars presented here give a limit to the age and metallicity of the nuclear bulge, and thus provide valuable clues about its origin. While there is ample evidence that the stellar population of the nuclear star cluster is composite, containing a mixture of
young, intermediate, and old stellar populations (Genzel
et al. 2010; Schödel et al. 2014; Chatzopoulos et al. 2015),
the RR Lyrae stars we found suggest that the nuclear bulge is very old(>10 Gyr), perhaps as old as the Milky Way itself.
Are these RR Lyrae special in any way? How do they compare with the RR Lyrae previously found in the Milky Way bulge? RR Lyrae are numerous in globular clusters and in the
Milky Way halo, and are taken as prime tracers of old (>10
Gyr), and metal-poor stellar populations. However, not all
globular cluster RR Lyrae are similar. For example, there are
two populations of globular clusters (Oosterhoff 1939;
Catelan2009): the Oosterhoff type I clusters, which are more
metal-rich (−0.9<[Fe/H]<−1.6 dex),and the Oosterhoff
type II clusters, which are more metal-poor ([Fe/
H]<−1.6 dex).With a mean period ofá ñ =P 0.55days, most of the RR Lyrae discovered here are representative of an Oosterhoff type I population(Figure4).
Overall, the properties of the present sample are consistent
with the bulge RR Lyrae population(Gran et al.2016), being
more concentrated to the Galactic center. The evidence supports the scenario where the nuclear stellar bulge was originally made out of a few globular clusters that merged
through dynamical friction (Capuzzo-Dolcetta 1993; Guillard
et al.2016), and as such it could well be the most massive and
oldest surviving star cluster of our Galaxy.
We gratefully acknowledge the use of data from the VVV ESO Public Survey program ID 179.B-2002 taken with the VISTA telescope, and data products from the Cambridge
Astronomical Survey Unit(CASU). The VVV Survey data are
made public at the ESO Archive. Support for the authors is provided by the BASAL Center for Astrophysics and
Associated Technologies (CATA) through grant PFB-06, and
the Ministry for the Economy, Development, and Tourism,
Programa Iniciativa Cientifica Milenio through grant
IC120009, awarded to the Millennium Institute of Astrophysics
(M.A.S.). We acknowledge support from FONDECYT Regular
grants No. 1130196(D.M.), and No. 1150345(M.Z. and F.G.).
We are also grateful to the Aspen Center for Physics, where our work was supported by National Science Foundation grant
Figure 4.Bailey diagram: amplitude vs. period for the nuclear bulge RR Lyrae
PHY-1066293, and by a grant from the Simons Foundation(D. M. and M.Z.).
Facilities: ESO@VISTA.
REFERENCES
Alcock, C., Allsman, R. A., Alves, D. R., et al. 2000,AJ,119, 2194 Alonso-García, J., Dékány, I., Catelan, M., et al. 2015,AJ,149, 99 Antonini, F. 2014,ApJ,794, 106
Antonini, F., Barausse, E., & Silk, J. 2015,ApJ,812, 72
Antonini, F., Capuzzo-Dolcetta, R., Mastrobuono-Battisti, A., & Merritt, D. 2012,ApJ,750, 111
Capuzzo-Dolcetta, R. 1993,ApJ,415, 616
Capuzzo-Dolcetta, R., & Mastrobuono-Battisti, A. 2009,A&A,507, 183 Capuzzo-Dolcetta, R., & Miocchi, P. 2008,MNRAS,388, L69 Cardelli, J. A., Clayton, G. C., & Mathis, J. S. 1989,ApJ,345, 245 Carollo, C. M., Stiavelli, M., Seigar, M., de Zeeuw, P. T., & Dejonghe, H.
2002,AJ,123, 159
Catelan, M. 2009,Ap&SS,320, 261
Chatzopoulos, S., Fritz, T. K., Gerhard, O., et al. 2015,MNRAS,447, 948 Dékány, I., Minniti, D., Catelan, M., et al. 2013,ApJL,776, L19
Feast, M. W., Abedigamba, O. P., & Whitelock, P. A. 2010, MNRAS, 408, L76
Genzel, R., Eisenhauer, F., & Gillessen, S. 2010,RvMP,82, 3121 Gnedin, O. Y., Ostriker, J. P., & Tremaine, S. 2014,ApJ,785, 71
Gonzalez, O. A., Rejkuba, M., Zoccali, M., et al. 2012,A&A,543, A13 Gran, F., Minniti, D., Saito, R. K., et al. 2016,A&A,591, A145 Guillard, N., Emsellem, E., & Renaud, F. 2016,MNRAS,461, 3620 Hartmann, M., Debattista, V. P., Seth, A., Cappellari, M., & Quinn, T. R. 2011,
MNRAS,418, 2697
Launhardt, R., Zylka, R., & Mezger, P. G. 2002,A&A,384, 112 Lotz, J. M., Telford, R., Ferguson, H. C., et al. 2001,ApJ,552, 572 Majaess, D., Turner, D., Dekany, I., Minniti, D., & Gieren, W. 2016, A&A, in
press(arXiv:1607.08623)
Milosavljević, M. 2004,ApJL,605, L13
Minniti, D., Contreras Ramos, R., Alonso-García, J., et al. 2015, ApJL, 810, L20
Minniti, D., Lucas, P. W., Emerson, J. P., et al. 2010,NewA,15, 433 Muraveva, T., Palmer, M., Clementini, G., et al. 2015,ApJ,807, 127 Nataf, D. M., Gonzalez, O. A., Casagrande, L., et al. 2016, MNRAS,
456, 2692
Nishiyama, S., Tamura, M., Hatano, H., et al. 2009,ApJ,696, 1407 Oosterhoff, P. T. 1939, Obs,62, 104
Saito, R. K., Hempel, M., Minniti, D., et al. 2012,A&A,537, A107 Schinnerer, E., Böker, T., Meier, D. S., & Calzetti, D. 2008,ApJL,684, L21 Schödel, R., Feldmeier, A., Neumayer, N., Meyer, L., & Yelda, S. 2014,
CQGra,31, 244007
Tremaine, S. D., Ostriker, J. P., & Spitzer, L., Jr. 1975,ApJ,196, 407 Valenti, E., Zoccali, M., Gonzalez, O. A., et al. 2016,A&A,587, L6 Yang, S.-C., Sarajedini, A., Holtzman, J. A., & Garnett, D. R. 2010,ApJ,