An inverse latitudinal gradient of diversity of peracarid crustaceans along the Pacific Coast of South America: out of the deep south
12
0
0
Texto completo
(2) M. M. Rivadeneira et al. I N TR O D U C TI O N The latitudinal gradient of species richness (LGR) remains one of the most prominent patterns in macroecology and biogeography (Pianka, 1966; Willig et al., 2003; Wiens & Graham, 2005; Mittelbach et al., 2007). Several meta-analyses confirm the pervasiveness of the canonical pattern of species diversity increasing from the poles toward the tropics (Willig et al., 2003; Hillebrand, 2004a,b). While there is an ongoing debate about the underlying mechanisms driving the LGR (Rohde, 1999; Willig et al., 2003), there is growing recognition that ultimately the richness in a region should be determined by a balance between the rates of extinction, migration (i.e. range dynamics) and origination of species (Wiens & Donoghue, 2004; Mittelbach et al., 2007). This balance can be achieved by different mechanisms that can be broadly classified into three types of hypotheses, as proposed by a recent synthesis (Mittelbach et al., 2007): ecological, historical and evolutionary. Ecological hypotheses suggest that tropical areas harbour greater species richness due to environmental effects enhancing productivity, carrying capacity or niche breadth (Currie, 1991; Rosenzweig, 1995; Evans et al., 2005). Historical explanations (also referred to as biogeographical; Mittelbach et al., 2007) invoke the tropics as sources of evolutionary novelties (i.e. clades originated in the tropics, but overall diversification rates are not variable across latitude) and that the LGR is the result of a limited dispersal towards the temperate zones (Wiens & Donoghue, 2004; Wiens & Graham, 2005; Jablonski et al., 2006). Finally, evolutionary hypotheses suggest that the LGR is the result of a latitudinal variation in the diversification rates (although novelties appear evenly across latitude), with higher speciation and/or lower extinction rates in the tropics (Evans et al., 2005; Weir & Schluter, 2007). Despite the differences between historical and evolutionary hypotheses, they both highlight the importance of long-term dynamics explaining the LGR, so we will refer to both of them as historical/evolutionary hypotheses. Despite its generality, exceptions to the canonical LGR are not uncommon in the marine and terrestrial realms (Stevens, 1989; Stephens & Wiens, 2003; Willig et al., 2003; Smith et al., 2005; Kindlmann et al., 2007; Fernández et al., 2009; Pyron & Burbrink, 2009). The temperate Pacific coast of South America (PSA hereafter) is unusual in having many different marine taxa showing an inverse LGR, such as seaweeds (Santelices, 1982; Santelices & Marquet, 1998; Meneses & Santelices, 2000; Santelices et al., 2009), sponges (Desqueyroux & Moyano, 1987), anthozoans (Häussermann & Försterra, 2005), bryozoans (Moyano, 1991), polychaetes (Hernández et al., 2005; Moreno et al., 2006), chitons, bivalves and gastropods (Herm, 1969; Valdovinos et al., 2003; Marquet et al., 2004), and peracarid crustaceans (Lancellotti & Vásquez, 2000; González et al., 2008). The inverse LGR phenomenon holds true across more than 50 degrees of latitude along the PSA, and thus cannot be explained as an artefact of reduced spatial scale (Willig et al., 2003). In addition, analyses strongly suggest that this pattern is robust to sampling artefacts (Santelices, 1982; Valdovinos et al., 2003). 438. Different mutually non-exclusive ecological hypotheses have been proposed to explain the existence of the inverse LGR along the PSA, including a Rapoport rescue effect (i.e. species show shorter geographic ranges along the southern PSA; Santelices & Marquet, 1998; Santelices et al., 2009), a species–area effect (coastal shelf area and coastal length are more extensive along the southern PSA, therefore it can harbour more species; Valdovinos et al., 2003; Santelices et al., 2009) and also a mid-domain effect (the richness gradient is an artefact of the overlapping ranges of distribution within a given area; Hernández et al., 2005; Moreno et al., 2006). Other explanations, including different and more refined forms of the species–energy hypothesis (i.e. niche breadth hypothesis; Vázquez & Stevens, 2004) have not been tested yet. Recently, Fernández et al. (2009) showed that the shape of the LGR along the PSA may be influenced by the type of larval development: molluscs and crustaceans with direct development consistently display an inverse LGR, in contrast to planktotrophic species which follow the canonical pattern of decreasing species richness with increasing latitude. These authors also showed for a limited dataset of peracarids (170 species) that the pattern of richness was mainly associated with sea surface temperature, suggesting that low temperatures in southern Chile may favour population persistence and lower extinction risk due to reduced metabolic costs (Brandt, 1999; Fernández et al., 2009). All these hypotheses are based on correlations between richness and present-day environmental conditions, revealing little information about the influence of historical/evolutionary processes in shaping the LGR (Jablonski et al., 2006; Mittelbach et al., 2007; Araújo et al., 2008). Moreover, recent studies demonstrate that the ‘anomalous’ LGR of some taxa can be explained by historical hypotheses (i.e. historical biogeography and phylogenetic niche conservatism; Stephens & Wiens, 2003; Smith et al., 2005; Pyron & Burbrink, 2009). Antarctica has been considered to act as an ‘evolutionary incubator’ or centre of origin for many taxa, including peracarids (Knox & Lowry, 1977; Watling & Thurston, 1989; Brandt, 1999; Clarke et al., 2004). Furthermore, considering that peracarid richness has been reported to be greater at high latitudes, it is relevant to examine historical/evolutionary hypotheses as a potential explanation for the inverse LGR of peracarids along the PSA. However, suitable fossil records or phylogenetic reconstructions are lacking for marine peracarids along the PSA, precluding a rigorous test of these ideas similar to what has been done for other taxa and regions (Stephens & Wiens, 2003; Smith et al., 2005; Jablonski et al., 2006; Wiens et al., 2006, 2009; Weir & Schluter, 2007; Pyron & Burbrink, 2009). Nevertheless, indirect approaches used by recent studies may also shed light on the possible role of historical/evolutionary explanations in shaping spatial gradients of species richness. For instance, Krug et al. (2008) used taxonomic species–genus ratios to infer the importance of diversification rates across a latitudinal range. In addition, Roy et al. (2009) suggested a marked phylogenetic conservatism of poleward range limits in bivalve genera, using taxonomy as a proxy for phylogeny, lending support to the idea that limited dispersion of taxa of tropical origin may lead to the canonical LGR. The existence of nested assemblages at biogeo-. Global Ecology and Biogeography, 20, 437–448, © 2010 Blackwell Publishing Ltd.
(3) An inverse gradient of latitudinal diversity graphic and higher taxonomic levels may suggest some sort of evolutionary-level dispersal–extinction dynamics as observed in polychaetes along the PSA (Moreno et al., 2006, 2008). Thus, these approaches are ideally suited to provide a preliminary test of historical/evolutionary hypotheses shaping the inverse LGR in peracarids along the PSA. Here we evaluated the processes underlying the inverse LGR reported for marine peracarid crustaceans along the PSA (Lancellotti & Vásquez, 2000; González et al., 2008; Fernández et al., 2009). Our specific goals were: (1) to re-evaluate the existence of the inverse LGR using an expanded dataset, ruling out possible sampling artefacts; (2) to test a suite of different ecological hypotheses (species–energy, species–area, Rapoport rescue effect, geometric constraints and niche breadth) that may account for the encountered pattern; and (3) to test indirectly historical/evolutionary hypotheses (biogeographic conservatism, diversification rates) that examine how long-term dynamics may have contributed to shaping the inverse LGR. ME TH O D S Database The database utilized in this study comprises distributional and ecological information for marine peracarid species of the orders Amphipoda, Cumacea, Isopoda and Tanaidacea reported for the Chilean coast. From a total of 434 known species, the present study includes only the 320 benthic species distributed along the continental Chilean coast between 18° S and 56° S, and inhabiting the coastal shelf and upper slope. For each species the reported northern and southern latitudinal limit of distribution and the minimum and maximum bathymetric distribution were recorded. The information was obtained from an exhaustive literature review, composed of more than 120 published studies summarizing over 150 years of taxonomic and ecological studies in the region (Thiel et al., 2003; González & Thiel, 2004; González et al., 2008). The database containing the latitudinal ranges of distribution of all species used in this study is available in González et al. (2008). Analyses Latitudinal gradient of richness The species richness was calculated as the total number of species co-occurring in latitudinal bins of 2° latitude. We also calculated the mean latitudinal range size, the mean bathymetric range and the mean bathymetric midpoint (all after log10 transformation) of all species co-occurring in the same latitudinal bin. In order to evaluate the possibility that sampling artefacts generated the latitudinal richness pattern we analysed the effect of the year in which the species was described on the shape of the LGR. First, the LGR was recalculated according to the description year of the species, using 50-year intervals. Secondly, we estimated how the chronological addition of newly described. species modified the shape of the LGR during the last c. 150 years. The shape of the LGR was measured as the Pearson moment–product correlation between species richness and latitude, where positive values would represent an inverse LGR. If the existence of the inverse LGR is independent of the completeness of the species inventory, then the pattern should have already been evident in the early phase of peracarid studies along the PSA. Both analyses assume that the latitudinal range of each species was immediately well known at the date of description, which is not warranted for all the species, especially for those with extensive geographic ranges. However, this should not severely bias our analysis, because most species records in the database have short latitudinal ranges, e.g. 65% of species have ranges of ⱕ 5° latitude.. Testing ecological hypotheses A correlation approach was used to test five hypotheses that have been recurrently proposed to explain the LGR. The species– energy hypothesis (Currie, 1991; Evans et al., 2005) was tested using the mean sea surface temperature and the concentration of chlorophyll a (Chl-a) as surrogates of the environmental energy. Mean annual sea surface temperature was obtained from the World Ocean Atlas 2001 and Chl-a from SeaWiFs satellite images. The species–area hypothesis (Rosenzweig, 1995) was tested using the shelf area (< 200 m depth) as a proxy of available habitat, and it was obtained from digitalized maps (1:106 scale Lambert zenithal, azimuthal equal area) (Astorga et al., 2003). The geometric constraint hypothesis or mid-domain effect (Pineda, 1993; Colwell & Hurtt, 1994) was tested using the median number of species expected by a mid-domain null model (10,000 runs), using the module MDE (McCain, 2004). The Rapoport rescue hypothesis (Stevens, 1989) was evaluated using the mean latitudinal range size (after log10 transformation) of all species co-occurring in the same latitudinal bin. Finally, the niche breadth hypothesis (Vázquez & Stevens, 2004) was tested using the mean bathymetric range (after log10 transformation) as a rough proxy for the degree of specialization in species. The rationale behind the use of median bathymetric range is that species concentrated in a narrow bathymetric belt experience less environmental variability (i.e. in terms of temperature, water pressure, food supply and types of substrata) than species having wider bathymetric ranges. Assuming that the bathymetric ranges are under equilibrium, they may reflect the niche requirements of the species. Therefore, the species richness should be negatively related to the median bathymetric range. The association between species richness, oceanographic and ecological variables was explored using both traditional ordinary least square (OLS) and a simultaneous autoregressive model (SARerr) (Dormann et al., 2007; Kissling & Carl, 2008). Analyses were carried out using the library spdev in the software R (R Development Core Team, 2010), following the procedures detailed by Kissling & Carl (2008). The best models were selected using the Akaike information criterion (DAIC < 2).. Global Ecology and Biogeography, 20, 437–448, © 2010 Blackwell Publishing Ltd. 439.
(4) M. M. Rivadeneira et al. Indirect test of historical/evolutionary hypotheses In the absence of suitable fossil records or molecular phylogenies, we conducted indirect tests of the importance of historical/ evolutionary hypotheses (biogeographic conservatism and diversification rates), using three complementary methods: (1) taxonomic distinctness, (2) taxonomic conservatism of latitudinal range midpoint, and (3) nestedness analysis. The taxonomic distinctness index, D+ (Clarke & Warwick, 1998), was used as a coarse proxy of phylogenetic diversity. Briefly, this index measures the degree of taxonomic inter-relatedness between species, and assumes that phylogenetic relationships are mapped in the taxonomic structure. The distinctness corresponds to the average length of the taxonomic distance between each pair of species, which included species, genera, families and orders, assuming a similar branch distance of 1. Higher D+ values imply a taxonomically much more diverse assemblage. The observed D+ values were contrasted against the predictions of a null model, built by resampling the same number of species found in each bin and recalculating the D+ values 10,000 times. Lineage diversity was considered statistically significant when observed values were above or below the 97.5th and 2.5th percentiles. Invariant D+ values (i.e. not departing from the null model) across the latitudinal gradient may imply that the inverse LGR is not directly linked to historical biogeography or evolutionary processes. In contrast, high D+ values (i.e. above the null model) in the southern region could be interpreted as the existence of more evolutionary novelties (i.e. clades) in the southern region, supporting historical biogeography hypotheses. Alternatively, it may imply enhanced speciation rates and/or reduced extinction rates, according to the diversification rate hypothesis. The taxonomic conservatism of the midpoint of latitudinal range (the median between the northern and southern distribution limits of each taxon) was evaluated using taxonomic structure (orders, families, genera) as a coarse proxy of relatedness among species. For simplicity, we have used the midpoint of latitudinal range instead of the predictions of niche models based on climatic variables (Smith et al., 2005; Pyron & Burbrink, 2009; Wiens et al., 2009). This decision is justified by the prevailing north–south direction of the PSA that maps a marked latitudinal gradient in the oceanographic conditions, so each latitudinal bin would represent a unique oceanographic condition. Taxonomic conservatism was evaluated using an autocorrelogram analysis (Moran’s I) computed across different taxonomic levels. Values of Moran’s I close to 1 are indicative of taxonomic conservatism at the midpoint of latitudinal range, e.g. the mean ranges of species within a genus are more similar than would be expected by random distribution. When I = 0, no taxonomic signal is detected, whereas a taxonomic repulsion (i.e. the mean range of species within genera differs significantly from a random distribution) is indicated by values of I = -1. The existence of taxonomic conservatism at the midpoint of latitudinal range, combined with a possible southern origin of many peracarid clades (Knox & Lowry, 1977; Watling & Thurston, 1989; Brandt, 1999; Clarke et al., 2004), may support the biogeographic conservatism hypothesis. Calculations were made 440. using the function correlogram.formula in the library ape in R (R Development Core Team, 2010). The nestedness analysis evaluates the degree of order in the spatial distribution of taxa. Factors that assemble or disassemble species communities from a common pool in a consistent order will lead to a nested structure (Wright et al., 1998). Nestedness is often used in community ecology studies to infer the relative importance of local dispersal–extinction dynamics in shaping the spatial distribution of species (Atmar & Patterson, 1993; Wright et al., 1998). In a nested community, the poorest sites (i.e. those with fewest species) are subsets of the richest sites, and not of the entire pool. The application of nestedness analyses to biogeographic questions is straightforward (Moreno et al., 2006, 2008). In our case, nested assemblages may imply that dispersal– extinction dynamics occur over very large scales, where the poorest regions would be characterized by high extinction rates, so species richness in those zones should be maintained by dispersal and colonization from species-rich regions rather than by in situ speciation or the emergence of evolutionary novelties. We used the robust and conservative discrepancy index (D) as a measure of nestedness (Brualdi & Sanderson, 1999; Ulrich & Gotelli, 2007). To evaluate the significance of the nestedness we used the ‘swap’ algorithm to produce random matrices with a fixed number of rows and columns. Analyses were carried out at species, genus and family levels. A lack of nestedness indicates that the taxonomic composition in areas of low species richness is not a mere subset of the more diverse areas. This may imply the existence of biogeographically different biotas, perhaps exhibiting different ecological and evolutionary features. On the contrary, nested assemblages may indicate the existence of biota with a shared biogeographic history. However, nested assemblages may be created by either biogeographic conservatism or latitudinal variations in diversification rates. Calculations were made using the function oecosimu implemented in the library vegan in R (R Development Core Team, 2010). R ESULTS The species richness showed an inverse latitudinal gradient, with richness increasing towards high latitudes (Figs 1 & 2a). Richness increased about eightfold across the study region, with minimum and maximum values recorded at c. 20° S (18 species) and c. 54° S (136 species), respectively. Most of the change in richness occurred in the northern and southern areas, whereas between 34° S and 50° S the gradient was rather stable. The increase in richness is coupled with a marked poleward decline in the median latitudinal range size, from a range of c. 20° in the northern-central region to a 4° range at the southern tip of the study area (Fig. 2b). In addition, both the mean bathymetric range and the mean bathymetric midpoint of species showed a more than fivefold increase in the poleward direction (Fig. 2c); this is primarily due to the increase in the number of subtidal species with increasing latitude, while numbers of intertidal species vary little across the study area (Fig. 2d). When the gradient was deconstructed according to the year of the first report of the species in Chile, the poleward increase in. Global Ecology and Biogeography, 20, 437–448, © 2010 Blackwell Publishing Ltd.
(5) An inverse gradient of latitudinal diversity Figure 1 Map of the study region, showing the latitudinal distribution of 320 peracarid species studied.. Figure 2 Latitudinal gradient of peracarid diversity along the Pacific coast of South America, for (a) total species richness, (b) mean latitudinal range, (c) bathymetric distribution (mean bathymetric range and mean bathymetric midpoint), and (d) species richness according to bathymetric categories (inter- and subtidal zones). Data for (b) and (c) were estimated after log10 transformation, but they are depicted on a linear scale to facilitate the interpretation of results.. Global Ecology and Biogeography, 20, 437–448, © 2010 Blackwell Publishing Ltd. 441.
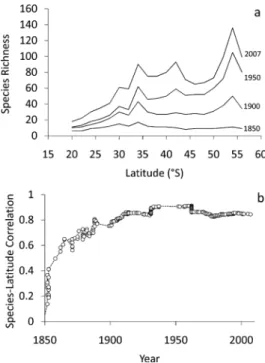
(6) M. M. Rivadeneira et al.. Figure 3 Evaluation of bias introduced by temporal changes in the species description. (a) Temporal changes in the shape of the latitudinal gradient of richness according the year of description of the new species entering to the total inventory, in c. 50 years bins. (b) Changes in the Pearson’s moment–product correlation between the richness and latitude as a function of the description date of new species entering the total inventory.. species richness had been evident as early as 1900. The number of additional species reported between 1950 and 2007 did not change the shape of the gradient (Fig. 3a). The same pattern is also evident looking at the correlation coefficient between species richness and latitude: it has been positive and notably invariant over the last c. 100 years (Fig. 3b). The species richness showed a variable relationship with the explanatory variables used to test the five ecological hypotheses (Table 1). In general, the residuals of the relationship showed a significant spatial autocorrelation. However, the sign of the slopes were not modified by the SARerr modelling, and qualitative similar conclusions were reached using either the traditional OLS regression or the SARerr model (Table 1). The best supported models, according to the DAIC, were sea surface temperature and median latitudinal range size. However, although species richness was strongly related to sea surface temperature (OLS, r2 = 0.74, P < 0.05; Fig. 4a) and showed the lowest AIC, the sign of the coefficient was negative, against the predictions of the species–energy hypothesis. Richness was negatively related to median latitudinal range size (OLS, r2 = 0.68, P < 0.05, Fig. 4b) according to the predictions of the Rapoport rescue hypothesis. Other models were less supported, as the DAIC values were greater than 2. Species richness was positively associated with shelf area (OLS, r2 = 0.58, P < 0.05; Fig. 4c), following the predictions of the species–area hypothesis. Richness was also positively associated with the median bathymetric range (OLS, r2 = 0.55, P < 0.05; Fig. 4d), but the direction of the relationship was 442. opposite to the one predicted by the niche-breadth hypothesis. Richness was not significantly related to Chl-a or the middomain effect (OLS, r2 = 0.02, P > 0.05; r2 = 0.03, P > 0.05, respectively), indicating no support for the species–energy or geometric constraint hypotheses. According to the results of indirect tests, historical/ evolutionary processes can help to explain the observed LGR. First, the taxonomic distinctness index increased poleward (Fig. 5a). The observed D+ values were not different from the null expectation, except at the southern tip where D+ was higher than expected by chance. This trend is associated with the ordinal level patterns of richness (Fig. 5b). The latitudinal trend of species richness was mostly driven by amphipods and isopods, whereas cumaceans and tanaidaceans were present only in the southern region. Secondly, the midpoint of latitudinal range was positively autocorrelated at different taxonomic levels, according to the positive and significant values of Moran’s I (Table 2). Finally, the nestedness analyses showed differences amongst taxonomic levels. At species and genus levels, the assemblage was significantly nested (species, D = 496, Z-score = 5.22, P = 0.002; genus, D = 326, Z-score = 5.08, P < 0.0001). In contrast, no significant pattern was found at the family level (D = 100, Z-score = -1.32, P = 0.136). DISC USSIO N An inverse latitudinal gradient of richness Consistent with previous reports, our analyses support the existence of a strong inverse LGR of peracarid species richness along the Pacific coast of South America (Lancellotti & Vásquez, 2000; González et al., 2008; Fernández et al., 2009). Although a reverse LGR of richness challenges the apparent generality of the pattern of decreasing species diversity within increasing latitude (Willig et al., 2003; Hillebrand, 2004a,b), this result is not entirely unexpected because several exceptions to the classic pattern have been reported (Willig et al., 2003). Indeed, the inverse LGR has been previously reported for marine isopods along the entire Pacific coast of the Americas by Espinosa-Pérez & Hendrickx (2006), although their analyses were conducted at a coarser scale comparing biogeographic provinces. Even though the species inventory in the region can be considered only as a representative fraction of the total peracarid diversity, and new surveys may add species or range extensions of known species (Thiel et al., 2003; González et al., 2008), the presented results suggest it is unlikely that the observed inverse LGR will be affected by these additions (i.e. a better sampling in the southern region). Our analysis confirmed that the inverse LGR should not be severely biased by improvements of the species inventory, as the shape of the gradient was largely independent of the inclusion of new reported species during the last century. Therefore, the latitudinal pattern reported herein appears to reflect the true biogeographic pattern for peracarid crustaceans along the PSA, validating previous results based on a much more restricted subset of peracarid species (Lancellotti & Vásquez, 2000; Fernández et al., 2009).. Global Ecology and Biogeography, 20, 437–448, © 2010 Blackwell Publishing Ltd.
(7) An inverse gradient of latitudinal diversity Table 1 Summary of the ordinary least squares (OLS) and simultaneous autoregressive model (SARerr) regressions between species richness and different ecological variables aimed to test different ecological hypotheses to explain the inverse latitudinal gradient of richness. OLS regression. SARerr regression. Ecological hypothesis. Explanatory variable. Slope. R2. AIC. DAIC. Moran’s I. Slope. AIC. DAIC. Moran’s I. Species–energy Species–energy Species–area Geometric constraint Rapoport’s rule. Sea surface temperature Chlorophyll-a Shelf area Mid-domain effect (log10) Mean latitudinal range (log10) Mean bathymetric range. -6.33 -53.66 1.93 0.24 -130.5. 0.73 0.02 0.58 0.03 0.68. 162.6 187.4 179.2 187.4 166.4. 0 24.8 16.6 24.8 3.8. -0.14 0.74 -0.08 0.74 0.46. -6.05 -2.09 2.45 0.61 -98.09. 154.6 169.1 165.7 166.9 154.8. 0 14.5 11.1 12.3 0.2. -0.08 -0.01 -0.05 0.06 0.09. 93.2. 0.55. 172.9. 10.3. 0.17. 100.03. 158.6. 4. -0.08. Niche breadth. AIC, Akaike information criterion. Significant values (P < 0.05) are in bold.. Figure 4 Relationship between peracarid species richness and (a) sea surface temperature (SST), (b) shelf area, (c) latitudinal range size, and (d) bathymetric range size. Also shown are the values of the ordinary least squares regressions, and Moran’s I after accounting for spatial autocorrelation. ns = non-significant.. Ecological versus historical/evolutionary hypotheses to explain the inverse LGR The long and lasting debate about the ultimate causes of the canonical LGR also applies to an inverse LGR: different ecological (Santelices & Marquet, 1998; Valdovinos et al., 2003; Marquet et al., 2004; Kindlmann et al., 2007; Fernández et al., 2009) and historical/evolutionary explanations have been proposed (Stephens & Wiens, 2003; Valdovinos et al., 2003; Smith et al., 2005; Pyron & Burbrink, 2009). Among the five ecological hypotheses evaluated here, we found strong support for the Rapoport rescue effect and partial support for the species–area hypothesis. These hypotheses have been previously proposed to explain the inverse gradient of richness observed in seaweeds and molluscs, respectively (Santelices & Marquet, 1998; Valdovinos et al., 2003). Other hypotheses, including the species–energy. and mid-domain constraints, have been proposed previously to explain richness patterns in other invertebrates along the study region (Astorga et al., 2003; Hernández et al., 2005), but they were not supported by our analyses. The sign of the relationship between richness, sea surface temperature and median bathymetric range was exactly the opposite of what is predicted by the species–energy (Currie, 1991; Evans et al., 2005) and niche-breadth hypotheses (Vázquez & Stevens, 2004), respectively. This sharp discrepancy may reflect the fact that the underlying processes that lead to these relationships are different from those originally proposed: sea surface temperature is not mirroring energy availability, and bathymetric range is not reflecting local species coexistence. On the one hand, the negative relationship between richness and temperature may result from the fact that many life-history. Global Ecology and Biogeography, 20, 437–448, © 2010 Blackwell Publishing Ltd. 443.
(8) M. M. Rivadeneira et al.. Figure 5 Latitudinal variation of taxonomic structure: (a) taxonomic distinctness, (b) species richness by orders.. Table 2 Results of the autocorrelogram analysis (Moran’s I) used to evaluate the existence of taxonomic conservatism of the midpoint of latitudinal distribution. Taxonomic level. Rescaled Moran’s I. P-value. Species/genera Genera/families Families/orders. 0.289 0.345 0.025. 0.0004 < 0.001 0.0062. traits of Peracarida show a higher performance at cooler temperatures (e.g. reduced costs of brooding, increased longevity and fecundity, and low but prolonged reproductive rates; Brandt, 1999). This k-strategy may allow peracarids to reach larger population sizes, increasing population persistence and probably species diversity by reducing extinction rates at high latitudes (Brandt, 1999; Fernández et al., 2009). On the other hand, the positive relationship between richness and bathymetric distribution may be explained by the well-known eurybathic pattern of this and other marine benthic groups in the Antarctic region (Brey et al., 1996). The wide bathymetric distribution allows species inhabiting coastal areas to survive the effects of ice scouring during glacial cycles, finding refuge in deeper areas of the shelf and slope, hence reducing their extinction risks (Brey et al., 1996; Poulin et al., 2002). Thus, rather than implying contemporaneous ecological processes, these results suggest the importance of evolutionary processes in shaping latitudinal patterns of diversity in peracarids. When the previous evidence is combined with the results of the analyses of the taxonomic distinctness, taxonomic conservatism of latitudinal range midpoint and nestedness, a new picture of the processes involved is revealed: the poleward 444. increase in species richness may be explained by some sort of historical/evolutionary hypothesis (Stephens & Wiens, 2003; Smith et al., 2005; Mittelbach et al., 2007; Pyron & Burbrink, 2009). On the one hand, the so-called ‘biogeographic conservatism hypothesis’ (Pyron & Burbrink, 2009), a more general version of the ‘tropical conservatism hypothesis’ (Wiens & Donoghue, 2004), predicts the origination of new clades at the higher-diversity zones (either tropical or temperate) and a recent and restricted dispersal towards low-diversity zones due to phylogenetic niche conservatism (Stephens & Wiens, 2003; Smith et al., 2005; Pyron & Burbrink, 2009). This hypothesis is conceptually similar to the ‘out of the tropics’ hypothesis proposed by Jablonski and collaborators (Jablonski et al., 2006) and is confirmed in some marine invertebrates (Martin et al., 2007; Krug et al., 2008; Roy et al., 2009). On the other hand, the evolutionary hypotheses predict latitudinal variation in evolutionary rates, e.g. higher speciation and/or lower extinction rates at the high-diversity zones (Mittelbach et al., 2007; Weir & Schluter, 2007). Although our current approach does not allow us to weigh the effects of historical and evolutionary hypotheses separately, the results highlight the potential role played by processes operating over long temporal scales in shaping the inverse LGR of peracarid species along the PSA. The biogeographic conservatism hypothesis is supported by the larger values of the distinctness index at the southern tip, suggesting a kind of ‘museum effect’ of accumulation of older clades. This idea is further supported by the general notion of a high diversity and evolutionary success of peracarids around the southern ocean (Knox & Lowry, 1977; Watling & Thurston, 1989; Brandt, 1999; Clarke et al., 2004), and by the existence of nested assemblages at species and genus level, which suggest that clades present in the northern region are a subset of the southern biota. Indeed, there are two orders, Cumacea and Tanaidacea, that are largely absent in the northern region. However, this does not mean that evolutionary novelties are not present in the northern region. Indeed, the lack of a nested pattern at family level is explained by a considerable number of families restricted to the northern zone. Nevertheless, the restricted distribution of most of the southern clades is also reflected in a strong taxonomic conservatism of the midpoint of latitudinal range, suggesting that perhaps phylogenetic conservatism of the upper thermal tolerance of species has restricted more extensive expansion of these clades towards the northern region across evolutionary time-scales. Latitudinal variations in evolutionary rates can also potentially explain the inverse LGR. The taxonomic distinctness may, alternatively, reflect higher diversification rates at areas harbouring more diversity, as suggested in marine bivalves inhabiting tropical areas (Krug et al., 2008). This idea is also supported by accumulation of short-ranged species in the southern region (the Rapoport rescue effect), as the result of the high habitat fragmentation induced by glacial–interglacial cycles occurring in the region since the Pliocene (Valdovinos et al., 2003; Marquet et al., 2004). Furthermore, the existence of a positive relationship between richness, shelf area (Valdovinos et al., 2003; Marquet et al., 2004; Fernández et al., 2009) and habitat. Global Ecology and Biogeography, 20, 437–448, © 2010 Blackwell Publishing Ltd.
(9) An inverse gradient of latitudinal diversity heterogeneity (Santelices et al., 2009) provides support for this hypothesis. Speciation rate should increase in larger areas (Losos & Schluter, 2000), because larger areas may harbour more habitats and also increase the probabilities of disrupting genetic flow among populations. In parallel to a reduced speciation rate, local and regionalscale extinctions may also be higher in the northern region. We hypothesize that the existence of a shallow oxygen minimum zone (OMZ) and cyclic El Niño (EN) events would be major mechanisms increasing extinction probabilities in this zone. A very shallow OMZ has been described for the Peru–Chile region up to c. 37° S (Morales et al., 1999; Helly & Levin, 2004), the upper boundary of the OMZ can reach depths as shallow as 20 m (Helly & Levin, 2004) and the anoxic conditions recorded within the OMZ suppress macrobenthic diversity in the region (Levin et al., 2002, 2003; Palma et al., 2005). The importance of the OMZ in shaping large-scale diversity patterns in the northern region is suggested by the fact that bathymetric distributions of species are mostly restricted to inter-tidal habitats (Fig. 2d). Notably, the prevalence of intertidal over subtidal species is reversed at c. 37° S, precisely the southern limit of the shallow OMZ in the south-eastern Pacific (Helly & Levin, 2004). The shallow OMZ has operated at least since the early Pleistocene along the PSA (Emeis et al., 1991), so it is possible that the low incidence of species inhabiting deeper waters may have existed since several million years ago. Additionally, the strong impact of EN at physiological, population and ecosystem levels (Thiel et al., 2007) may also suppress the intertidal species richness north of 35° S (Fig. 2d), particularly via thermal stress. EN may have existed in the region since the Pliocene (Mohtadi et al., 2006; Ragaini et al., 2008), and therefore it may be forcing the shallow water diversity not only at ecological but also at evolutionary time-scales. In the southern region, the advances of ice lobes should have covered the entire coast during glacial times (Glasser et al., 2008), forcing the extinction of many shallow water benthic species (Rivadeneira & Marquet, 2007); only eurybathic species may have endured during the harsher glacial times, finding refuge in deeper areas of the shelf or the slope. This idea is further supported by two findings: (1) deeper bathymetric distributions in the southern region (Fig. 2c) and the prevalence of subtidal forms (Fig. 2d), and (2) the positive relationship between richness and the mean bathymetric range of species (Fig. 3d). CO N C L U D I N G R E M A R K S When studied in isolation, traditional hypotheses and approaches used to explain the LGR phenomenon offer little insight about the processes shaping spatial biodiversity patterns. The application of indirect tests evaluating the importance of ecological and historical/evolutionary hypotheses, coupled with information describing environmental variations over geological time-scales, offer a new integrative picture of the processes moulding the inverse gradient of peracarid species richness. We suggest that the inverse LGR of peracarid species may be explained by processes operating at long temporal scales, mixing. elements of historical and evolutionary hypotheses (sensu Mittelbach et al., 2007) that we term the ‘out of the deep south’ hypothesis, which combines three key elements: (1) a highlatitude origin for many clades of peracarids with deep bathymetric distributions, (2) a strong taxonomic conservatism of the latitudinal distribution, restricting the dispersal of taxa towards lower latitudes, and (3) latitudinal variations in the evolutionary rates, with higher speciation rates and/or lower extinction rates towards higher latitudes. Future phylogenetic and phylogeographic analyses may validate these ideas. For instance, phylogenetic information of monophyletic taxa may be used to: (1) reconstruct the ancestral region of origin (Clark et al., 2008), validating the idea of a high-latitude (i.e. Antarctic) origin of the group; (2) evaluate the existence of phylogenetic conservatism in the geographic niche of the species, which can explain the limited dispersal towards lower latitudes (Wiens & Graham, 2005); (3) evaluate the timing of clade dispersal and its coincidence with the late Neogene global cooling; and (4) estimate diversification rates across the latitudinal gradient (Ricklefs, 2007). Since many of the patterns reported here may also hold in other taxa and regions exhibiting the inverse latitudinal gradient, the processes inferred may provide a general framework to understand the processes shaping large-scale patterns of marine biodiversity.. AC K NO WL EDGEMENTS Information on chlorophyll-a was kindly provided by Bernardo Broitman. Two anonymous referees provided extremely useful and constructive comments that greatly improved the manuscript. We are grateful to Emmett Clarkin for revising the English of the final manuscript. This contribution was funded by projects FONDECYT 11070147, 1010356 and FONDAPFONDECYT 1501-0001.. R EF ER ENC ES Araújo, M.B., Nogués-Bravo, D., Diniz-Filho, J.A.F., Haywood, A.M., Valdes, P.J. & Rahbek, C. (2008) Quaternary climate changes explain diversity among reptiles and amphibians. Ecography, 31, 8–15. Astorga, A., Fernandez, M., Boschi, E.E. & Lagos, N. (2003) Two oceans, two taxa and one mode of development: latitudinal diversity patterns of South American crabs and test for possible causal processes. Ecology Letters, 6, 420– 427. Atmar, W. & Patterson, B.D. (1993) The measure of order and disorder in the distribution of species in fragmented habitat. Oecologia, 96, 373–382. Brandt, A. (1999) On the origin and evolution of Antarctic Peracarida (Crustacea, Malacostraca). Scientia Marina, 63, 261–274. Brey, T., Dahm, C., Gorny, M., Klages, M., Stiller, M. & Arntz, W.E. (1996) Do Antarctic benthic invertebrates show an extended level of eurybathy? Antarctic Science, 8, 3–6.. Global Ecology and Biogeography, 20, 437–448, © 2010 Blackwell Publishing Ltd. 445.
(10) M. M. Rivadeneira et al. Brualdi, R.A. & Sanderson, J.G. (1999) Nested species subsets, gaps, and discrepancy. Oecologia, 119, 256–264. Clark, J.R., Ree, R.H., Alfaro, M.E., King, M.G., Wagner, W.L. & Roalson, E.H. (2008) A comparative study in ancestral range reconstruction methods: retracing the uncertain histories of insular lineages. Systematic Biology, 57, 693–707. Clarke, A., Aronson, R.B., Crame, J.A., Gili, J.-M. & Blake, D.B. (2004) Evolution and diversity of the benthic fauna of the Southern Ocean continental shelf. Antarctic Science, 16, 559– 568. Clarke, K.R. & Warwick, R.M. (1998) A taxonomic distinctness index and its statistical properties. Journal of Applied Ecology, 35, 523–531. Colwell, R.K. & Hurtt, G.C. (1994) Nonbiological gradients in species richness and a spurious Rapoport effect. The American Naturalist, 144, 570–595. Currie, D.J. (1991) Energy and large-scale patterns of animalspecies and plant-species richness. The American Naturalist, 137, 27–49. Desqueyroux, R. & Moyano, H. (1987) Zoogeografia de demospongias chilenas. Boletin de la Sociedad de Biologia de Concepción, 58, 39–66. Dormann, C.F., McPherson, J.M., Araújo, M.B., Bivand, R., Bolliger, J., Carl, G., Davies, R.G., Hirzel, A., Jetz, W., Kissling, W.D., Kühn, I., Ohlemüller, R., Peres-Neto, P.R., Reineking, B., Schröder, B., Schurr, F.M. & Wilson, R. (2007) Methods to account for spatial autocorrelation in the analysis of species distributional data: a review. Ecography, 30, 609– 628. Emeis, K.C., Whelan, J.K. & Tarafa, M. (1991) Sedimentary and geochemical expressions of oxic and anoxic conditions on the Peru shelf. Modern and ancient continental shelf anoxia (ed. by R.V. Tyson and T.H. Pearson. Geological Society Special Publication, 58, 1–24. Espinosa-Pérez, M.D. & Hendrickx, M.E. (2006) A comparative analysis of biodiversity and distribution of shallow-water marine isopods (Crustacea : Isopoda) from polar and temperate waters in the East Pacific. Belgian Journal of Zoology, 136, 219–247. Evans, K.L., Warren, P.H. & Gaston, K.J. (2005) Species–energy relationships at the macroecological scale: a review of the mechanisms. Biological Reviews, 80, 1–25. Fernández, M., Astorga, A., Navarrete, S.A., Valdovinos, C. & Marquet, P.A. (2009) Deconstructing latitudinal species richness patterns in the ocean: does larval development hold the clue? Ecology Letters, 12, 601–611. Glasser, N.F., Jansson, K.N., Harrison, S. & Kleman, J. (2008) The glacial geomorphology and Pleistocene history of South America between 38° S and 56° S. Quaternary Science Reviews, 27, 365–390. González, E.R. & Thiel, M. (2004) Indice bibliográfico sobre biodiversidad acuática de Chile: Crustáceos Peracáridos (Crustácea). Ciencia y Tecnología del Marina, 27, 133–150. González, E.R., Haye, P.A., Balanda, M. & Thiel, M. (2008) Lista sistematica de especies de peracaridos de Chile (Crustacea, Eumalacostraca). Gayana, 72, 157–177. 446. Häussermann, V. & Försterra, G. (2005) Distribution patterns of Chilean shallow-water sea anemones (Cnidaria : Anthozoa : Actiniaria, Corallimorpharia), with a discussion of the taxonomic and zoogeographic relationships between the actinofauna of the South East Pacific, the South West Atlantic and the Antarctic. Scientia Marina, 69, 91–102. Helly, J.J. & Levin, L.A. (2004) Global distribution of naturally occurring marine hypoxia on continental margins. DeepSea Research Part I: Oceanographic Research Papers, 51, 1159– 1168. Herm, D. (1969) Marines Pliozän und Pleistozän in Nord-und Mittel-Chile unter besonderer Berücksichtigung der Entwicklung der Mollusken-Faunen. Zitteliana, 2, 1–159. Hernández, C.E., Moreno, R.A. & Rozbaczylo, N. (2005) Biogeographical patterns and Rapoport’s rule in southeastern Pacific benthic polychaetes of the Chilean coast. Ecography, 28, 363–373. Hillebrand, H. (2004a) On the generality of the latitudinal diversity gradient. The American Naturalist, 163, 192– 211. Hillebrand, H. (2004b) Strength, slope and variability of marine latitudinal gradients. Marine Ecology Progress Series, 273, 251– 267. Jablonski, D., Roy, K. & Valentine, J.W. (2006) Out of the tropics: evolutionary dynamics of the latitudinal diversity gradient. Science, 314, 102–106. Kindlmann, P., Schödelbauerová, I. & Dixon, A.F. (2007) Inverse latitudinal gradients in species diversity. Scaling biodiversity (ed. by D. Storch, P.A. Marquet and J.H. Brown), pp. 246–257. Cambridge University Press, Cambridge. Kissling, W.D. & Carl, G. (2008) Spatial autocorrelation and the selection of simultaneous autoregressive models. Global Ecology and Biogeography, 17, 59–71. Knox, G.A. & Lowry, J.K. (1977) A comparison between the benthos of the Southern Ocean and the North Polar Ocean with special reference to the Amphipoda and the Polychaeta. Polar oceans (ed. by M.J. Dunbar), pp. 423–462. Arctic Institute of North America, Calgary. Krug, A.Z., Jablonski, D. & Valentine, J.W. (2008) Species–genus ratios reflect a global history of diversification and range expansion in marine bivalves. Proceedings of the Royal Society B: Biological Sciences, 275, 1117–1123. Lancellotti, D.A. & Vásquez, J.A. (2000) Zoogeography of benthic macroinvertebrates of the Chilean coast: contribution for marine conservation. Revista Chilena De Historia Natural, 73, 99–129. Levin, L.A. (2003) Oxygen minimum zone benthos: adaptation and community response to hypoxia. Oceanography and Marine Biology: an Annual Review, 41, 1–45. Levin, L., Gutierrez, D., Rathburn, A., Neira, C., Sellanes, J., Munoz, P., Gallardo, V. & Salamanca, M. (2002) Benthic processes on the Peru margin: a transect across the oxygen minimum zone during the 1997–98 El Niño. Progress in Oceanography, 53, 1–27. Losos, J.B. & Schluter, D. (2000) Analysis of an evolutionary species–area relationship. Nature, 408, 847–850.. Global Ecology and Biogeography, 20, 437–448, © 2010 Blackwell Publishing Ltd.
(11) An inverse gradient of latitudinal diversity McCain, C.M. (2004) Mid-domain null. User’s guide and application. Available at: http://spot.colorado.edu/~mccainc/ MidDomainNull.htm (accessed 5 October 2010). Marquet, P.A., Fernández, M., Navarrete, S.A. & Valdovinos, C. (2004) Diversity emerging: toward a deconstruction of biodiversity patterns. Frontiers of biogeography: new directions in the geography of nature (ed. by M. Lomolino and L. Heaney), pp. 191–209. Cambridge University Press, Cambridge. Martin, P.R., Bonier, F. & Tewksbury, J.J. (2007) Revisiting Jablonski (1993): cladogenesis and range expansion explain latitudinal variation in taxonomic richness. Journal of Evolutionary Biology, 20, 930–936. Meneses, I. & Santelices, B. (2000) Patterns and breaking points in the distribution of benthic algae along the temperate Pacific coast of South America. Revista Chilena De Historia Natural, 73, 615–623. Mittelbach, G.G., Schemske, D.W., Cornell, H.V. et al. (2007) Evolution and the latitudinal diversity gradient: speciation, extinction and biogeography. Ecology Letters, 10, 315– 331. Mohtadi, M., Hebbeln, D., Ricardo, S.N. & Lange, C.B. (2006) El Niño-like pattern in the Pacific during marine isotope stages (MIS) 13 and 11? Paleoceanography, 21, PA1015. Morales, C.E., Hormazabal, S.E. & Blanco, J.L. (1999) Interannual variability in the mesoscale distribution of the depth of the upper boundary of the oxygen minimum layer off northern Chile (18–24S): implications for the pelagic system and biogeochemical cycling. Journal of Marine Research, 57, 909–932. Moreno, R.A., Hernández, C.E., Rivadeneira, M.M., Vidal, M.A. & Rozbaczylo, N. (2006) Patterns of endemism in southeastern Pacific benthic polychaetes of the Chilean coast. Journal of Biogeography, 33, 750–759. Moreno, R.A., Rivadeneira, M.M., Hernández, C.E., Sampértegui, S. & Rozbaczylo, N. (2008) Do Rapoport’s rule, the mid-domain effect or the source–sink hypotheses predict bathymetric patterns of polychaete richness on the Pacific coast of South America? Global Ecology and Biogeography, 17, 415–423. Moyano, H. (1991) Bryozoa marinos chilenos VIII: una síntesis zoogeográfica con consideraciones sistemáticas y la descripción de diez especies y dos géneros nuevos. Gayana Zoología, 55, 305–389. Palma, M., Quiroga, E., Gallardo, V.A., Arntz, W., Gerdes, D., Schneider, W. & Hebbeln, D. (2005) Macrobenthic animal assemblages of the continental margin off Chile (22 degrees to 42 degrees S). Journal of the Marine Biological Association of the United Kingdom, 85, 233–245. Pianka, E.R. (1966) Latitudinal gradients in species diversity: a review of concepts. The American Naturalist, 100, 33–46. Pineda, J. (1993) Boundary effects on the vertical ranges of deep-sea benthic species. Deep Sea Research Part I: Oceanographic Research Papers, 40, 2179–2192. Poulin, E., Palma, A.T. & Feral, J.P. (2002) Evolutionary versus ecological success in Antarctic benthic invertebrates. Trends in Ecology and Evolution, 17, 218–222.. Pyron, R.A. & Burbrink, F.T. (2009) Can the tropical conservatism hypothesis explain temperate species richness patterns? An inverse latitudinal biodiversity gradient in the New World snake tribe Lampropeltini. Global Ecology and Biogeography, 18, 406–415. R Development Core Team (2010) R: a language and environment for statistical computing. R Foundation for Statistical Computing, Vienna. Ragaini, L., Di Celma, C. & Cantalamessa, G. (2008) Warmwater mollusc assemblages from northern Chile (Mejillones Peninsula): new evidence for permanent El Nino-like conditions during Pliocene warmth? Journal of the Geological Society, 165, 1075–1084. Ricklefs, R.E. (2007) Estimating diversification rates from phylogenetic information. Trends in Ecology and Evolution, 22, 601–610. Rivadeneira, M.M. & Marquet, P.A. (2007) Selective extinction of late Neogene bivalves on the temperate Pacific coast of South America. Paleobiology, 33, 455–468. Rohde, K. (1999) Latitudinal gradients in species diversity and Rapoport’s rule revisited: a review of recent work and what can parasites teach us about the causes of the gradients? Ecography, 22, 593–613. Rosenzweig, M.L. (1995) Species diversity in space and time. Cambridge University Press, Cambridge. Roy, K., Hunt, G., Jablonski, D., Krug, A.Z. & Valentine, J.W. (2009) A macroevolutionary perspective on species range limits. Proceedings of the Royal Society B: Biological Sciences, 276, 1485–1493. Santelices, B. (1982) Caracterización fitogeográfica de la costa temperada del Pacífico de Sudamérica. Verificación de hipótesis y consecuencias ecológicas. Archivos de Biología y Medicina Experimentales (Chile), 15, 513–524. Santelices, B. & Marquet, P.A. (1998) Seaweeds, latitudinal diversity patterns, and Rapoport’s rule. Diversity and Distributions, 4, 71–75. Santelices, B., Bolton, J.J. & Meneses, I. (2009) Marine algal communities. Marine macroecology (ed. by J.D. Whitman and K. Roy), pp. 153–192. Chicago University Press, Chicago, IL. Smith, S.A., Stephens, P.R. & Wiens, J.J. (2005) Replicate patterns of species richness, historical biogeography, and phylogeny in Holarctic treefrogs. Evolution, 59, 2433– 2450. Stephens, P.R. & Wiens, J.J. (2003) Explaining species richness from continents to communities: the time-for-speciation effect in emydid turtles. The American Naturalist, 161, 112– 128. Stevens, G.C. (1989) The latitudinal gradient in geographical range – how so many species coexist in the tropics. The American Naturalist, 133, 240–256. Thiel, M., Gonzalez, E.R., Balanda, M., Haye, P., Heard, R. & Watling, L. (2003) Diversity of Chilean peracarids (Crustacea: Malacostraca). Contributions to the study of East-Pacific crustaceans (ed. by M.E. Hendrickx), p. 303. Instituto de Ciencias del Mar y Limnología, México.. Global Ecology and Biogeography, 20, 437–448, © 2010 Blackwell Publishing Ltd. 447.
(12) M. M. Rivadeneira et al. Thiel, M., Macaya, E.C., Acuña, E. et al. (2007) The Humboldt current system of northern and central Chile: oceanographic processes, ecological interactions and socioeconomic feedback. Oceanography and Marine Biology: an Annual Review, 45, 195–344. Ulrich, W. & Gotelli, N.J. (2007) Null model analysis of species nestedness patterns. Ecology, 88, 1824–1831. Valdovinos, C., Navarrete, S.A. & Marquet, P.A. (2003) Mollusk species diversity in the Southeastern Pacific: why are there more species towards the pole? Ecography, 26, 139–144. Vázquez, D.P. & Stevens, R.D. (2004) The latitudinal gradient in niche breadth: concepts and evidence. The American Naturalist, 164, E1–E19. Watling, L. & Thurston, M.H. (1989) Antarctica as an evolutionary incubator: evidence from the cladistic biogeography of the amphipod family Iphimediidae. Origins and evolution of Antarctic biota (ed. by J.A. Crame), Geological Society Special Publication. 47, 297–313. Weir, J.T. & Schluter, D. (2007) The latitudinal gradient in recent speciation and extinction rates of birds and mammals. Science, 315, 1574–1576. Wiens, J.J. & Donoghue, M.J. (2004) Historical biogeography, ecology and species richness. Trends in Ecology and Evolution, 19, 639–644. Wiens, J.J. & Graham, C.H. (2005) Niche conservatism: integrating evolution, ecology, and conservation biology. Annual Review of Ecology, Evolution and Systematics, 36, 519– 539. Wiens, J.J., Graham, C.H., Moen, D.S., Smith, S.A. & Reeder, T.W. (2006) Evolutionary and ecological causes of the latitudinal diversity gradient in hylid frogs: treefrog trees unearth. 448. the roots of high tropical diversity. The American Naturalist, 168, 579–596. Wiens, J.J., Sukumaran, J., Pyron, R.A. & Brown, R.M. (2009) Evolutionary and biogeographic origins of high tropical diversity in Old World frogs (Ranidae). Evolution, 63, 1217–1231. Willig, M.R., Kaufman, D.M. & Stevens, R.D. (2003) Latitudinal gradients of biodiversity: pattern, process, scale, and synthesis. Annual Review of Ecology, Evolution and Systematics, 34, 273– 309. Wright, D.H., Patterson, B.D., Mikkelson, G.M., Cutler, A. & Atmar, W. (1998) A comparative analysis of nested subset patterns of species composition. Oecologia, 113, 1–20. B IO SK ETC HES The authors are interested in understanding the processes that shape marine biodiversity. They have used the Chilean coast as model system. Using a range of approaches, including palaeontology, phylogeography, ecology, ethology and traditional taxonomy, they explore historical and current processes. Their studies incorporate a wide diversity of taxa in the quest to uncover the factors influencing the distribution of these organisms along the Chilean coast. Author contributions: P.A.H and M.M.R. conceived the idea; P.A.H., E.G and M.T. assembled the database; M.M.R. analysed the data; M.M.R, P.A.H. and M.T. wrote the paper. Editor: Tim Blackburn. Global Ecology and Biogeography, 20, 437–448, © 2010 Blackwell Publishing Ltd.
(13)
Figure


Documento similar
In the preparation of this report, the Venice Commission has relied on the comments of its rapporteurs; its recently adopted Report on Respect for Democracy, Human Rights and the Rule
Our results here also indicate that the orders of integration are higher than 1 but smaller than 2 and thus, the standard approach of taking first differences does not lead to
In the “big picture” perspective of the recent years that we have described in Brazil, Spain, Portugal and Puerto Rico there are some similarities and important differences,
Also the image displayed on the royal sea1 was adapted to fit the new situation: The traditional depiction of the king killing a lion was replaced by an updated design that
Díaz Soto has raised the point about banning religious garb in the ―public space.‖ He states, ―for example, in most Spanish public Universities, there is a Catholic chapel
teriza por dos factores, que vienen a determinar la especial responsabilidad que incumbe al Tribunal de Justicia en esta materia: de un lado, la inexistencia, en el
Supplementary Figure 4 | Maximum Likelihood Loliinae tree cladograms (combined plastome + nuclear 35S rDNA cistron) showing the relationships among the studied samples in each of
No obstante, como esta enfermedad afecta a cada persona de manera diferente, no todas las opciones de cuidado y tratamiento pueden ser apropiadas para cada individuo.. La forma
