TítuloCommon evolutionary origin and birth and death process in the replication independent histone H1 isoforms from vertebrate and invertebrate genomes
19
0
0
Texto completo
(2) Introduction Histones are a small set of basic proteins found in all eukaryotic organisms and are involved in DNA packaging as well as in the regulation of gene expression. Based on structural and functional criteria, histones can be subdivided into core histones (H2A, H2B, H3, H4) and linker histone (H1). The synthesis of histone mRNAs is tighly coordinated with DNA replication for the assembly of chromatin from newly replicated DNA (Isenberg 1979; Marzluff 1992). A unique feature of these histone mRNAs is their lack of polyadenylation tails, which are replaced by a stem-loop signal followed by a purine-rich segment that is recognized by U7 snRNP. The regulation of these replication-dependent (RD) or somatic histones results in a large increase in histone mRNAs as cells progress from G1 to S phase. In addition, there is a small fraction of isolated single-copy histone genes that are expressed uncoupled with the cell cycle in nonproliferating cells. They are referred to as replication-independent (RI) or replacement histones (Doenecke et al. 1997). These RI histones are encoded by polyadenylated mRNAs, whose expression is mediated by the poly (A) binding protein and is related to the stability of mRNAs. The H1 multigene family encodes linker histones which, in addition to their structural role as an integral part of the chromatosome (Simpson 1978), also exhibit a regulatory role in transcription. This functional role can be either repressive (Khochbin and Wolffe 1994; Wolffe et al. 1997) or of an activation nature (Harvey and Downs 2004). Among the five histone families, the H1 family shows the greatest diversity of subtypes, which in mammals consist of five somatic (H1.1–H1.5), a spermatogenesis-specific (H1t), an oocyte-specific (H1oo), and a replacement (H1°) subtype (Albig et al. 1997a; Wang et al. 1997; Tanaka et al. 2001). This diversity is also observed in other vertebrates, which initially includes other differentiation-specific subtypes such as histone H5 from birds (Ruiz-Carrillo et al. 1983), histone H1° (Brocard et al. 1997), and the oocytespecific subtype B4 or H1M (maternal) protein (Dimitrov et al. 1993) from amphibians. In the case of invertebrates there are fewer H1 isoforms which include somatic and stage-specific subtypes (Hentschel and Birnstiel 1981; Maxson et al. 1983). In addition, several stress-specific histone H1 subtypes have been described in plants (Chabouté et al. 1993). Differentiation-specific H1 subtypes have also been identified in sea urchins (Lieber et al. 1988; Poccia and Green 1992), annelids (del Gaudio et al. 1998), mollusks (Ausio 1999; Eirín-López et al. 2002, 2004a), crustaceans (Barzotti et al. 2000), and insects (Hankeln and Schmidt 1993). With the exception of the H1δ gene from sea urchin, in which polyadenylated H1 transcripts were revealed by Northern blot experiments, the RI status of other invertebrate diferentiation-specific H1 genes has never been fully demonstrated. Histone H1 is the fastest-evolving histone class (Isenberg 1978), and purifying selection certainly plays a critical role in maintaining their protein homogeneity. The long-term evolution of these proteins has been classically explained by concerted evolution (Kedes 1979; Henstchel and Birnstiel 1981; Coen et al. 1982; Ohta 1983; Holt and Childs 1984; Schienman et al. 1998). However, we have recently shown that H1 genes are substantially divergent at the nucleotide level and that H1 proteins cluster by type in the phylogenies, indicating that they are no more closely related within than between species. Thus, the diversification of the H1 isoforms seems to be primarily enhanced by mutation and selection, where genes are subject to birth-anddeath evolution under strong purifying selection (Eirín-López et al. 2004b). Although birth-and-death evolution (Nei and Hughes 1992; Nei et al. 1997, 2000) best describes the general long-term evolutionary pattern in RD H1 genes, the mechanisms involved in the evolution of RI H1 isoforms still remain unclear. In the present work, we provide evidence that the mussel Mytilus galloprovincialis histone H1 “orphon” genes are polyadenylated and share common molecular and evolutionary features with vertebrate RI H1 isoforms. The mode of long-term evolution of these genes is investigated here and compared with the birth-and-death process operating in their somatic RD counterparts..
(3) Materials and methods RT-PCR and transcript analyses of invertebrate RI H1 genes Total RNA extracts from frozen adult mussels were prepared using the Ultraspec-II RNA isolation kit (Biotecx), following the manufacturer’s instructions. Poly (A)-rich RNA was prepared using the mRNA purification kit (Amersham Pharmacia Biotech), also following the accompanying instructions for use. RTPCR analyses were performed by using the partial set of primers specific for Mytilus histone genes, described by Eirín-López et al. (2002). Electrophoretic separation of RNA and blotting onto nylon membranes was performed as described by Sambrook et al. (1989). Blots were hybridized with radiolabeled probes specific for each of the M. galloprovincialis histone genes. Hybridization conditions were 55°C for 20–30 h in 5 × SSC, 0.25% SDS, 5 × Denhardt’s 50% formamide, and 0.1 mg/mL denatured salmon sperm DNA. Four posthybridization washes were performed, for 15 min each; the first two were carried out at room temperature in 2 × SSC/0.1% SDS, and the final two at 65°C in 0.2 × SSC/0.1% SDS. Molecular evolutionary analysis We have analyzed all the nonredundant RI H1 nucleotide sequences from vertebrates listed in the NHGRI/NCBI Histone Sequence Database as of April 2004 (Sullivan et al. 2002) together with mussel Mytilus “orphon” H1 sequences (Eirín-López et al. 2002) and the RI H1δ gene from the sea urchin Strongylocentrotus purpuratus (Lieber et al. 1988). In addition, nonredundant RD H1 sequences were also included in the analyses for comparison (see table in Supplementary Material). The nomenclature of the sequences corresponding to the histone H1 subtypes was adapted to the numeric nomenclature from Doenecke’s laboratory (Albig et al. 1997b). Alignments of nucleotide sequences were constructed on the basis of the translated amino acid sequences using the programs BIOEDIT (Hall 1999) and CLUSTAL_X (Thompson et al. 1997). The alignments were checked for errors by visual inspection. A total of 104 histone H1 sequences from 32 different species, containing 18 RI H1 sequences belonging to 12 different species and 86 RD H1 sequences from 26 different species, were used in this analysis. Molecular evolutionary analyses were performed using the computer program MEGA version 2.1 (Kumar et al. 2001), where uncorrected p distances were used to measure the extent of sequence divergence in both nucleotide and deduced amino acid sequences. The number of synonymous (pS) and nonsynonymous (pN ) nucleotide differences per site was also computed using the modified method of Nei-Gojobori (Zhang et al. 1998). Amino acid and nucleotide distances were estimated using the pairwise deletion option, with standard errors calculated by the bootstrap method (1000 replicates). Phylogenetic trees were reconstructed using the neighbor-joining method (Saitou and Nei 1987), and the reliability of the resulting topologies was tested by both the bootstrap and the interior branch-test methods (Felsenstein 1985; Rzhetsky and Nei 1992; Sitnikova 1996), producing the bootstrap probability (BS) and the confidence probability (CP), respectively, for each interior branch. Phylogenetic trees were rooted using the histone H1 from the protist Entamoeba histolytica, one of the most primitive eukaryotes for which an H1-related protein has been characterized (Kasinsky et al. 2001).. Results Identification of invertebrate “orphon” RI H1 gene transcripts To assess the functionality of all the histone genes of M. galloprovincialis and the polyadenylated status of their transcripts, RT-PCR amplifications from poly (A)-rich RNA were performed by using the partial set of primers (see Materials and methods) indicated in Fig. 1A. An amplified fragment of the expected size was.
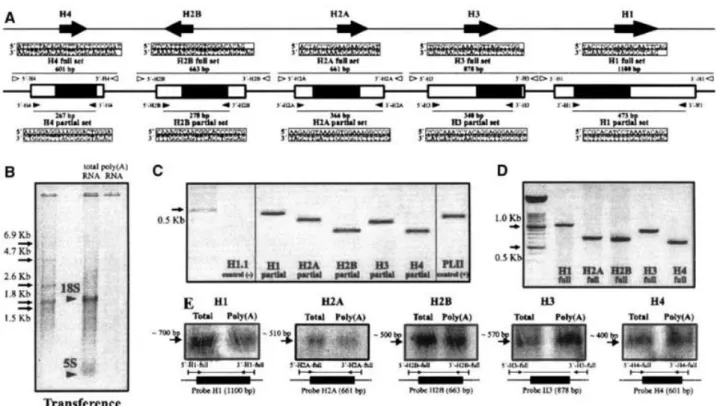
(4) obtained from the transcripts corresponding to each type of histone genes (Fig. 1C). In addition, Northern blot experiments using probes for each of the histone genes (H1, H2A/2B, H3/4) showed that all of them hybridized to both total RNA and poly (A)-rich RNA samples (Figs. 1D and E ). These results have important evolutionary implications for the RI status of the invertebrate “orphon” H1 genes. They also provide direct experimental support for the true existence of functional polyadenylated forms of Mytilus histone genes, in agreement with observations based on previously defined putative polyadenylation signals.. Figure 1. RT-PCR and Northern blot analysis of total RNA and poly (A)-rich RNA from M. galloprovincialis. A Nucleotide sequences (5′ to 3′) and locations of primers used for PCR and RT-PCR amplifications carried out within the M. galloprovincialis histone repetitive unit. The histone fold domains of the core histones and the winged-helix motif of histone H1 are highlighted with black boxes. B Electrophoretic analysis of M. galloprovincialis total and polyadenylated RNA, showing the absence of the 28S rRNA fraction resulting from the denaturing conditions of the gel used in this analysis (Barcia et al. 1997). C RT-PCR amplifications of histones H1, H2A, H2B, H3, and H4 from M. galloprovincialis mRNA using the internal primers defined in A. The coding fraction PL-IIa of the sperm-specific PL-II protamine-like protein of Mytilus (Carlos et al. 1993) and the human H1.1 histone (Lever et al. 2000) were used as positive and negative controls for polyadenylation, respectively. D Electrophoretic analysis of the histone probes used for Northern blot hybridizations. These probes were obtained by PCR amplifications from M. galloprovincialis genomic DNA using primers from the 3′ and 5′ UTR regions (EirínLópez et al. 2004a). E Northern blot analysis obtained from M. galloprovincialis total and poly (A)-rich RNA using the probes shown in D. The probes used and the approximate size are indicated.. Evolution of promoter regions in RI H1 subtypes Analyses of promoter regions in invertebrate H1 “orphon” genes showed the presence of elements involved in RI gene expression of vertebrate differentiation-specific H1 genes, in addition to several control elements typical of genes transcribed by RNA polymerase II (Fig. 2A). It is possible to identify the presence of a.
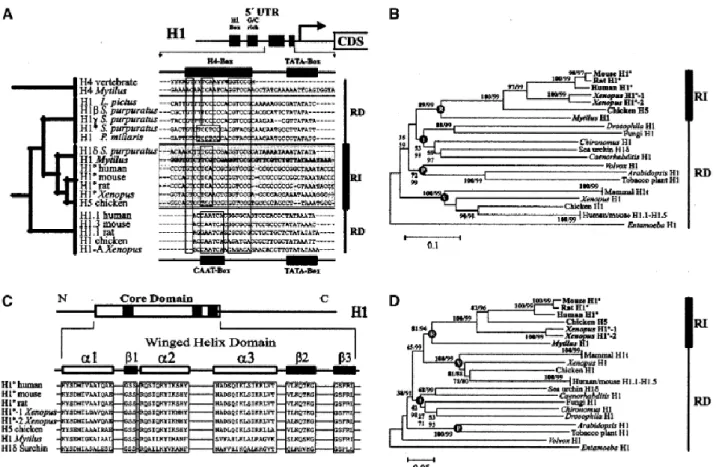
(5) homologous region with an upstream conserved element (UCE), typical of vertebrate H1° genes, and a region showing similarity to the H4 Site II from H4 gene promoter regions (Van Wijnen et al. 1992). The latter region is known as the H4-box and is typically found in promoter regions from vertebrate RI H1 genes (H1° and H5), positioned at the site occupied by the CAAT-box in somatic histone H1 isoforms (Fig. 2A). These elements are clearly different from those observed in somatic, tissue-specific, and stage-specific H1 genes (Fig. 2B) and, also, from those observed in core histone genes (Fig. 2C).. Figure 2. Structure of the histone H1 gene proximal promoter region. A Molecular structure of promoter regions of vertebrate RI H1 genes (H1° and H5) in comparison with those of invertebrate RI H1 genes (mussel and sea urchin “orphon” H1 genes). The similarities to the H4 Site II element from the H4 gene promoter region are also indicated. B Molecular organization of the promoter regions in somatic, tissue-specific, and stage-specific H1 genes. C Molecular structure of the promoter regions of mussel core histone genes. Major regulatory elements are schematically represented by black boxes, and the corresponding regions of the alignments are shown in the open boxes.. The sequence comparisons between promoter regions are in good agreement with the features observed at the molecular level, altogether suggesting that invertebrate “orphon” H1 genes are closely related to vertebrate RI H1 genes (Fig. 3A). In a phylogenetic analysis, both groups of genes cluster together and constitute an independent group which is characterized by the presence of an H4-box element in the promoter regions. Evolution of coding regions in RI H1 subtypes Vertebrate histone H1 RI isoforms characteristically exhibit shorter amino acid sequences than the somatic counterparts. This is also the case for invertebrate “orphon” H1 proteins, whose primary structures range between 185 (sea urchin H1δ) and 191 (Mytilus H1) residues. These sizes are identical to those of vertebrate H1° and H5 proteins but smaller than the somatic counterparts. For instance, sea urchin H1β and H1γ histones contain 211 and 217 residues, respectively. No significant differences in amino acid composition were observed between invertebrate and vertebrate RI histones, except for slight differences in Ala (22.32% in invertebrates, 16.64% in vertebrates) and in Ser (6.38% in invertebrates, 11.02% in vertebrates)..
(6) Figure 3. A Comparison of consensus promoter regions from RI and RD histone H1 genes from different vertebrate and invertebrate groups. The H4 promoter region is shown as a reference for the presence of the H4-box element in RI subtypes. Asterisk indicates early H1 gene. The branching pattern on the left indicates the evolutionary relationships among H1 histones reported by Eirín-López et al. (2002, 2004b). B Analysis of the winged-helix domain (Ramakrishnan et al. 1993) of RI H1 histones. The α-helix and β-sheet components of the winged-helix motif are shown above the corresponding protein sequence alignments of RI subtypes. C Phylogenetic neighbor-joining tree reconstructed using p-distances from the alignment of amino acid sequences corresponding to the winged-helix domains of RI and RD H1 histones from several representative eukaryote species. Numbers for interior branches represent the BS values (boldface), followed by the CP values based on 1000 replications, and are only shown when their value is larger than 50%. The monophyletic origins of the RI H1s (R) and the somatic subtypes from plants (P), invertebrates (I), and vertebrates (V) are indicated by black circles at the corresponding nodes. D Phylogenetic tree generated from alignments of the nucleotide sequences coding for the amino acid sequences described in C. The topology was contrasted and rooted in the same way as in C. The origin of the different groups is indicated by black circles at the corresponding nodes.. A high extent of similarity was also observed when comparing invertebrate “orphon” H1 and vertebrate RI H1 coding regions (Fig. 3B). By examining the overall amino acid sequence variability, we found that the lower divergence values occurred in the region of the histone H1 core which comprises the winged-helix domain (p = 0.271 ± 0.031 substitutions per site). These values were followed by those of the N- and Cterminal tails (p = 0.422 ± 0.048 and p = 0.426 ± 0.026, respectively). This asymmetry seems to dissappear at the nucleotide level, where the core domain (p = 0.316 ± 0.020) exhibits almost the same nucleotide variation as the N-terminal (p = 0.386 ± 0.033) and the C-terminal (p = 0.375 ± 0.014) domains. The nucleotide variation detected was essentially synonymous (pS > pN; P < 0.001, Z-test), with similar pS values for each of the protein domains (pS = 0.684 ± 0.027 for the N-terminal tail, pS = 0.644 ± 0.023 for the central domain, and pS = 0.627 ± 0.022 for the C-terminal domain). These values suggest the occurrence of extensive silent divergence among the coding regions of the genes encoding these proteins..
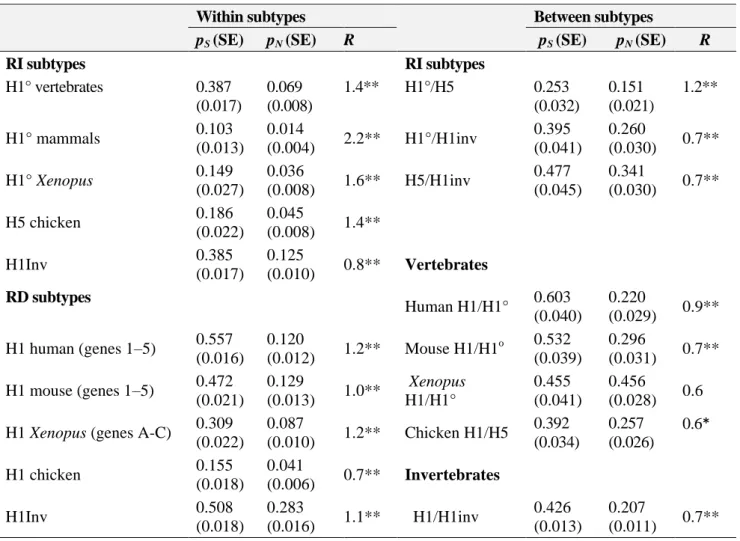
(7) The phylogenies reconstructed from both amino acid (Fig. 3C) and nucleotide (Fig. 3D) sequences corresponding to the core domain of RI H1 histones reveal that RI histones always cluster by type and not by species, which is indicative of the presence of a long-term evolutionary pattern predominantly dictated by functional constraints. Both topologies place mussel “orphon” H1 histones within the monophyletic group including the vertebrate RI subtypes. The RI cluster is statistically supported and clearly distinct from the somatic subtypes in both the trees generated from the amino acid and nucleotide sequences, being more closely related to invertebrate somatic H1s in the case of the protein phylogeny. Long-term evolution of RI H1 genes By comparing the complete nucleotide coding sequences within the three different RI lineages (H1°, H5, and “orphon” H1 genes), it was possible to detect the presence of a low synonymous variation among bird histone H5 genes (pS = 0.186 ± 0.022 substitutions per site) which was higher in the H1° and invertebrate “orphon” H1 lineages (pS = 0.387 ± 0.017 and pS = 0.385 ± 0.017 substitutions per site, respectively). Except for the case of H5, these values did not differ significantly from those obtained from the comparisons between different RI H1 lineages, where the silent divergence between H1° and “orphon” H1 and that between H5 and “orphon” H1 genes were found to be about 0.395 ± 0.041 and 0.477 ± 0.045 substitutions per site, respectively (Table 1). Furthermore, pS is significantly greater than pN in all comparisons (P < 0.001, Z-test).. Table 1. Average number of synonymous (pS) versus nonsynonymous (pN) nucleotide differences per site and average s/v ratios (R) in representative RI and RD histone H1 genes. Within subtypes pS (SE) pN (SE) RI subtypes H1° vertebrates H1° mammals H1° Xenopus H5 chicken H1Inv. 0.387 (0.017) 0.103 (0.013) 0.149 (0.027) 0.186 (0.022) 0.385 (0.017). 0.069 (0.008) 0.014 (0.004) 0.036 (0.008) 0.045 (0.008) 0.125 (0.010). R 1.4**. RI subtypes H1°/H5. 2.2**. H1°/H1inv. 1.6**. H5/H1inv. 0.8**. H1 mouse (genes 1–5) H1 Xenopus (genes A-C) H1 chicken H1Inv. 0.120 (0.012) 0.129 (0.013) 0.087 (0.010) 0.041 (0.006) 0.283 (0.016). 0.151 (0.021) 0.260 (0.030) 0.341 (0.030). 0.603 (0.040) 0.532 (0.039) 0.455 (0.041) 0.392 (0.034). 0.220 (0.029) 0.296 (0.031) 0.456 (0.028) 0.257 (0.026). 0.426 (0.013). 0.207 (0.011). 1.2** 0.7** 0.7**. Vertebrates Human H1/H1°. 0.557 (0.016) 0.472 (0.021) 0.309 (0.022) 0.155 (0.018) 0.508 (0.018). 0.253 (0.032) 0.395 (0.041) 0.477 (0.045). R. 1.4**. RD subtypes H1 human (genes 1–5). Between subtypes pS (SE) pN (SE). 1.2**. Mouse H1/H1o. 1.0**. Xenopus H1/H1°. 1.2**. Chicken H1/H5. 0.7**. Invertebrates. 1.1**. H1/H1inv. 0.9** 0.7** 0.6 0.6*. 0.7**. Note. pS > pN in all Z-test comparisons except Xenopus H1 vs. H1°. Significant at *(P < 0.05) and **(P < 0.001). Standard errors (SE) calculated by the bootstrap method with 1000 replicates. H1inv, denotes invertebrate “orphon” H1 genes..
(8) Supplement Table 1. Replication independent subtypes. Species VERTEBRATES Birds Cairina moschata Gallus gallus Mammals Homo sapiens Mus musculus Rattus norvegicus. Amphibians Xenopus laevis INVERTEBRATES Mollusks Mytilus californianus M. chilensis M. edulis M. galloprovincialis M. trossulus Echinoderms Strongylocentrotus purpuratus. RI Subtype. Nucleotide Accession Number. H5 H5 H5. X01065 J00870 X00169. H1° H1° H1° H1° H1° H1°. Z97630 U18295 X13171 X70685 X72624 NM_012578. H1°-1 H1°-2. Z71502 Z71503. H1-orphon H1-orphon H1-orphon H1-rep. unit H1-orphon H1-orphon. AJ416421 AJ416422 AJ416423 AY267739 AJ416424 AJ416425. H1-δ. J03807. Additional comparisons between vertebrate and invertebrate RI and RD H1 genes showed that, in both instances, RI genes from a given taxonomic group are not more closely related to their somatic counterparts than to somatic histone H1 genes from other different taxonomic groups (Table 1, Fig. 4). An extreme situation is that of mammalian H1° genes, which are always more closely related to bird, Xenopus, and invertebrate somatic H1 genes than to mammalian somatic histone H1 genes. It is also apparent from Fig. 4 that RI subtypes are not more closely related within lineages than they are between RI lineages or between RI and RD subtypes. For instance, the synonymous divergence between rat and Xenopus H1° genes (0.832 ± 0.044) is greater than that between rat H1° and any other vertebrate somatic H1 genes (Table 2). Also, the average synonymous divergence between human histone H1° and H1.1 genes is about 0.663 ± 0.043 substitutions per site, which is larger than that between human H1° and sea urchin H1β genes (Table 2). These data suggest that the process of divergence of RI and RD H1 genes is mainly the result of silent substitutions, independent of the subtype or species to which these genes belong..
(9) Figure 4. Average number of synonymous nucleotide differences per site (pS ) among RI and RD H1 histones computed by the modified Nei–Gojobori method (Zhang et al. 1998). p S > p N in all comparisons (P < 0.001, Z-test). RI subtypes: human, h; mouse, m; rat, r; chicken, c; duck, d; Xenopus, x; Mytilus, my; sea urchin, s. RD subtypes: mammals, M; birds, B; Xenopus, X; invertebrates, I. Bars indicate standard errors computed by the boostrap method (1000 replicates).. Discussion Although the molecular characterization of vertebrate RI H1 genes has been well documented (for a review see Doenecke et al. 1994), the situation in invertebrates is still unclear. In this work we provide evidence for a polyadenylation signature in the Mytilus “orphon” H1 genes (Fig. 1). This result, together with the common molecular and evolutionary features detected between vertebrate RI H1 isoforms and invertebrate “orphon” H1 genes and, also, with the solitary genomic location of these genes, suggests the presence of at least a fraction of H1 genes expressed uncoupled with the cell cycle and in a RI fashion in the genome of Mytilus galloprovincialis. Origin and evolution of invertebrate RI H1 genes Our results reveal the presence of common regulatory elements involved in the expression of both vertebrate RI H1 genes and mussel “orphon” H1 genes, including an upstream conserved region (UCE), an H1-box element, and an H4-box element (Khochbin and Wolffe 1994). From an evolutionary perspective, the presence of such an H4-box element in promoter regions of invertebrate RI H1s provides strong support for a close proximity between the vertebrate H1°/H5 genes and the “orphon” H1 genes from Mytilus and sea urchin. In addition, the presence of an H4-box element has also been reported in RD histone H1 genes from sea urchins (Peretti and Khochbin 1997), suggesting that both vertebrate and invertebrate RI isoforms are more closely related to invertebrate than to vertebrate somatic H1 genes. By analyzing the nucleotide substitution patterns in promoter regions (data not shown), we have found that the base changes involved in the evolution of the H1°, H5, and “orphon” H1 lineages were not balanced. They exhibited a marked trend toward G or C rather than toward A or T, which is probably to maintain the functionality of elements such as the UCE, the G/C-box, and the H4-box, which are mainly composed of G and C nucleotides..
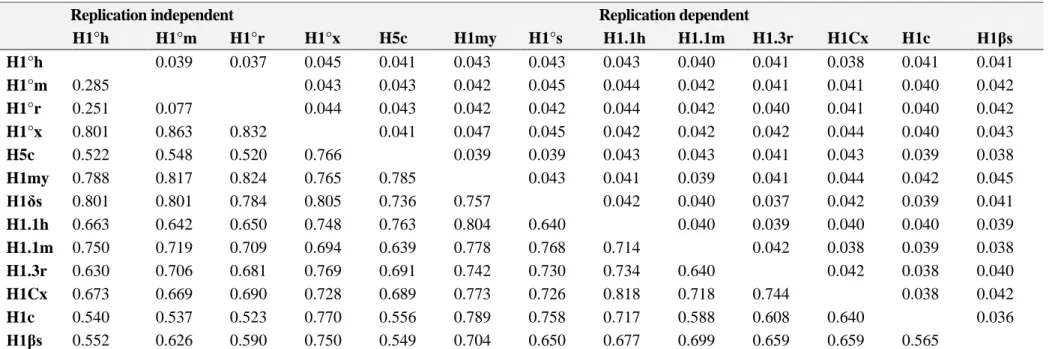
(10) Table 2. Synonymous nucleotide differences per site (p S; lower-left diagonal) and standard errors (SE; upper-right diagonal) in comparisons among RI and RD histone H1 genes from different vertebrates and invertebrate species. H1°h H1°m H1°r H1°x H5c H1my H1δs H1.1h H1.1m H1.3r H1Cx H1c H1βs. Replication independent H1°h H1°m H1°r 0.039 0.037 0.285 0.251 0.077 0.801 0.863 0.832 0.522 0.548 0.520 0.788 0.817 0.824 0.801 0.801 0.784 0.663 0.642 0.650 0.750 0.719 0.709 0.630 0.706 0.681 0.673 0.669 0.690 0.540 0.537 0.523 0.552 0.626 0.590. H1°x 0.045 0.043 0.044 0.766 0.765 0.805 0.748 0.694 0.769 0.728 0.770 0.750. H5c 0.041 0.043 0.043 0.041 0.785 0.736 0.763 0.639 0.691 0.689 0.556 0.549. H1my 0.043 0.042 0.042 0.047 0.039 0.757 0.804 0.778 0.742 0.773 0.789 0.704. H1°s 0.043 0.045 0.042 0.045 0.039 0.043 0.640 0.768 0.730 0.726 0.758 0.650. Replication dependent H1.1h H1.1m H1.3r 0.043 0.040 0.041 0.044 0.042 0.041 0.044 0.042 0.040 0.042 0.042 0.042 0.043 0.043 0.041 0.041 0.039 0.041 0.042 0.040 0.037 0.040 0.039 0.714 0.042 0.734 0.640 0.818 0.718 0.744 0.717 0.588 0.608 0.677 0.699 0.659. H1Cx 0.038 0.041 0.041 0.044 0.043 0.044 0.042 0.040 0.038 0.042 0.640 0.659. H1c 0.041 0.040 0.040 0.040 0.039 0.042 0.039 0.040 0.039 0.038 0.038. H1βs 0.041 0.042 0.042 0.043 0.038 0.045 0.041 0.039 0.038 0.040 0.042 0.036. 0.565. Note. RI genes: H1°h, human H1°; H1°m, mouse H1°; H1°r, rat H1°; H1°x, Xenopus H1°; H5c, chicken H5; H1my, Mytilus “orphon” H1; H1δs, sea urchin “orphon” H1δ. RD genes: H1.1h, human H1.1; H1.1m, mouse H1.1; H1.3r, rat H1.3; H1Cx, Xenopus H1C; H1c, chicken H1; H1βs, sea urchin H1β. Standard errors calculated by the bootstrap method (1000 replicates)..
(11) Supplement Table 2. Replication dependent subtypes. Species VERTEBRATES Birds Gallus gallus. Mammals Homo sapiens. Macaca mulatta Mus musculus. Rattus norvegicus. Amphibians Xenopus laevis. RI Subtype. Nucleotide Accession Number. H1.01 H1.03 H1.10 H1.11L H1.11R. X01752 M17021 M17018 M17019 M17020. H1.1 H1.1 H1.2 H1.3 H1.4 H1.5 H1.5 H1t H1t H1t H1t H1t H1.1 H1.2 H1.3 H1.4 H1.5 H1t H1t H1.2 H1.3 H1t. X57130 NM_005325 X57129 NM_004423 NM_004417 NM_004452 X83509 NM_004415 AL353759 M97755 M60094 M97756 Y12290 M25365 Z38128 L26163 Z46227 U06232 X72805 X67320 M31229 M13170. H1A H1A H1B H1B H1C. S69089 M21287 M21286 M03017 X72929.
(12) Supplement Table 2. (cont. ). Species INVERTEBRATES Insects Chironomus dorsalis C. pallidivittatus C. tentans. C. thummi. Drosophila melanogaster D. virilis. Mollusks M. edulis. Echinoderms Lytechinus pictus Parechinus angulosus Psammechinus miliaris Strongylocentrotus purpuratus. RI Subtype. Nucleotide Accession Number. H1 H1e H1a H1b H1c H1d H1e H1-I-1 H1-I-1 H1-II-1 H1-II-1 H1-II-1 H1-II-2 H1-II-2 H1-III-1 H1-III-1 H1 H1.1 H1.2 H1.3. U21211 L29106 L29107 L29108 L29109 AF002683 L29105 L28731 L28724 L28732 L28727 L28728 AF002680 L28725 X56335 L28726 X14215 L76558 U67772 U67936. H1 H1 H1 H1 H1. AJ224070 AJ224071 AJ224073 AJ224075 AJ224076. H1-late H1.1a H1-cleav.stage H1-earsly H1-β H1-γ. X04488 U07825 U84113 V01354 M20314 M16033.
(13) Supplement Table 2. (cont. ). Species INVERTEBRATES Nematodes Caenorhabditis elegans. PLANTS Arabidopsis thaliana. Nicotiana tabacum. FUNGI Ascobolus immersus Emericella nidulans Saccharomyces cerevisiae PROTISTS Chlamydomonas reinhardtii Entamoeba histolytica Volvox carteri. RI Subtype. Nucleotide Accession Number. H1.1 H1.1 H1.2 H1.2 H1.3 H1.4 H1.4 H1.5. AF017810 X53277 AF017812 AF017811 AF012253 AF005371 AF026521 AF005372. H1-1 H1-1 H1-2 H1-3 H1 H1 H1C. X62456 AC011001 X62459 U72241 AB029614 L29456 AF170089. H1 H1 H1-Hho1p. AF190622 AJ011780 NC_001148. H1 H1 H1 H1-I H1-II. U16726 U50904 AB002731 L07946 L07947. Invertebrate “orphon” H1 proteins shared common features with vertebrate RI H1s within the coding regions. The total number of amino acids of “orphon” H1s was roughly the same as that of histones H1° and H5, which is substantially lower than that of the somatic isoforms (Doenecke and Alonso 1996). Except for histone H5 (where there is a high content of Arg residues), no significant differences were found in the amino acid composition of vertebrate and invertebrate RI H1 proteins. The extent of similarity was quite evident when the protein sequences corresponding to the conserved histone H1 core were compared. Figure 3B shows that the major elements of the winged-helix domain are well conserved among vertebrate and invertebrate RI isoforms, whose sequences are otherwise different from those observed in the somatic subtypes (Schulze and Schulze 1995; Eirín-López et al. 2002). The presence of a split within the RI group was revealed from the phylogenies reconstructed from the amino acid and the nucleotide sequences corresponding to the histone H1 core (Figs. 3 C and D). Two lineages could be clearly outlined early in the evolution of this group. One of them included the vertebrate differentiation-specific subtypes (H1° and H5) and the second included the invertebrate RI “orphon” H1.
(14) genes belonging to Mytilus species. Both topologies are in very good agreement with those previously reported using the whole histone H1 sequences (Eirín-López et al. 2004b), with the exception of the H1δ protein from sea urchin, which is not placed inside the RI lineage in the phylogenies reconstructed using only the winged-helix domain. H1 histones were found to cluster by type instead of by species, suggesting that they are not more closely related within than between species, a key feature most likely determined by their long-term evolutionary pattern. At the nucleotide level, both vertebrate and invertebrate RI H1 genes diverge extensively through silent substitutions, which are always significantly larger than the nonsilent variation (P < 0.001, Z-test). As in the case of promoter regions, nucleotide substitutions show a trend toward G or C bases in coding regions, which could be (at least in part) a consequence of the medium-high levels of codon bias shown by histone genes. An additional effect of the regional mutation pressures along the chromosomes could also be invoked at this point, but this subject is beyond the scope of the present work and will require further and specific analyses. Evolutionary scenario of RI and RD H1 genes The long-term evolution of RD somatic histone genes best fits a birth-and-death evolution model under strong purifying selection instead to a concerted evolution pattern (Piontkivska et al. 2002; Rooney et al. 2002; Eirín-López et al. 2004b). Both vertebrate and invertebrate RI H1 genes occur in solitary locations in the genome, generally in a different chromosome from that containing the RD genes (Albig et al. 1997a; Wang et al. 1997; Eirín-López et al. 2002, 2004b). Therefore, in these instances a mechanism of concerted evolution involving a rapid process of interlocus recombination or gene conversion could not have played a major role driving the long-term evolution of these genes. We have found evidence for a functional evolution of vertebrate and invertebrate RI H1 genes that exhibit a clustering pattern by type instead of by species. Besides the relatively low protein divergence observed within and between RI lineages, we also found an extensive silent divergence at the nucleotide level. In all instances, the extent of pS was always significantly larger than pN in comparisons both within and between RI H1 lineages, as well as between RI and somatic RD subtypes (P < 0.001, Z-test). In addition, most of the pS values estimated within RI gene lineages were as high as the pS values estimated between RI lineages and between RI and RD lineages. The only exception to this observation was that of chicken H5 histone genes, suggesting that a recent gene duplication had occurred. Similar observations were also reported for chicken somatic H1, H3, and H4 genes (Piontkivska et al. 2002; Rooney et al. 2002; Eirín-López et al. 2004b). The divergence of the RI group from the main RD group must therefore have occurred before the differentiation between vertebrates and invertebrates about 815 million years ago (MYA) (Feng et al. 1997), as a consequence of the transposition of H1 genes to solitary locations in the genome (Fig. 5). The results reported in the present work show that, in the case of RI H1 isoforms, alleles from different loci form different clusters and the nuclotide divergence among genes takes place at the synonymous level. In Fig. 5, the independent evolution of RI H1genes is adapted to the general birth-and-death model (Nei et al. 1997). Recurrent gene duplication events and selection would lead to the acquisition of a RI expression pattern related to a concrete protein function in these genes. The stem-loop mRNA termination signal would have been progressively replaced by a polyadenylation signal (del Gaudio et al. 1998). Although this phenomenom has been well documented in the case of mammals, amphibians, and birds (Doenecke et al. 1994), the presence of specific functions associated with invertebrate RI H1 genes remains unclear..
(15) Figure 5. Simplified phylogenetic tree adapted from Fig. 1 of Eirín-López et al. (2004b) showing the evolutionary relationships among H1 proteins (using uncorrected p-distances) from different eukaryotic kingdoms. The numbers at the branching points represent BS and CP values as in Fig. 3C. The numbers and letters in parentheses after the species names indicate the H1 subtype, and the arrow points to the origin of the monophyletic group encompassing the RI H1 isoforms. The taxonomic groups as well as the expression patterns are indicated on the right side of the tree. The arrow indicates the split between RD and RI H1 genes, which resulted in an evolutionarily independent H1 group as a consequence of a transposition event of RD H1 genes (open boxes) to a solitary genomic location. The mechanism of birth-and-death evolution (Nei and Hughes 1992) would continue operating over this group, and the different RI H1 gene lineages would evolve through recurrent gene duplication events, where some of these genes are maintained in the genome for a long time, whereas others are deleted or become nonfunctional (pseudogenes).. Thus, it appears that RI H1 isoforms display the same long-term evolutionary pattern as RD H1 genes. This pattern is best described by a birth-and-death model of evolution with strong purifying selection, as has been well documented for the H3 multigene family (Rooney et al. 2002). This observation contrasts with the theoretical predictions that clustered genes would show evidence of more gene conversion or unequal crossing-over than solitary genes (Nei and Hughes 1992; Nei et al. 1997, 2000). In order to complete the picture of the RI histone H1 genes, further studies are neccessary to fill the gap in our knowledge about the evolutionary genesis and differentiation of the tissue-specific RI H5 subtype, which is uniquely present in bird erythrocytes. In this regard, characterization of the RD and RI H1 genes in reptiles, the closest evolutionary relatives to birds, is currently in progress in our labs and may be of critical value..
(16) Acknowledgments We thank Dr. Alejandro Rooney and Dr. Helen Piontkivska for fruitful discussions and comments on an early version of this work. We are also very grateful to Patricia González Greciano, Sergio Casas-Tintó, and Clara Goday at the Departamento de Biología Celular y del Desarrollo, CIB-CSIC, Spain, as well as to Lindsay J. Frehlick at the Department of Biochemistry and Microbiology, University of Victoria, for skillful technical assistance in the lab and for their critical comments. This work was funded by a PGIDT Grant (10PX110304) to J.M., by a Canadian Institutes of Health Research Grant-CIHR (MOP-57718) to J.A., and by a predoctoral FPU fellowship from the Spanish Government awarded to J.M.E.-L. We thank two anonymous reviewers for helpful discussions and comments.. References Albig W, Kioschis P, Poutska A, Meergans K, Doenecke D (1997a). Human histone gene organization: nonregular arrangement within a large cluster. Genomics, 40: 314–322. Albig W, Meergans T, Doenecke D (1997b). Characterization of the H1.5 genes completes the set of human H1 subtype genes. Gene, 184: 141–148. Ausio J (1999). Histone H1 and evolution of sperm nuclear basic proteins. J Biol Chem, 274: 31115–31118. Barcia R, Lopez-Garcia JM, Ramos-Martinez JI (1997). The 28S fraction of rRNA in molluscs displays electrophoretic behaviour different from that of mammal cells. Biochem Mol Biol Int, 42: 1089– 1092. Barzotti R, Pelliccia F, Bucciarelli E, Rocchi A (2000). Organization, nucleotide sequence, and chromosomal mapping of a tandemly repeated unit containing the four core histone genes and a 5S rRNA gene in an isopod crustacean species. Genome, 43: 341–345. Brocard MP, Triebe S, Peretti M, Doenecke D, Khochbin S (1997). Transcription termination and 3’ processing: the end is in site. Cell, 41: 349–359. Carlos S, Jutglar L, Borrell I, Hunt DF, Ausió J (1993). Sequence and characterization of a sper-specific histone H1-like protein of Mytilus californianus. J Biol Chem, 268: 185–194. Chabouté ME, Chaubet N, Gigot C, Philipps G (1993). Histones and histone genes in higher plants: structure and genomic organization. Biochimie 75: 523–531. Coen E, Strachan T, Dover GA (1982). Dynamics of concerted evolution of ribosomal DNA and histone gene families in the melanogaster species subgroup of Drosophila. J Mol Biol, 158: 17–35. del Gaudio R, Potenza N, Stefanoni P, Chiusano ML, Geraci G (1998). Organization and nucleotide sequence of the cluster of five histone genes in the polychaete worm Chaetopterus variopedatus: first record of a H1 histone gene in the phylum annelida. J Mol Evol, 46: 64–73. Dimitrov S, Almouzni G, Dasso M, Wolffe AP (1993). Chromatin transitions during early Xenopus embryogenesis: changes in histone H4 acetylation and in linker histone type. Dev Biol, 160: 214– 227. Doenecke D, Alonso A (1996). Organization and expression of the developmentally regulated H1° histone gene in vertebrates. Int J Dev Biol, 40: 395–401..
(17) Doenecke D, Albig W, Bouterfa H, Drabent B (1994). Organization and expression of H1 histone and H1 replacement histone genes. J Cell Biochem, 54: 423–431. Doenecke D, Albig W, Bode C, Drabent B, Franke K, Gavenis K, Witt O (1997). Histones: genetic diversity and tissue-specific gene expression. Histochem Cell Biol, 107: 1–10. Eirín-López JM, González-Tizón AM, Martínez A, Méndez J (2002). Molecular and evolutionary analysis of mussel histone genes (Mytilus spp.): possible evidence of an “orphon origin” for H1 histone genes. J Mol Evol, 55: 272–283. Eirín-López JM, Ruiz MF, González-Tizón AM, Martínez A, Sánchez L, Méndez J (2004a). Molecular evolutionary analysis of the mussel Mytilus histone multigene family: first record of a tandemly repeated unit of five histone genes containing an H1 subtype with “orphon” features. J Mol Evol, 58: 131–144. Eirín-López JM, González-Tizón AM, Martínez A, Méndez J (2004b). Birth-and-death evolution with strong purifying selection in the histone H1 multigene family and the origin of “orphon” H1 genes. Mol Biol Evol, 21: 1992–2003. Felsenstein J (1985). Confidence limits on phylogenies: an approach using the bootstrap. Evolution, 39: 783– 791. Feng DF, Cho G, Doolittle RS (1997). Determining divergence times with a protein clock: update and reevaluation. Proc Natl Acad Sci USA, 94: 13028–13033. Hall TA (1999). BioEdit: a user-friendly biological sequence alignment editor and analysis program for Windows 95/98/NT. Nucl Acids Symp Ser, 41: 95–98. Hankeln T, Schmidt ER (1993). Divergent evolution of an “orphon” histone gene cluster in Chironomus. J Mol Biol, 234: 1301–1307. Harvey AC, Downs JA (2004). What functions do linker histones provide? Mol Microbiol, 53: 771–775. Hentschel CC, Birnstiel ML (1981). The organization and expression of histone gene families. Cell, 25: 301– 313. Holt CA, Childs G (1984). A new family of tandem repetitive early histone genes in the sea urchin Lytechinus pictus: evidence for concerted evolution within tandem arrays. Nucleic Acids Res, 12: 6455–6471. Isenberg I (1978). Histones. In: Busch H (ed), The cell nucleus. Academic Press, New York, pp. 135–154. Isenberg I (1979). Histones. Annu Rev Genet, 48: 159–191. Kasinsky HE, Lewis JD, Dacks JB, Ausió J (2001). Origin of H1 histones. FASEB J, 15: 34–42. Kedes L (1979). Histone messengers and histone genes. Annu Rev Biochem, 48: 159–191. Khochbin S, Wolffe AP (1994). Developmentally regulated expression of linker-histone variants in vertebrates. Eur J Biochem, 225: 501–510. Kumar S, Tamura K, Jakobsen IB, Nei M (2001). MEGA2: Molecular Evolutionary Genetic Analysis software. Bioinformatics, 17: 1244–1245..
(18) Lever MA, Th’ng JPH, Sun X, Hendzel MJ (2000). Rapid exchange of of histone H1.1 on chromatin in living human cells. Nature, 408: 873–876. Lieber T, Angerer LM, Angerer LC, Childs G (1988). A histone H1 protein in sea urchins is encoded by poly(A)+ mRNA. Proc Natl Acad Sci USA, 85: 4123–4127. Marzluff WF (1992). Histone 3’ ends: essential and regulatory functions. Gene Express, 2: 93–97. Maxson R, Mohun T, Gormezano G, Childs G, Kedes L (1983). Distinct organizations and patterns of expression of early and late histone gene sets in the sea urchin. Nature, 301: 120–125. Nei M, Hughes AL (1992). Balanced polymorphism and evolution by the birth-and-death process in the MHC loci. In: Tsuji K, Aizawa M, Sasazuki T (eds), Eleventh histocompatibility workshop and conference. Oxford University Press, Oxford, UK, pp. 27–38. Nei M, Gu X, Sitnikova T (1997). Evolution by the birth-and-death process in multigene families of the vertebrate immune system. Proc Natl Acad Sci USA, 94: 7799–7806. Nei M, Rogozin IB, Piontkivska H (2000). Purifying selection and birth-and-death evolution in the ubiquitin gene family. Proc Natl Acad Sci USA, 97: 10866–10871. Ohta T (1983). On the evolution of multigene families. Theor Popul Biol, 23: 216–240. Ota T, Nei M (1994). Divergent evolution and evolution by the birth-and-death process in the immunoglobulin VH gene family. Mol Biol Evol, 11: 469–482. Peretti M, Khochbin S (1997). The evolution of the differentiation-specific histone H1 gene basal promoter. J Mol Evol, 44: 128–134. Piontkivska H, Rooney AP, Nei M (2002). Purifying selection and birth-and-death evolution in the histone H4 gene family. Mol Biol Evol, 19: 689–697. Poccia DL, Green GR (1992). Packaging and unpackaging the sea urchin sperm genome. Trends Biochem Sci, 17: 223–227. Ramakrishnan V, Finch JT, Graziano V, Lee PL, Sweet RM (1993). Crystal structure of globular domain of histone H5 and its implications for nucleosome binding. Nature, 362: 219–223. Rooney AP, Piontkivska H, Nei M (2002). Molecular evolution of the nontandemly repeated genes of the histone 3 multigene family. Mol Biol Evol 19: 68–75. Ruiz-Carrillo A, Affolter M, Renaud J (1983). Genomic organization of the genes coding for the six main histones of the chicken: complete sequence of the H5 gene. J Mol Biol, 170: 843–859. Rzhetsky A, Nei M (1992). A simple method for estimating and testing minimum-evolution trees. Mol Biol Evol, 9: 945–967. Saitou N, Nei M (1987). The neighbor-joining method: a new method for reconstructing phylogenetic trees. Mol Biol Evol, 4: 406–425. Sambrook J, Fritsch EF, Maniatis T (1989). Molecular cloning: a laboratory manual. Cold Spring Harbor Laboratory, Cold Spring Harbor, NY Schienman JE, Lozovskaya ER, Strausbaugh LD (1998). Drosophila virilis has atypical kinds and arrangements of histone repeats. Chromosoma, 107: 529–539..
(19) Schulze E, Schulze B (1995). The vertebrate linker histones H1°, H5, and H1M are descendants of invertebrate “orphon” histone H1 genes. J Mol Evol, 41: 833–840. Simpson RT (1978). Structure of chromatosome, a chromatin particle containing 160 base pairs of DNA and all the histones. Biochemistry, 17: 5524–5531. Sitnikova T (1996). Bootstrap method of interior-branch test for phylogenetic trees. Mol Biol Evol, 13: 605–611. Sullivan SA, Sink DW, Trout KL, Makalowska I, Taylor PL, Baxevanis AD, Landsman D (2002). The histone database. Nucleic Acids Res, 30: 341–342. Tanaka M, Hennebold JD, Macfarlane J, Adashi EY (2001). A mammalian oocyte-specific linker histone gene H1oo: homology with the genes for the oocyte-specific cleavage stage histone (CS–H1) of sea urchin and the B4/H1M histone of the frog. Development, 128: 655–664. Thompson JD, Gibson TJ, Plewniak F, Jeanmougin F, Higgins DG (1997). The CLUSTAL_X windows interface: flexible strategies for multiple sequence alignment aided by quality analysis tools. Nucleic Acids Res, 25: 4876–4882. Van Wijnen AJ, van Den Ent FMI, Lian JB, Stein JL, Stein GS (1992). Overlapping and CpG methylationsensitive protein–DNA interaction at the histone H4 transcriptional cell cycle domain: distinctions between two human H4 gene promoters. Mol Cell Biol, 12: 3273–3287. Wang ZF, Sirotkin AM, Buchold GM, Skoultchi AI, Marzluff WF (1997). The mouse histone H1 genes: gene organization and differential regulation. J Mol Biol, 271: 124–138. Wolffe AP, Khochbin S, Dimitrov S (1997). What do linker histones do in chromatin? BioEssays, 19: 249– 255. Zhang J, Rosenberg HF, Nei M (1998). Positive Darwinian selection after gene duplication in primate ribonuclease genes. Proc Natl Acad Sci USA, 95: 3708–3713.. *. This is a post-peer-review, pre-copyedit version of an article published in [Journal of Molecular Evolution]. The final authenticated version is available online at: [https://doi.org/10.1007/s00239-004-0328-9]. †. [email protected].
(20)
Figure

+4


Documento similar
Association among aroma volatiles and other traits in one near-isogenic line with firm flesh texture
Relative expression of selective genes only considering the postharvest ripening time factor and involved in different process in fruit of the melon near-isogenic line SC10-2
The expansionary monetary policy measures have had a negative impact on net interest margins both via the reduction in interest rates and –less powerfully- the flattening of the
Jointly estimate this entry game with several outcome equations (fees/rates, credit limits) for bank accounts, credit cards and lines of credit. Use simulation methods to
In our sample, 2890 deals were issued by less reputable underwriters (i.e. a weighted syndication underwriting reputation share below the share of the 7 th largest underwriter
Besides transcription factors, several chromatin features have been shown to regulate the transcriptional activity of a promoter, like the nucleosomal configuration
Penelitian ini bertujuan untuk mendapatkan asal daerah bahan baku yang terbaik untuk pembuatan sirup gula kelapa dan untuk mendapatkan konsentrasi arang aktif yang
For instance, the best overall accuracy of bagging in Breast with 20% noise is achieved using a 10% sampling ratio: The test error goes from 4.1% when no noise is injected to 3.5%
In particular, different versions of the training set for the base learners can be used, as in bagging (bootstrap sampling of training data), class-switching (noise injection in
