A kinetic study of the effects of light on circadian rhythmicity of the frq promoter of neurospora crassa
11
0
0
Texto completo
(2) Gooch et al. / KINETIC EFFECTS OF LIGHT 39. the study by Tan et al. (2004) has been one of the few efforts to monitor frq dynamics under more realistic photo-cycle conditions. In this article, we have focused on the effects of light on frq expression. Earlier work (Froehlich et al., 2002) has shown that there are 2 light response elements (LREs) within the frq promoter, known as the proximal LRE (pLRE) and the distal LRE (dLRE). The pLRE plays a major role in frq rapid transcriptional response to light as well as in maintaining high levels of expression under constant light conditions (Crosthwaite et al., 1995; Froehlich et al., 2002). Although the dLRE has a minor role in transcriptional light responses, it has been shown to be fundamental for frq circadian expression; not surprisingly, this region is now commonly referred to as the Clock Box or simply the C-box (Froehlich et al., 2003; Belden et al., 2007). Light activation in Neurospora is mediated by the proteins WHITE COLLAR-1 (WC1) and WHITE COLLAR-2 (WC-2) (Chen et al., 2010b; Corrochano, 2011). These proteins form a WHITE COLLAR COMPLEX (WCC) that can bind to defined LREs in the promoters of hundreds of genes (Vitalini et al., 2006; Smith et al., 2010), controlling their fast transcriptional response to light (Chen et al., 2009) and also the circadian expression of several of them (Correa et al., 2003). Blue light, when absorbed by the FAD cofactor of WC-1, rapidly leads to a drastic increase in frq expression (Dunlap and Loros, 2005), mediated mainly by the pLRE of the frq promoter. Two common methods are used to show the effects of light on Neurospora circadian rhythms. In one, a pulse of light is applied during a free-running circadian rhythm in constant dark (DD) yielding phase advances or phase delays dependent upon when the pulse is given in the cycle, which leads to the plotting of a phase response curve (PRC) (Sargent and Briggs, 1967; Dharmananda, 1980; Heintzen et al., 2001). Alternatively, a specific light-dark cycle (e.g., a repeated cycle of 12 h of light and 12 h of dark: 12L:12D) can be applied, yielding entrainment, whereby the period and phase of the circadian rhythm are controlled by the imposed cycle (Sargent et al., 1966; Johnson et al., 2003). The expression of frq has been mainly followed in liquid culture by Northern and Western blots, but a luminescent reporter allows us to follow the activity of the frq promoter with much improved quantitative and time resolution on a solid medium and in realtime. In this work we use the wild-type frq promoter (frq-luc) (Gooch et al., 2008) or a modified frq promoter (frqCXB-luc) to drive a codon optimized firefly luciferase gene incorporated into the his-3 locus of Neurospora. Strains bearing these constructs simply report the activity of the frq promoter and do not modify the existing frq circadian oscillatory system. The frqCXB-luc strain contains a highly resected frq. promoter bearing an intact C-box element and a nonfunctional pLRE. We favored frqCXB-luc as a reporter in many of the experiments, since it avoids complicating issues associated with direct light induction of frq expression (and therefore acute changes in LUC levels if using a full frq promoter reporter). In addition, the frqCXB-luc reporter displays a more robust rhythm while still allowing the core clock to fully respond to environmental cues.. Materials and Methods Medium and Inoculation FGS medium consisted of 0.05% fructose, 0.05% glucose, 2% sorbose, 1X Vogel’s salts (Vogel, 1956), 1.8% agar, and 50 µg/L biotin. This medium is autoclaved for 30 min (autoclaving the entire medium, opposed to using autoclaved components, has been found to be necessary to get good circadian activity). Potassium firefly luciferin (BioSynth L-8200 D-luciferin firefly [synthetic] potassium salt, Biosynth International, Itasca, IL) is added (25 µM). Thirty milliliters of this medium is added per small and deep Petri plate (60 mm × 20 mm). Neurospora strains are stored at –80 °C as conidial suspensions. Defrosted aliquots of 6 µL each are placed in a format of 6 dots in a circular pattern onto the FGS agar medium. Neurospora Strains The frq-luc strain (laboratory strain: FD11-9c: his3::frqpromoter-luc, ras-1bd, a) has a frq promoter controlling the optimized firefly luciferase gene at the his-3 locus (Gooch et al., 2008). The frqCXB-luc strain (laboratory strain: x717-4: his-3::frqcxb-luc, ras-1bd, a) uses a resected form of the frq promoter to drive the luciferase gene, whereby the pLRE of this frq promoter is modified to be nonfunctional (the mutated pLRE of the probe replaces the pLRE of AF45 of Froehlich et al., 2002). Both strains originated as transformants of a his-3:ras-1bd a strain and were made homokaryotic by conidial plating. Lighting and Measurement of Luminescence The measuring chamber is a light-tight box in a light-tight controlled environmental room maintained at 25 ± 0.1 °C. Every 30 min, a 2.5-min image is captured of up to 45 inverted Petri plate cultures using a liquid nitrogen cooled CCD camera (Princeton Instruments, Trenton, NJ; Spec-10; 700B/ LN). If the cultures are in an illuminated phase, the. Downloaded from jbr.sagepub.com at PONTIFICIA UNIVERSIDAD CATOLICA DE CHILE on May 16, 2016.
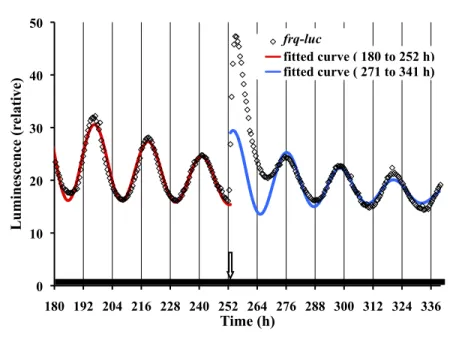
(3) 40. JOURNAL OF BIOLOGICAL RHYTHMS / February 2014. Luminescence (relative). 50. frq-luc fitted curve ( 180 to 252 h) fitted curve ( 271 to 341 h). 40. 30. 20. 10. 0 180 192 204 216 228 240 252 264 276 288 300 312 324 336. Time (h). Figure 1. Luciferase is a precise reporter of frq expression under free-running conditions. Neurospora frq-luc was inoculated onto FGS medium. Petri plates were placed in the measuring chamber at 25 °C at time 0 and exposed to 7 days of 12L:12D treatment, with the last light cycle ending at 156 h. At h 252, a 27-min light pulse was given, represented by a downward arrow. Light intensity at the culture surface was 1 µeinsteins sec-1 m-2 from 64 LEDs suspended about 5 cm over the plates. Data from h 180 to 252 were fitted with a cosine curve (red curve), allowing for an amplitude decay and mesor decay (see Materials and Methods). The fitted curve has an R2 value of 0.97 and a period of 22.2 h. Data from h 271 to 341 are also fitted (blue curve), and for comparison reasons they are back-extrapolated to h 252. Individual datum points are shown in the figure but, for simplicity, are not shown in other figures.. lights are turned off for 3 min every 30 min to capture the luminescent image. Total luminescence, relative to background, of each plate of 6 colonies is determined and these data are plotted. The camera and lighting are controlled using Visual Basic macro programming within Microsoft Excel and WinSpec software. Lighting times and intensities of LEDs are software controlled using a PhidgetLED 64 controller board (Phidgets, Inc., Calgary, Alberta). The white LEDs (Jameco MCDL-5013UWC) have a spectral range of 420 to 750 nm, with peaks at 455 and 550 nm. White bars along the x-axis of the graphs indicate times of light exposure; dark bars, darkness; and slashed bars, dimness. Light intensity was measured using a Licor quantum sensor (Licor, Lincoln, NE). With the exception of Figure 2A, light from the LEDs was about 5 cm above inverted Petri plates with the light intensity (µeinsteins sec-1 m-2) at different surfaces being as follows: upper plate surface, 1.6; agar surface, 1.0; and lower plate surface, 0.65, all of which were used at durations that were saturating for Neurospora photoresponses (Crosthwaite et al., 1995). In this report, we use the value at the agar surface of 1 µeinsteins sec-1 m-2, but one must appreciate that mycelia grow completely throughout the agar and it is not obvious what the. light intensity is at the light receiving components within the cell. Curve Fitting In some figures, free-running oscillatory data are fitted by use of a modified cosine function using Solver of Microsoft Excel 11.5 for Macintosh. The fitted cosine equation allows for an exponential amplitude and an exponential mesor: Luminescence = M * e(MD*t) + A * e(AD*t) * cos (2π (t-P)/τ), where t is time, τ is the period, P is the phase, A is the amplitude, AD is the amplitude decay, M is the mesor (a rhythm-adjusted mean), and MD is the mesor decay. Phase Setting by Light Treatment. Phase resetting by light pulses at different phases of the circadian cycle. The frq-luc strain of Neurospora was grown for 3 days in DD at 25 °C, and then all plates were placed in a refrigerator (4 °C) for 2 days; the return to 25 °C sets the phase, which can be documented by data prior to light treatment. Over 48 h, at 2-h intervals, a pair of plates was removed from the refrigerator and placed into the measuring chamber at 25 °C DD. In this way, each pair of plates was 2 h out of phase with the previous pair. Then, a single 15-min light pulse was given of 0.029 µeinsteins sec-1 m-2 from a rack of white LEDs 1 m away.. Phase resetting by light exposure of different durations. The frqCXB-luc strain of Neurospora was grown for 4 days in DD at 25 °C, and then all plates were placed in a refrigerator (4 °C) for 2 days to set the phase. Plates were removed from the refrigerator at 2-h intervals and placed into the measuring chamber at 25 °C in LL (1 µeinsteins sec-1 m-2) such that different plates were receiving different durations of light exposure. At a specified time, the lights were turned off and measuring commenced.. Results Analysis of a frq-luc Neurospora strain colonized on a sorbose medium yields detailed changes in amplitude and time resolution (Fig. 1). The free-running circadian. Downloaded from jbr.sagepub.com at PONTIFICIA UNIVERSIDAD CATOLICA DE CHILE on May 16, 2016.
(4) Gooch et al. / KINETIC EFFECTS OF LIGHT 41. points of the circadian cycle and then deterA mine the degree of phase shifting, thus ultimately producing a phase response curve (PRC) (Heintzen et al., 2001; Johnson et al., 2003). The level of phase shifting is very dependent upon the C time within the circadian cycle at which the light pulse is applied. Sargent and Briggs (1967; see their Figs. 4 and 5) show the first published PRC of Neurospora, using a 45-min light pulse at different phases of the Figure 2. Neurospora displays strong phase setting in response to light. (A) The frq-luc strain of Neurospora at different phases of the circadian cycle, was exposed to a single 15-min light pulse (0.029 conidial banding circaµeinsteins sec-1 m-2) (see Materials and Methods). The time of the pulse, relative to the time the culture dian cycle. It is diffiwas placed into the measuring chamber, is shown by the yellow 45° line in the figure. Peak times of cult to generate a luminescence were determined before and after the pulse using cosine fitting, and the average times of phase response curve the peak of 2 replicate plates were plotted. The first peak after the pulse is regarded as a light-induction that only reflects effect followed by circadian rhythm peaks. The vertical dark lines represent the peak times of nonpulsed controls. The red curve is the relative luminescence of a nonpulsed control. (B) Phase resetting Neurospora’s response by light exposure of different durations provides evidence for rhythmicity in constant light. Cultures to light, since incanof the frqCXB-luc strain of Neurospora were exposed to different durations of light (1 µeinsteins sec-1 m-2) descent and fluores(see Materials and Methods). Peak times of luminescence were determined as described in Figure 2A. cent lights also The peak times are plotted relative to when light exposure started. The bottom row of data and vertical generate heat, and it is black lines represent cultures that received no light exposure. An average phase line is shown by the 45° black line (averaged for light duration h 6 to 48). Part C is a replot of the last peak of data relative to the known that Neurospora time since the transition of light to dark. circadian rhythmicity is very responsive to temperature changes waveform in constant darkness (DD) fits well to a (Gooch et al., 1994; Liu et al., 1998; Gooch et al., 2008). cosine curve (red curve of Fig. 1). There are obvious Therefore, we conducted a detailed phase resetting growth, aging, and damping issues in cultures; thereexperiment with the frq-luc reporter in a highly confore, cosine curves are fitted to allow for an exponentrolled thermal environment and using LED lighting, tial mesor (a rhythm-adjusted mean) and exponential which produces little heat and no measurable change amplitude in our least squares fitting algorithm. The in temperature in our system (Fig. 2A). Our goal was fitting in Figure 1, in DD, yields a period of 22.2 h. It is also to obtain highly precise phase response data over well known that a circadian rhythm, including that of a 2-cycle period. This was achieved by using curve Neurospora, can be phase shifted by a pulse of light. At fitting on the resulting waveforms with data collected h 252, a 27-min light pulse is given that initially induces every 30 min over 48 h. Furthermore, we used a strain a large increase in the luciferase signal, reflecting an that directly reports the promoter activity of the core acute induction of the frq promoter, as previously oscillatory feedback loop, thus avoiding the effects of described (Crosthwaite et al., 1995; Shrode et al., 2001; acute light regulation on a hand of the clock such as Chen et al., 2009). After the light perturbation, it takes the conidiation process. The result is seen in Figure about 20 h before a fittable cosine curve reappears cor2A, whereas a more classic plotting of the PRC is responding to a 9.2-h phase advance (Fig. 1). Typically, shown in Supplemental Figure S1a and the same data a light pulse “reinvigorates” the rhythm, leading to are plotted as a phase transition curve (PTC) in more robustness and larger amplitude in comparison Supplemental Figure S1b. Our data, obtained using to continued exposure to constant dark. 15-min light pulses, show very strong phase resetting An important method of studying circadian known as type 0 (yielding averaged curves with a rhythms has been to apply a light pulse at different zero slope in a PTC plot; Winfree, 1980). When. Downloaded from jbr.sagepub.com at PONTIFICIA UNIVERSIDAD CATOLICA DE CHILE on May 16, 2016.
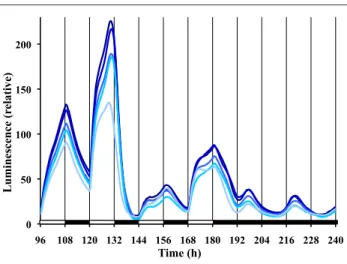
(5) JOURNAL OF BIOLOGICAL RHYTHMS / February 2014. compared with a previously determined Neurospora light PRC (Dharmananda, 1980) and temperature PRC (Gooch et al., 2008), the curves are very similar (Suppl. Fig. S2). Easily seeing strong type 0 phase resetting in these colonized FGS grown Neurospora was unexpected. Although many attempts have been made in this laboratory (V.G.) to observe type 0 phase resetting in Neurospora by measuring conidiation banding in race tubes using race tube medium under tightly controlled temperature conditions, we have always only observed weak type 1 resetting. At the suggestions of others, as well as after examining other publications, we have systematically tried (data not shown) (a) new wild-type bd strains from different laboratories and the Fungal Genetics Stock Center (Kansas City, MO); (b) different pHs; (c) different carbon sources and concentrations; (d) different nitrogen sources and concentrations; (e) different light spectra, intensities, and durations; (f) pulse application at different times after being in DD; and (g) and different media (such as Westergaard’s and FRIES). While conducting a similar experiment as shown in Figure 2A, we simultaneously ran the same frq-luc strain in classic race tubes and race tube medium. We analyzed the results both in the classic way of determining banding by conidia formation as well as by examining the luminescent waveforms from race tubes. The race tube cultures only showed weak phase resetting of type 1 (Suppl. Fig. S3), while the sorbose colonized cultures again reveled strong phase resetting of type 0 (Fig. 2A). For Neurospora and other circadian systems, when given an extended bright light exposure followed by transfer to dark, the phase in DD tends to be set relative to the time of the transfer from light to dark. However, limit cycle modeling and experimentation have shown a slight oscillation (often referred to as a “wiggle”) in such data that is thought to represent circadian behavior that was occurring while in light (Saunders, 1976; Peterson, 1980; Johnson et al., 2003; Gooch, 2007). We performed such a phase release experiment using frqCXB-luc to see if this system also demonstrates the wiggle (Fig. 2B). On average, the phase of the peak after transfer from extended light to dark is 18.6 h, and there is, indeed, an oscillation around this average phase line. The wiggle has a period of about 22 to 25 h and a peak to trough amplitude of about 2 h relative to this average phase line (Fig. 2C). These data suggest that the Neurospora clock oscillates with a greatly suppressed amplitude in light, as previously suggested (Elvin et al., 2005). Using frq-luc and classic entraining conditions of 12L:12D, we observe in replicate cultures (Fig. 3) that the waveform of luciferase levels differs significantly from the cosine curve described under free-running conditions (compare with Fig. 1). After each lights-on. 200. Luminescence (relative). 42. 150. 100. 50. 0 96. 108 120 132 144 156 168 180 192 204 216 228 240. Time (h). Figure 3. Daily waveforms of frq expression are irregular during 12L:12D cycles. The same conditions exist as for Figure 1, except time zero represents established cultures being removed from the refrigerator and placed into the measuring chamber. Different lines represent replicate cultures.. event in the 12L:12D treatment, there is a dramatic increase in signal, consistent with the reported acute light induction of frq expression (Crosthwaite et al., 1995; Tan et al., 2004). Typically, the waveform during the light stage shows biphasic kinetics for frq-luc. While replicate plates within an experiment are very consistent (Fig. 3), the exact timing of the biphasic kinetics varies greatly from cycle to cycle and experiment to experiment. For example, the amplitude of the peak between h 144 and 156 of Figure 3 is substantially lower than the peak before or after. Such variability is reproducible in all of the replicate plates of an experiment (Fig. 3), but another experiment with the same protocol may show very different behavior (e.g., compare during 12L:12D between h 48 and 84 of Fig. 6A). Following lights-off on a 12L:12D treatment, there is always a dramatic decrease in signal after about a 30- to 60-min delay, consistent with prior biochemical data (Tan et al., 2004). Compared with the free-running rhythm in DD, the peak to trough amplitude of the entrained cycle is much larger (up to 4 times larger). A peak of luminescent signal is observable at about 18 to 19 h after the last lights-off, and the first established circadian trough is seen at 31 h (Fig. 3). To eliminate the signals associated with light induction kinetics, we switched to a frqCXB-luc reporter, which lacks a functional pLRE. The behavior of frqCXB-luc under 12L:12D treatment is compared with frq-luc in Figure 4. The frqCXB-luc is entrained, but there is no discontinuity of kinetics at lights-on, and, in fact, the luminescent signal increases before lightson. During the 12-h L phase, the luminescent signal increases to a peak after about 6 h and then drops with no observable biphasic kinetics. At each. Downloaded from jbr.sagepub.com at PONTIFICIA UNIVERSIDAD CATOLICA DE CHILE on May 16, 2016.
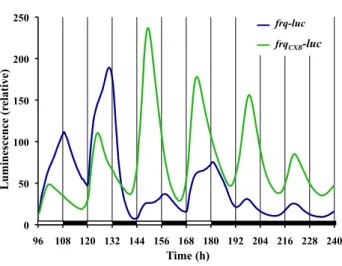
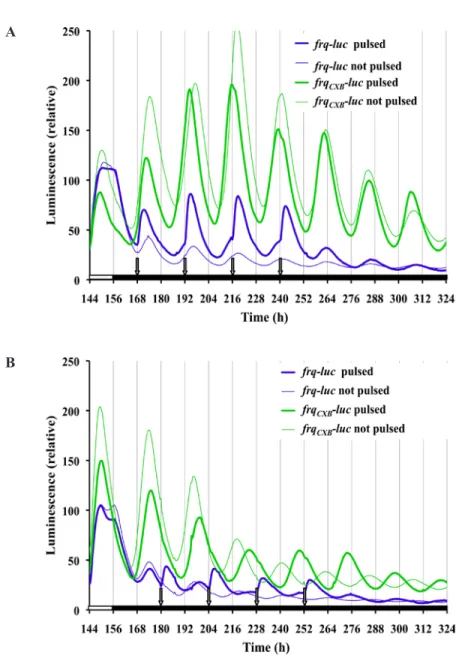
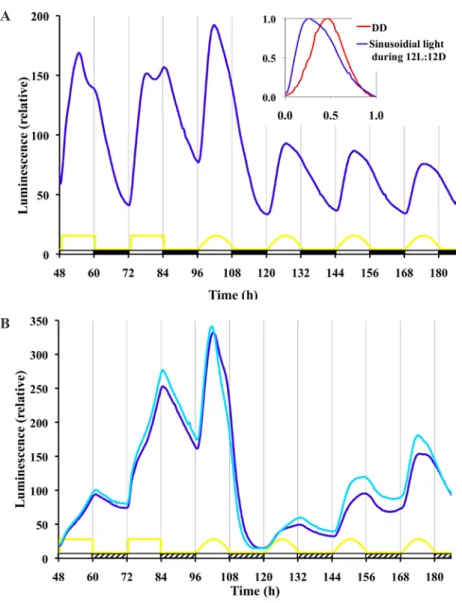
(6) Gooch et al. / KINETIC EFFECTS OF LIGHT 43. 250. frq-luc#22 FD11-9C frqCXB -luc 717-4A #12. Luminescence (relative). 200. 150. 100. 50. 0 96. 108 120 132 144 156 168 180 192 204 216 228 240. Time (h). Figure 4. Use of a reporter (frqCXB-luc) lacking an acute light response allows separation of acute and circadian response of frq expression to light. The experimental run is the same as Figure 3. Each line is a typical trace of replicate cultures.. lights-off there is no discontinuity in kinetics of the dropping signal. Under free-running conditions of DD there is a 22-h free-running rhythm. The peaks and troughs match closely with the ultimate rhythm of the frq-luc strain in DD; however, the frqCXB-luc strain tends to have higher amplitude and a more robust rhythm. Knowing that a 15-min light pulse affects the phase (Fig. 1), we wanted to assess whether such a pulse every 24 h (a 1-pulse skeleton photoperiod of T = 24) would be strong enough to entrain the circadian clock and to what extent just a 15-min pulse of light per day would affect the waveform. For the data in Figure 5A, the first photoperiod light pulse was given in accordance with the time of lights-on of the previous 12L:12D treatment, while in Figure 5B the first light pulse correlated with the last lights-off of the previous 12L:12D treatment. In both cases frqluc cultures show rapid light induction when the 15-min light pulse is initiated, and this is repeated every 24 h during the 4-day photoperiod treatment. It is not clear whether this repeated 24-h event is true circadian entrainment to 24 h or whether it is merely a repeated light induction response to each lights-on event. Once placed back into DD, a free-running rhythm of 22 h occurs. The absence of a functional pLRE removes the rapid light induction effect on frq expression (Fig. 5, frqCXB-luc reporter). The data for the frqCXB-luc reporter during the 4 cycles of photoperiod had a good fit to the damped cosine model and showed no deflections in response to the pulses. For both strains, a free-running rhythm of 22 h occurs once placed back into DD, with peaks occurring at about 24 and 46 h after the end of the last pulse, independent of when the photoperiod pulsing started.. This phase is nearly the same as the unpulsed control if the photoperiod pulsing started 12 h after the lights-off of the 12L:12D treatment (Fig. 5A) but is 12 h out of phase of the unpulsed control if the pulsing started 24 h after lights-off (Fig. 5B). This latter result suggests that Neurospora weakly entrains to this skeleton photoperiod, a phenomenon that can be observed with both the frq-luc and frqCXB-luc reporter strains. To make these phase adjustments, it is interesting to note that the frqCXB-luc had a period of about 22 h during the T = 24 treatment of Figure 5A but a period of 25 h during the T = 24 treatment of Figure 5B, which started at a different phase. Instead of using an abrupt 12L:12D square wave pattern or a skeleton photoperiod pattern, we were interested in examining the effects of lighting with a timing of intensity changes more similar to a natural daily solar lighting cycle. The natural daily lighting pattern is complex and depends on latitude, longitude, air quality, shading, cloud formation, and other environmental factors (Bird and Hulstrom, 1981). We used a half sine wave pattern, which is an approximate representation of the natural solar timing. We used a 12L:12D format, and during the lighting phase the intensity was changed every minute according to a sine wave representation. The resulting entrained waveform of frq-luc (Fig. 6A) is very different from the high-amplitude angular and biphasic pattern seen using the 12L:12D square wave pattern. This waveform is also different than the cosine waveform seen under free-running DD conditions. There is a distinct increase in signal with the slightest initiation of light. The luminescent signal peaks at about the same time as the light treatment peaks. The subsequent drop in signal is slower than the initial rise. With lights-off, there is a slightly faster drop in signal. The solar wave pattern treatment yields a trough to peak amplitude about one third the magnitude of the amplitude of the 12L:12D square wave treatment. In nature, night is never completely dark. The level of light at night varies due to many factors that are difficult to replicate under controlled laboratory conditions. Therefore, we ran square wave and solar pattern treatment experiments, but instead of 12 h of dark, we used 1/100 of the maximal intensity (0.01 µeinsteins sec-1 m-2) that we used during the light phase (1 µeinsteins sec-1 m-2). Neurospora has a 24-h response to this twilight situation (Fig. 6B); however, the response is quite different compared with the use of complete darkness. In particular, it seems to take a couple of days to reach a stable rhythm when given the sinusoidal light-twilight treatment. It is also interesting to note that a free-running rhythm persists in constant dim light (Suppl. Fig. S4) (more deeply explored in Gooch et al., 2014).. Downloaded from jbr.sagepub.com at PONTIFICIA UNIVERSIDAD CATOLICA DE CHILE on May 16, 2016.
(7) 44. JOURNAL OF BIOLOGICAL RHYTHMS / February 2014. with an R2 value of 0.97. Light induction of the frq promoter occurs after a A light pulse and peaks at about 3.3 h after the pulse. After about 20 h, the transient induction signal dissipates and the cosine free-running rhythm reestablishes itself with a new phase. The new phase depends on the point in the circadian cycle where the pulse is applied (Fig. 2A). Detailed phase response data show strong type 0 phase resetting. The light induction peak seen in Figure 2A, after lightsoff, should not be regarded as independent of circadian behavior. Light induces a surge of nonphosphorylated FRQ protein that plays a major role in setting subsequent circadian phase in DD. It will not exactly set the phase, since the subsequent circadian activity will also depend on the state B of the other circadian components at the time of the nonphosphorylated FRQ surge. The extent of phase resetting would also depend on the magnitude of FRQ production during light induction, which could depend on the point in the cycle that the light is applied. Thus, we tend to see a circadian peak of luciferase activity about 22.6 h after lights-off and about 19.3 h after the induction peak, but the exact peak depends on the duration, intensity, and phase of light application. It is interesting that we were able to easily observe strong type 0 phase shifting using light pulses in sorbose Figure 5. frq expression using a 24-h single pulse skeleton photoperiod shows acute colonized Neurospora while failing, circadian responses to light (T = 24). Cultures, as shown, were placed into the measurdespite many attempts, to do so ing chamber at time 0 and exposed for 7 days to 12L:12D light treatment. DD followed except for 4 events of 15-min light pulses that occurred every 24 h. Unpulsed control using classic race tube medium cultures did not receive the pulses, as they were sequestered into a dark can during the (RTM) in race tubes. The difference 15-min light treatment. Other conditions are as described in Figure 1. (A) Pulsing starts is most likely either a component of 12 h after lights-off of the 12L:12D treatment. Data for frqCXB-luc were fitted from 162 h the FGS medium or the colonization to 252 h to determine the period: pulsed, 22.1 h; not pulsed, 21.8 h. (B) Pulsing starts 24 h process itself. In FGS medium, after lights-off of the 12L:12D treatment on a new experimental run. Data for frqCXB-luc were fitted from 180 h to 264 h to determine the period: pulsed, 25.0 h; not pulsed, 22.0 h. growth is limited to a small fungal colony, in which conidiation happens early on in the process, in contrast to the race tube assay, where conidiation occurs Discussion actively while the growth front advances. When we have physically confined the growth of Neurospora The ability to collect data, in vivo, every 30 min while using RTM, nice circadian rhythms using the allows us to compile 48 points every 24 h, therefore luciferase reporter are observed, yet we again fail to providing not only a detailed description of the waveinduce strong phase shifting (data not shown). form of frq gene expression but also a better underLikewise, we transformed a colonized mutant (colstanding of the Neurospora circadian oscillator itself 16) with the luciferase reporter and attempted to find (Fig. 1). A damped cosine curve fits the data of Figure 1 Downloaded from jbr.sagepub.com at PONTIFICIA UNIVERSIDAD CATOLICA DE CHILE on May 16, 2016.
(8) Gooch et al. / KINETIC EFFECTS OF LIGHT 45. that media conditions (carbon sources) have been reported to modA ulate light responses, at least in the case of Trichoderma reesei (Friedl et al., 2008). Whether such a phenomenon also occurs in Neurospora, and its dependence on VVD, has not been explicitly studied. The waveform induced by 12L:12D (Figs. 3, 4, and 6A) treatment is dramatically different than simply contracting, or expanding, the smooth waveform that we observe under free-running DD conditions (Fig. 1). The waveform induced by a light-dark cycle tends to be more angular, has much higher amplitude, shows peaks and troughs at different relative phases, and is B inconsistent from cycle to cycle. It is likely that these characteristics are true for essentially all circadian rhythms and are predictable using limit cycle modeling (Johnson et al., 2003; Gooch, 2007). It is common practice to normalize the free-running DD cycle to 24 h (circadian time) and then extrapolate the peak and trough time to the time of maximum and minimum activity occurring for the organism in its natural environment (subjective day or subjective night). Such extrapolation is not justified, particularly when we know that lights-on or lights-off induces dramatic changes and that Figure 6. Response to a quasi-natural sinusoidal pattern of light during 12L:12D an entirely different cellular chemistreatment reveals very different waveforms of frq expression compared with LD square waves. (A) Cultures of frq-luc are treated with 4 days of square wave 12L:12D try exists while lights are on. (1 µeinsteins sec-1 m-2) and then 4 days of 12 L:12D where the light phase follows a half Furthermore, our 12L:12D treatsinusoidal pattern adjusted every minute (yellow curve). Other conditions are the same ments do not mimic nature since as Figure 1. Inset: For waveform comparison, a free-running trough to trough curve light does not suddenly appear at a from Figure 1 (hour 208 to 230) is compared with a sinusoidal treated curve of this figure constant level and then go off after (hour 144 to 168). The time and amplitude are normalized to 1. (B) Exposure of Neurospora to twilight results in a unique waveform. The experimental setup is the same as 12 h. When we use solar timing in part A, except a dim light intensity (hatched bar) is used (0.01 µeinsteins sec-1 m-2) in the comparison to square wave lighting place of darkness. The different curves represent replicate cultures. (Fig. 6A), we observe a distinctly less angular waveform with differstrong phase shifting on RTM without success (data ent relative phases (Boulos et al., 2002; Rieger et al., not shown). At this point, we do not know why the 2007; Rieger et al., 2012; Vanin et al., 2012). Laboratory sorbose-colonized Neurospora seems to be more sensisettings are not a good approximation of natural contized to light than dark-adapted Neurospora on RTM. ditions since in the natural environment the sun is It is known that VIVID (VVD) levels can modulate intense (up to 2000 µeinsteins sec-1 m-2), there are Neurospora’s response to light (Elvin et al., 2005; Chen daily temperature changes, and the temperature and et al., 2010a; Hunt et al., 2010; Malzahn et al., 2010). light can have large variation due to clouds and Whether these differences are due to extremely low weather conditions. It is not clear how these changes levels of VVD when using FGS medium is something generate a specific circadian waveform, but it is clear to consider. Nevertheless, it is important to highlight that the waveform in nature is not simply a variation. Downloaded from jbr.sagepub.com at PONTIFICIA UNIVERSIDAD CATOLICA DE CHILE on May 16, 2016.
(9) 46. JOURNAL OF BIOLOGICAL RHYTHMS / February 2014. of the free-running circadian rhythm in DD, which compromises the use of the terms “subjective day/ night” and “circadian time.” Recent studies in Drosophila have also highlighted the discrepancies of laboratory-based observations compared with what more closely occurs in nature, under progressive light and temperature fluctuations (Rieger et al., 2012; Vanin et al., 2012). Using frq-luc, we observe biphasic kinetics during the light phase of 12L:12D treatment (e.g., Fig. 3). The biphasic nature is likely due to a combination of the light induction effects on the reporter frq promoter plus the circadian related feedback mechanisms. There is a drop in luminescent signal in response to lights-off (if the signal is already dropping at lightsoff, then the signal subsequently drops faster), but the drop does not start until 30 to 60 min after lights-off (Fig. 3). The delay may be due, in part, to the decay time of luciferase mRNA after the promoter shutdown. The rapid light induction seen with the frq-luc is dependent on the presence of the pLRE, as it can be confirmed by the use of the frqCXB-luc reporter (see Figs. 4 and 5). The biphasic behavior of luciferase levels observed during the light phase of the 12L:12D treatment is only present in the frq-luc reporter, and not when using frqCXB-luc (Fig. 4). Moreover, in the latter there is no clear discontinuity in kinetics with either lights-on or lights-off, yet the pattern is clearly conforming to the imposed 24-h cycle. In fact, the signal starts to increase 2 h before lights-on, which can only be attributed to Neurospora’s inherent circadian kinetics. The modification of the pLRE region of the frq promoter not only may be affecting the light responsiveness of the promoter but also may be reducing the responsiveness of this resected frq promoter to other feedback mechanisms. We used a 15-min light pulse every 24 h (T = 24) to determine whether such a treatment could entrain the circadian cycle. Using frq-luc, there is an overt appearance of a perfectly entrained rhythm because of the surge of frq promoter activity after each light exposure. However, one might argue that this observation is merely a response to light-onset every 24 h and that there may be no effect on the inherent circadian mechanism, a phenomenon known as masking (Johnson et al., 2003). When we use the frqCXB-luc reporter strain, which only tracks frq circadian regulation but not frq light-induction, there is no observable deflection in kinetics at each light intensity change, which suggests no instantaneous phase shifting. However, the period during our 4 days of T = 24 treatment creates a period of about 22 h in one case and 25 h in another case, depending on the starting phase of the treatment. These results suggest that this skeleton photoperiod treatment is inducing. entrainment, but it takes a few days to adjust. This is consistent with previous observations (Remi et al., 2010) that phase adjustment during entrainment, under certain treatments, seems to involve a change in velocity of the clock (nonparametric) rather than instantaneous changes (parametric). However, Roenneberg et al. (2010) argued that using such biophysical concepts may not be the best approach in thinking about circadian entrainment. It is useful to ask whether even cycles of 12L:12D induce conforming cycles of entrainment. Phase, amplitude, and waveform of Figures 3 and 4 during 12L:12D treatment are dramatically different than simply an expansion of the DD free-running cycle. Each lights-on event of 12L:12D will cause a surge of FRQ, but at this time the other oscillating components in Neurospora may be at different stages. This could explain why we observe somewhat different patterns and amplitude during each subsequent light phase of the 12L:12D treatment. With lights staying on, other events are initiated (e.g., VVD production) and unique lights-on feedback would be enacted. A complex set of biochemical/genetic feedback mechanisms occur in the presence of light (Yu et al., 2007), and thus it is not surprising that we see complex waveforms while lights are on. If entrainment has occurred, then once released into free-running conditions the phase of the free-running cycle should correspond to that of the entrained cycle. Since phase is normally determined by the peak or trough, and waveforms forming the peak and troughs during 12L:12D treatment are very different than those during free-running, it becomes awkward to compare phases. In nature, night also creates an interesting circumstance. When we create a light-dark cycle in the laboratory, we usually use complete darkness for the “night phase” of the experiment. Complete darkness at night is unrealistic, since there is always some level of light from stars and the moon as well as consideration of light pollution from human activity. This laboratory (V.G.) and others (Roenneberg and Foster, 1997; Evans et al., 2007; Rieger et al., 2007; Malzahn et al., 2010) have shown that the circadian rhythms can be sensitive to very low levels of light, well within the range of moonlight intensities. In Figure 6B we attempted some level of simulation of nature by using dim light during the “night-phase” and discovered that this treatment led to yet another waveform different than if it were total darkness. Experiments have repeatedly shown that light and temperature dramatically affect Neurospora biochemistry of circadian components. In nature, we should not consider circadian output to follow a smooth pattern, but rather, we can expect complex patterns related to complex responses and feedback mechanisms.. Downloaded from jbr.sagepub.com at PONTIFICIA UNIVERSIDAD CATOLICA DE CHILE on May 16, 2016.
(10) Gooch et al. / KINETIC EFFECTS OF LIGHT 47. Acknowledgments The authors thank Amanda (Spielman) Tembreull, Melissa Touroutoutoudis, and Alexandra Pagel for their help in data collection and interpretation. They also thank L.L. and J.C.D. for the development and supply of the Neurospora strains. NIH grants to J.C.D and J.J.L. (RO1 GM34985 primarily, with GM083336 and P01 GM68087) supported the research. Fondo Nacional de Desarrollo Científico y Tecnológico FONDECYT 1131030 to L.F.L. Undergraduate research rewards from the University of Minnesota at Morris supported the following students: A.E.J. (MAP 2008), B.T.N. (UROP 2008), J.A.F. (MAP 2006, UROP 2005), J.A.M. (MAP 2008, UROP 2009), Melissa Touroutoutoudis (MAP 2005), Alexandra Pagel (UROP 2007), and Amanda Spielman (UROP, 1999).. Conflict of Interest Statement The author(s) declared no potential conflicts of interest with respect to the research, authorship, and/or publication of this article.. Note Supplementary online material is available on the journal’s website at http://jbr.sagepub.com/supplemental.. References Belden WJ, Loros JJ, and Dunlap JC (2007) Execution of the circadian negative feedback loop in Neurospora requires the ATP-dependent chromatin-remodeling enzyme CLOCKSWITCH. Mol Cell 25:587-600. Bird RE and Hulstrom RL (1981) Simplified Clear Sky Model for Direct and Diffuse Insolation on Horizontal Surfaces. Technical Report No SERI/TR-642-761, Golden, CO: Solar Energy Research Institute. Boulos Z, Macchi MM, and Terman M (2002) Twilights widen the range of photic entrainment in hamsters. J Biol Rhythms 17:353-363. Chen CH, DeMay BS, Gladfelter AS, Dunlap JC, and Loros JJ (2010a) Physical interaction between VIVID and white collar complex regulates photoadaptation in Neurospora. Proc Natl Acad Sci U S A 107:16715-16720. Chen CH, Dunlap JC, and Loros JJ (2010b) Neurospora illuminates fungal photoreception. Fungal Genet Biol 47:922-929. Chen CH, Ringelberg CS, Gross RH, Dunlap JC, and Loros JJ (2009) Genome-wide analysis of light-inducible responses reveals hierarchical light signalling in Neurospora. EMBO J 28:1029-1042.. Correa A, Lewis ZA, Greene AV, March IJ, Gomer RH, and Bell-Pedersen D (2003) Multiple oscillators regulate circadian gene expression in Neurospora. Proc Natl Acad Sci U S A 100:13597-13602. Corrochano LM (2011) Fungal photobiology: a synopsis. IMA Fungus 2:25-28. Crosthwaite SK, Loros JJ, and Dunlap JC (1995) Lightinduced resetting of a circadian clock is mediated by a rapid increase in frequency transcript. Cell 81:1003-1012. Dharmananda S (1980) Studies of the circadian clock of Neurospora crassa: light-induced phase shifting. PhD thesis, University of California–Santa Cruz. Dunlap JC and Loros JJ (2005) Neurospora photoreceptors. In Handbook of Photosensory Receptors, Briggs WR and Spudich JL, eds, pp 371-389. Weinheim, Germany: Wiley-VCH Verlag GmbH & Co. KGaA. Dunlap JC and Loros JJ (2006) How fungi keep time: circadian system in Neurospora and other fungi. Curr Opin Microbiol 9:579-587. Elvin M, Loros JJ, Dunlap JC, and Heintzen C (2005) The PAS/LOV protein VIVID supports a rapidly dampened daytime oscillator that facilitates entrainment of the Neurospora circadian clock. Genes Dev 19:2593-2605. Evans JA, Elliott JA, and Gorman MR (2007) Circadian effects of light no brighter than moonlight. J Biol Rhythms 22:356-367. Friedl MA, Kubicek CP, and Druzhinina IS (2008) Carbon source dependence and photostimulation of conidiation in Hypocrea atroviridis. Appl Environ Microbiol 74:245-250. Froehlich AC, Liu Y, Loros J, and Dunlap JC (2002) White Collar-1, a circadian blue light photoreceptor, binding to the frequency promoter. Science 297:815-819. Froehlich AC, Loros JJ, and Dunlap JC (2003) Rhythmic binding of a WHITE COLLAR-containing complex to the frequency promoter is inhibited by FREQUENCY. Proc Natl Acad Sci U S A 100:5914-5919. Gooch VD (2007) Limit Cycle Displacement Model of Circadian Rhythms. Faculty Working Papers, Paper 11. Morris, MN: University of Minnesota–Morris 2:1. Gooch VD, Johnson AE, Larrondo LF, Loros JJ, and Dunlap JC. (2014) Bright to dim oscillatory response of the Neurospora circadian oscillator. J Biol Rhythms 29:49-59. Gooch VD, Mehra A, Larrondo LF, Fox J, Touroutoutoudis M, Loros JJ, and Dunlap JC (2008) Fully codon-optimized luciferase uncovers novel temperature characteristics of the Neurospora clock. Eukaryot Cell 7:28-37. Gooch VD, Wehseler RA, and Gross CG (1994) Temperature effects on the resetting of the phase of the Neurospora circadian rhythm. J Biol Rhythms 9:83-94. Heintzen C, Loros JJ, and Dunlap JC (2001) The PAS protein VIVID defines a clock-associated feedback loop that represses light input, modulates gating, and regulates clock resetting. Cell 104:453-464. Hunt SM, Thompson S, Elvin M, and Heintzen C (2010) VIVID interacts with the WHITE COLLAR complex. Downloaded from jbr.sagepub.com at PONTIFICIA UNIVERSIDAD CATOLICA DE CHILE on May 16, 2016.
(11) 48. JOURNAL OF BIOLOGICAL RHYTHMS / February 2014. and FREQUENCY-interacting RNA helicase to alter light and clock responses in Neurospora. Proc Natl Acad Sci U S A 107:16709-16714. Johnson CH, Elliott JA, and Foster R (2003) Entrainment of circadian programs. Chronobiol Int 20:741-774. Lakin-Thomas PL, Bell-Pedersen D, and Brody S (2011) The genetics of circadian rhythms in Neurospora. Adv Genet 74:55-103. Liu Y, Merrow M, Loros JJ, and Dunlap JC (1998) How temperature changes reset a circadian oscillator. Science 281:825-829. Malzahn E, Ciprianidis S, Kaldi K, Schafmeier T, and Brunner M (2010) Photoadaptation in Neurospora by competitive interaction of activating and inhibitory LOV domains. Cell 142:762-772. Peterson EL (1980) A limit cycle interpretation of a mosquito circadian oscillator. J Theor Biol 84:281-310. Remi J, Merrow M, and Roenneberg T (2010) A circadian surface of entrainment: varying T, τ, and photoperiod in Neurospora crassa. J Biol Rhythms 25:318-328. Rieger D, Fraunholz C, Popp J, Bichler D, Dittmann R, and Helfrich-Forster C (2007) The fruit fly Drosophila melanogaster favors dim light and times its activity peaks to early dawn and late dusk. J Biol Rhythms 22:387-399. Rieger D, Peschel N, Dusik V, Glotz S, and Helfrich-Forster C (2012) The ability to entrain to long photoperiods differs between 3 Drosophila melanogaster wild-type strains and is modified by twilight simulation. J Biol Rhythms 27:37-47. Roenneberg T and Foster RG (1997) Twilight times: light and the circadian system. Photochem Photobiol 66:549-561. Roenneberg T, Remi J, and Merrow M (2010) Modeling a circadian surface. J Biol Rhythms 25:340-349. Sargent ML and Briggs WR (1967) The effects of light on a circadian rhythm of conidiation in Neurospora. Plant Physiol 42:1504-1510.. Sargent ML, Briggs WR, and Woodward DO (1966) Circadian nature of a rhythm expressed by an invertaseless strain of Neurospora crassa. Plant Physiol 41: 1343-1349. Saunders DS (1976) The circadian eclosion rhythm in Sarcophaga argyrostoma: some comparisons with the photoperiodic “clock.” J Comp Physiol 110:111-133. Shrode LB, Lewis ZA, White LD, Bell-Pedersen D, and Ebbole DJ (2001) vvd is required for light adaptation of conidiation-specific genes of Neurospora crassa, but not circadian conidiation. Fungal Genet Biol 32:169-181. Smith KM, Sancar G, Dekhang R, Sullivan CM, Li S, Tag AG, Sancar C, Bredeweg EL, Priest HD, and McCormick RF, et al. (2010) Transcription factors in light and circadian clock signaling networks revealed by genomewide mapping of direct targets for Neurospora White Collar Complex. Eukaryot Cell 9:1549-1556. Tan Y, Dragovic Z, Roenneberg T, and Merrow M (2004) Entrainment dissociates transcription and translation of a circadian clock gene in Neurospora. Curr Biol 14:433-438. Vanin S, Bhutani S, Montelli S, Menegazzi P, Green EW, Pegoraro M, Sandrelli F, Costa R, and Kyriacou CP (2012) Unexpected features of Drosophila circadian behavioural rhythms under natural conditions. Nature 484:371-375. Vitalini MW, de Paula RM, Park WD, and Bell-Pedersen D (2006) The rhythms of life: circadian output pathways in Neurospora. J Biol Rhythms 21:432-444. Vogel HJ (1956) A convenient growth medium for Neurospora (medium N.). Microb Genet Bull 13:42-43. Winfree AT (1980) The Geometry of Biological Time. New York: Springer Verlag. Yu Y, Dong W, Altimus C, Tang X, Griffith J, Morello M, Dudek L, Arnold J, and Schuttler HB (2007) A genetic network for the clock of Neurospora crassa. Proc Natl Acad Sci U S A 104:2809-2814.. Downloaded from jbr.sagepub.com at PONTIFICIA UNIVERSIDAD CATOLICA DE CHILE on May 16, 2016.
(12)
Figure

+3
Documento similar
How a universal, empirical craft- based activity has been turned into a globalized industry following government intervention in the housing market after World War I,
Parameters of linear regression of turbulent energy fluxes (i.e. the sum of latent and sensible heat flux against available energy).. Scatter diagrams and regression lines
It is generally believed the recitation of the seven or the ten reciters of the first, second and third century of Islam are valid and the Muslims are allowed to adopt either of
In the preparation of this report, the Venice Commission has relied on the comments of its rapporteurs; its recently adopted Report on Respect for Democracy, Human Rights and the Rule
In the “big picture” perspective of the recent years that we have described in Brazil, Spain, Portugal and Puerto Rico there are some similarities and important differences,
The circadian rhythm is well-marked in the FTF (Fig.. 66 Carricaburu et al.: Circadian rhythm in Lycosa • ACTA ZOOL. Diurna! ERGs of the posterior median eye. Nocturnal ERGs of
On the other hand at Alalakh Level VII and at Mari, which are the sites in the Semitic world with the closest affinities to Minoan Crete, the language used was Old Babylonian,
Plotinus draws on Plato’s Symposium (206c4–5) – “procreate in what is beautiful” – 3 in order to affirm that mixed love (which is also a love of beauty) is fecund, although
