Mesoscale hydrodynamics around the Balearic Islands: spatio temporal variability and its relation with shing resources
153
0
0
Texto completo
(2)
(3) Doctoral Thesis July 2014 Programa de Doctorat en Fı́sica MESOSCALE HYDRODYNAMICS AROUND THE BALEARIC ISLANDS: SPATIO-TEMPORAL VARIABILITY AND ITS RELATION WITH FISHING RESOURCES Ángel M. Amores Maimó Director: Sebastià Monserrat Tomàs.
(4)
(5) Mesoscale Hydrodynamics and Fishing Resources. List of Publications included in the Doctoral Thesis:. • Amores, A. and S. Monserrat. Hydrodynamic comparison between the north and south of Mallorca Island. J. Marine Systems, 2014. doi: 10.1016/j. jmarsys.2014.01.005. • Amores, A., S. Monserrat, and M. Marcos. Vertical structure and temporal evolution of an anticyclonic eddy in the Balearic Sea (western Mediterranean). J. Geophys. Res. Oceans, 118:2097–2106, 2013a. doi: 10.1002 /jgrc.20150. • Pasqual,C., A. Amores, M. M. Flexas, S. Monserrat and A. Calafat. Environmental factors controlling particulate mass fluxes on the Mallorca continental slope (Western Mediterranean Sea). Accepted in J. Marine Systems, 2014. • Amores, A., L. Rueda, S. Monserrat, B. Guijarro, C. Pasqual, and E. Massutı́. Influence of the hydrodynamic conditions on the accessibility of Aristeus antennatus and other demersal species to the deep water trawl fishery off the Balearic Islands (western Mediterranean). J. Marine Systems, 2013b. doi: 10.1016/ j.jmarsys.2013.11.014.. The 2012 quality features of the journals where the articles were published are:. Journal. Impact Factor. Category Name. Total Journals in Category. Journal Rank in Category. Quartile in Category. JMS1. 2.655. Geosciences, Multidisciplinary Marine & Freshwater Biology Oceanography. 172 100 60. 39 12 12. Q1 Q1 Q1. JGR2. 3.174. Geosciences, Multidisciplinary. 172. 23. Q1. 1 Journal. of Marine Systems 2 Journal of Geophysical Research. i.
(6)
(7) A Ángeles por ser la alegrı́a de mi vida.. A mis Padres, Ángel y Margarita, por haber estado ahı́ siempre..
(8)
(9) Mesoscale Hydrodynamics and Fishing Resources. Agraı̈ments En primer lloc haurem d’agraı̈r al qui ha pagat sa festa. Aquesta tesi ha estat duita a terme a l’Institut Mediterrani d’Estudis Avanats (IMEDEA) i ha estat possible gràcies al finançament rebut a través d’una beca JAE-PreDoc del CSIC cofinançada pel ”Programa Operativo FSE 20072013”. També he d’agraı̈r al projecte IDEADOS (proyecto del Plan Nacional CMT2008-04489-C03-03), gràcies al qual hem pogut disposar del finançament necessari per recopilar les dades emprades a aquesta tesi entre d’altres coses. Ara que ja hem agraı̈t a les institucions, anem a per lo important, que són les persones. A nen Sebastià Monserrat li dec aquesta tesi. És tan seva (si no més) com meva. Sense la seva ajuda (acadèmica, moral, institucional, en persona, per Skype,...) aquest treball no hagués estat possible. He après molt treballant al seu costat i esper seguir aprenent d’ell. No sé a quina fase ens trobam ara, però crec que estam acabant sa B i començarem en breu sa C. Amb na Marta Marcos he après el que sé de models, simulacions i sèries climàtiques. Ha estat un plaer poder treballar amb ella i esper poder seguir fent-ho al futur. Moltes gràcies pel teu temps i pel que m’has ensenyat. També vull agraı̈r el seu temps que han dedicat amb jo als altres membres del grup, en Damià Gomis, en Biel Jordà i n’Antonio Sánchez. I also want to thank Richard Thomson for the possibility of visiting the Institute of Oceanographic Sciences in Sidney, Canada, during one month. Thank you for your hospitality, your help and your time wasted with me. No em puc oblidar de tot l’equip del projecte IDEADOS (Rosa Balbı́n, Jose Luı́s López Jurado, Alberto Aparicio,...) amb els que vaig compartir hores de vaixell, tant en la instalació i manteniment dels fondejos aixı́ com en les campanyes oceanogràfiques. Són els únics que poden dir que m’han vist ”tirat” a sa coberta d’un vaixell.. v.
(10) Ángel M. Amores Maimó. Encara que només hagi passat la darrera part de la meva tesi amb ells, estic molt agraı̈t als meus companys de despatx. Els presentarem com una banda de rock (s’ha de llegir com presentant a cada integrant). A la meva esquena trobam en Josep Llasses, responsable d’haver-me inoculat el virus FIFA i d’aixecar-me cada dia abans de que surti el Sol per anar a aixecar pes. Amb ell he passat moltes hores de discussió cientı́fica i no tant cientı́fica. A més, he après molt d’ell, de la seva manera de veure i viure la vida. A la meva esquerra es seu na Maribel Cerezo. Amb ella he pres molts cafès i hem fet moltes hores de tertúlia. Ella va aconseguir el que no havia aconseguir ningú: treure’m de festa un dijous! Més a l’esquerra trobam s’únic doctor entre noltros, en Jorge Arrieta. En ell veig s’evolució d’un doctorant com jo cap a investigador postdoctoral i m’ha obert els ulls de lo complicat que és obrir-se pas a aquest món tan competitiu. A la meva dreta es seu na Laura Ramajo, a sa que sempre tortur amb imatges mentals que no li agrada visualitzar. I finalment, i no per això menys important, en Miquel Cabanellas. Amb ell hem discutit molt sobre futbol, possibles inversions i junts hem après LATEX. M’hauré quedat amb ses ganes d’anar a pescar bons calamars de potera amb algú que realment sap de pesca i de calamars.. ,. Tampoc m’he d’oblidar dels companys del despatx del costat, que encara que no estiguem tan plegats també han estat allà. Entre ells hi ha n’Adrián Martı́nez, en Romain Escudier, en Juanma Sayol, na Bàrbara Barceló, en Dani Conti, ... Els dinars a la UIB no serien el mateix sense en David Martinez, Diego Carrió i Maria Tous (que ens acompanya menys, per ho fa). Encara que per coses del destı́ no ens veim tant com m’agradaria, durant aquets anys de tesi he fet bons amics i companys entre els estudiants de l’IFISC. Destaquen sobretot en Ricardo Martı́nez (”alias el canario”), en Pablo Fleuquı́n (”el charrúa”) i en Miguel Ángel Escalona (”el venezolano”). Amb ells, entre molts altres bons moments, sempre recordaré ses incursons de pesca submarina, els partidets de futbol aixı́ com ses torrades a l’estil d’Uruguay. Quan vaig començar Fı́sica vaig conèixer a n’Andreu Adrover, en Diego Carrió (ya vuelves a salir!!) i en Nico Villalonga. Amb ells he passat molts bons moments durant la carrera i els seguim passant en l’actualitat. Esper que la nostra amistat duri per molts d’anys encara que les nostres feines ens separin kilòmetres enfora. També estic molt agraı̈t a la totalitat de la meva famı́lia, els que hi són. vi.
(11) Mesoscale Hydrodynamics and Fishing Resources. i els que ja no. Gràcies a ells he arribat on som ara mateix. La meva tia Maria sempre s’ha preocupat per jo i ha estat com una segona mare. Moltes gràcies per tot el que has fet i fas. No em puc oblidar de sa meva padrina Francisca, que sempre m’ha cuidat, encara que de tant en tant corria darrera jo amb sa sabata. Si hagués d’escriure una frase per tothom no acabaria mai, per això vos incloc a tots dins aquest gràcies! Als meus Pares, n’Àngel i na Margalida, els ho dec tot. Si he arribat on som ha estat per sa seva feina, la seva ajuda i les hores que han passat amb jo. Tot el que digui no serà suficient per agraı̈r el que heu fet per jo. Moltes gràcies. Ángeles, aunque llevamos poco tiempo juntos, puedo asegurar que este tiempo contigo ha sido del mejor y más feliz de mi vida. La vida és, simplemente, mejor contigo. Tu optimismo se contagia, exhalas alegrı́a por cada uno de tus poros y me haces ser mejor persona. Espero que el futuro nos depare muchas alegrı́as y buenos momentos durante mucho tiempo, y no dudes que también estaré ahı́ en los malos momentos que nos toque vivir. Por eso no puedo dejar de agradecerte que estés conmigo apoyándome en todo momento, dándome ánimos constantemente y preocupándote por mı́ siempre. Gracias por estar a mi lado!. vii.
(12)
(13) Mesoscale Hydrodynamics and Fishing Resources. Abstract The Balearic Islands, located in the Western Mediterranean Sea, are the natural limit between the Balearic subbasin, at the noth and the Algerian subbasin, at the south. Previous studies based on hydrographic data have revealed that each of the basins have a different oceanographic climatology. One one hand, the Balearic subbasin has colder and saltier waters as a result of the water modification during the cyclonic circulation of the Mediterranean Sea. On the other, the Algerian subbasin waters are warmer and fresher, incoming directly from the Atlantic Ocean and entering into the Mediterranean through the Strait of Gibraltar. These two subbasins are connected via the topographic channels between the islands, whose hydrodynamic properties are governed by the mesoscale situation: non-permanent small scale phenomena (.100 km). Studying the mesoscale situation around the Balearic Islands can be useful for understanding how the water exchanges between the two subbasins are. Moreover, mesoscale structures, such as eddies, filaments or fronts, can temporarily change the hydrodynamic conditions. When it occurs, mesoscale variability not only affects the hydrodynamic conditions (water exchanges, alteration of the main currents, . . . ), but may also impact on the local ecosystems. Understanding how the fishing resources from the Balearic Islands are affected by the mesoscale hydrodynamic situation has been one of the objectives of the IDEADOS project (CMT2008-04489-C03-01), the framework in which this thesis has been developed. The project focused in two areas of fishing interest: one located northwards of Mallorca Island, in the Balearic subbasin (Sóller), and another placed southwards, inside the Mallorca Channel (Cabrera). As part of the above mentioned research project, two mooring lines were deployed, one in the limit of each fishing ground and were maintained during 15 months. Using recorded data from the moorings, together with satellite observations and landing data from different species, we addressed questions such as: How is the hydrodynamic activity in each zone and which are the similarities and/or differences between both places. ix.
(14) Ángel M. Amores Maimó. from an oceanographic perspective? Which are the main features of the mesoscale phenomena detected? And, how does the hydrography affect the sediment flux dynamics and the fishing resources of each zone? The chapters of this thesis, which correspond to published articles in scientific journals, are organized following the previous questions. In the first chapter the data recorded by each mooring is analyzed with the aim of characterizing each zone and compare them. Derived from this study and in the second chapter, one of the mesoscale events detected in Sóller is deeply analyzed. This structure was an eddy which lasted about one month, reached down to the sea floor and completely changed the mean oceanographic properties in the complete water column. In the third chapter, the data collected by the sediment traps is analyzed and a relationship between the sediment fluxes measured and the possible triggering mechanisms is addressed. Finally, a study about the relationship between the observed hydrodynamics and the red shrimp (Aristeus antennatus) dynamics is performed. It is observed that the adult individuals of red shrimp would be affected by the bottom turbidity generated by the mesoscale phenomena. In turn, they would respond moving away from the fishing grounds, probably towards greater depths. As the main mesoscale events take place in Sóller during winter time, this could provoke the reported reduction of the amount of large individuals of red shrimp caught during this part of the year in this fishing ground. The results of this thesis reinforce the lately recognized theory that fishing resources are not only affected by their exploitation or the self oscillations of the ecosystem (biotic factors), but they are also influenced by the changing oceanographic situation (abiotic factor).. x.
(15) Mesoscale Hydrodynamics and Fishing Resources. Resumen. Las Islas Baleares, situadas en el Mar Mediterráneo Occidental, son el lı́mite natural entre la subcuenca Balear, al norte y la subcuenca Argelina, al sur. Estudios previos basados en datos hidrográficos han revelado que cada una de las cuencas posee una climatologı́a oceanográfica caracterı́stica: la subcuenca Balear contiene aguas más frı́as y salinas como resultado de la modificación de las aguas durante la circulación ciclónica del Mediterráneo, mientras que la subcuenca Argelina contiene aguas más calientes y menos salinas provenientes directamente de aguas Atlánticas que entran por el estrecho de Gibraltar. Estas dos subcuencas están conectadas a través de los canales entre las islas, cuya hidrodinámica está dominada por la situación de mesoscala: fenómenos de escala pequeña (.100km) y que no son permanentes en el tiempo. Intentar conocer mejor la situación de mesoscala alrededor de las Islas Baleares puede ayudar a entender como son los intercambios de aguas entre las dos subcuencas. Además, los fenómenos asociados a la mesoscala, como son los vórtices, filamentos o frentes, pueden cambiar por completo la hidrodinámica temporalmente. En ese instante, los efectos de la mesoscala se extienden, no sólo a la oceanografı́a fı́sica (intercambio de aguas, alteración de las principales corrientes, entre otras), sino que también puede afectar a los ecosistemas de la zona. Entender como se ven afectados los recursos pesqueros de las Islas Baleares por la situación hidrodinámica de mesoscala ha sido uno de los objetivos del proyecto IDEADOS (CMT2008-04489-C03-01), marco en el que se ha desarrollado esta tesis. El proyecto se centró en el estudio de dos zonas de pesca: una situada al norte de Mallorca, dentro de la subcuenca Balear y conocida como Sóller, y una localizada más al sur, dentro del canal de Mallorca y conocida como Cabrera. Para recoger los datos oceanográficos necesarios para la elaboración de este estudio, se instaló una lı́nea de fondeo durante 15 meses en el lı́mite de cada una de las zonas de pesca. Con estos datos y con la ayuda de datos de satélite y de capturas de diferentes. xi.
(16) Ángel M. Amores Maimó. especies, se ha intentado dar respuesta a preguntas como: ¿cómo es la hidrografı́a de cada una de las zonas y cuales son las similitudes o diferencias entre las dos zonas? ¿Qué caracterı́sticas tienen los fenómenos de mesoscala detectados? Y, ¿cómo afecta la hidrografı́a a la dinámica del flujo de sedimentos y a los recursos pesqueros de cada zona? Los capı́tulos de resultados de esta tesis, que son reproducciones fieles de los artı́culos publicados en revistas cientı́ficas, están organizados para intentar responder a las preguntas acabadas de plantear. En el primer capı́tulo se analizan los datos recogidos por cada uno de los fondeos con el objetivo de fondo de caracterizar cada una de las zonas y compararlas entre ellas. Derivado de este estudio, ya en el segundo capı́tulo, se analiza en detalle uno de los eventos de mesoscala más intensos que se registró en Sóller: un vórtice que duró alrededor de un mes, llegando al fondo marino y que cambió por completo las propiedades oceanográficas promedio de la zona en toda la columna de agua. En el tercer capı́tulo se estudian los datos provenientes de cada una de las trampas de sedimentos presentes en los fondeos y se relacionan los flujos totales de masa recogidos con los posibles mecanismos generadores. Finalmente, se elabora un estudio sobre la relación de la hidrodinámica y las capturas de gamba roja (Aristeus antennatus). Se deduce que los individuos adultos de gamba roja se verı́an afectados por la turbidez de fondo generada por los fenómenos de mesoscala, y responderı́an alejándose de las zonas de pesca, probablemente hacia profundidades mayores. Ya que los eventos de mesoscala más importantes se dan en Sóller y principalmente en invierno, esto provocarı́a que la cantidad de gamba roja grande capturada durante esta época del año se viese reducida en este caladero. Los resultados de esta tesis refuerzan la teorı́a de que los recursos pesqueros no sólo se ven afectados por su explotación o por las oscilaciones del propio ecosistema (factores bióticos) sino que también se ven influenciados por la situación oceanográfica cambiante (factor abiótico).. xii.
(17) Mesoscale Hydrodynamics and Fishing Resources. Resum. Les Illes Balears, situades a la Mar Mediterrània Occidental, són el lı́mit natural entre la subconca Balear, al nord, i la subconca Algeriana, al sud. Estudis previs basats en dades hidrogràfiques han revelat que cada una de les conques posseix una climatologia oceanogràfica caracterı́stica: la subconca Balear conté aigües més fredes i salines com a resultat de la modificació de les aigües durant la circulació ciclònica a la Mediterrània, mentre que la subconca Algeriana conté aigües més calentes i menys salines provenents directament d’aigües Atlàntiques que entren per l’estret de Gibaltar. Aquestes dues subconques estan connectadas a través dels canals entre les illes, la hidrodinàmica dels quals està dominada per la situació de mesoscala: fenòmens d’escala més petita (. 100km) i que no són permanents en el temps. Intentar conèixer millor la situació de mesoscala al voltant de les Illes Balears pot ajudar a entendre com són els intercanvis d’aigües entre les dues subconques. A més, els fenòmens associats a la mesoscala, com són vòrtexs, filaments o fronts, poden canviar per complet la hidrodinàmica temporalment. En aquest moment, els efectes de la mesoscala s’extenen, no tan sols a la ocenografia fı́sica (intercanvi d’aigües, alteració de les principals corrents, entre d’altres), sinó que també poden afectar als ecosistemes de la zona. Entendre com es veuen afectats els recursos pesquers de les Illes Balears per la situació hidrodinàmica de mesoscala ha estat un dels objectius del projecte IDEADOS (CMT2008-04489-C03-01), marc en el que s’ha desenvolupat aquesta tesi. El projecte es va centrar en l’estudi de dues zones de pesca: una situada al nord de Mallorca, dins la subconca Balear i coneguda con Sóller, i una localitzada més al sud, dins al canal de Mallorca i coneguda com Cabrera. Per recollir les dades oceanogràfiques necessàries per a l’elaboració de l’estudi, es va instal·lar una lı́nia de fondeig durant 15 mesos al limit de cada una de les zones de pesca. Amb aquestes dades i amb l’ajuda de dades de satèl·lit i de captures de diferents espècies, s’ha intentat donar resposta a qüestions com: com es la hidrografia de. xiii.
(18) Ángel M. Amores Maimó. cada una de les zones i quines són les similituts o diferencies entre les dues zones? Quines caracterı́stiques tenen els fenòmens de mesoscala detectats? I, com afecta la hidrografia a la dinàmica del fluxe de sediments i als recursos pesquers de cada zona? Els capı́tols de resultats d’aquesta tesi, que són reproduccions fidels dels articles publicats en revistes cientı́fiques, estan organitzats per intentar respondre a les preguntes plantejades abans. En el primer capı́tol s’analitzen les dades recollides per cada un dels fondejos amb l’objectiu de fons de caracteritzar cada una de les zones i comparar-les entre elles. Derivat d’aquest estudi, en el segon capı́tol, s’analitza en detall un dels events de mesoscala més intens que es va enregistrar a Sóller: un vòrtex que durà al voltant d’un mes, arribant al fons marı́ i que canvià per complet les propietats oceanogràfiques promig de la zona en tota la columna d’aigua. En el tercer capı́tol s’estudien les dades provinents de cada una de les trampes de sediments presents als fondejos i es relacionen els fluxes totals de massa recollits amb els possibles mecanismes generadors. Finalment, s’elabora un estudi sobre la relació de la hidrodinàmica i les captures de gamba vermella (Aristeus antennatus). En ell es dedueix que els individus adults de gamba vermella es veurien afectats per la terbolesa de fons generada pels fenòmens de mesoscala, i respondrien allunyant-se fora de la zona de pesca, probablement cap a profunditats majors. Com que els events més importants de mesoscala es donen a Sóller i principalment a l’hivern, això faria que la quantitat de gamba vermella grossa capturada durant aquesta època de l’any es ves reduı̈da a aquest calader. Els resultats d’aquesta tesi reforcen la teoria de que els recursos pesquers no sols es veuen afectats per la seva explotació o per les oscil· lacions del propi ecosistema (factors biòtics) sinó que també es veuen influenciats per la sitació oceanogràfica canviant (factor abiòtic).. xiv.
(19) Contents Contents. xv. Introduction The Region Under Study . . . . . . . . . . . Hydrodynamics around the Balearic Islands Hydrodynamic vs Fishing Resources. . . . . Mooring description . . . . . . . . . . . . . Satellite data . . . . . . . . . . . . . . . . . Bibliography . . . . . . . . . . . . . . . . .. . . . . . .. . . . . . .. . . . . . .. . . . . . .. . . . . . .. . . . . . .. . . . . . .. 1 Hydrodynamic comparison between the north and lorca Island 1.1 Introduction . . . . . . . . . . . . . . . . . . . . . . 1.2 Data Sets and Methodology . . . . . . . . . . . . . 1.3 Results . . . . . . . . . . . . . . . . . . . . . . . . . 1.4 Summary and Conclusions . . . . . . . . . . . . . . Bibliography . . . . . . . . . . . . . . . . . . . . . . . .. . . . . . .. . . . . . .. . . . . . .. . . . . . .. . . . . . .. . . . . . .. . . . . . .. . . . . . .. south of Mal. . . . .. . . . . .. . . . . .. . . . . .. . . . . .. . . . . .. . . . . .. . . . . .. 2 Vertical structure and temporal evolution of an anticyclonic eddy in the Balearic Sea (western Mediterranean) 2.1 Introduction . . . . . . . . . . . . . . . . . . . . . . . . . . . . . . 2.2 Data Sets and Methodology . . . . . . . . . . . . . . . . . . . . . 2.3 Results and Discussion . . . . . . . . . . . . . . . . . . . . . . . . 2.3.1 Surface Description of the Eddy . . . . . . . . . . . . . . . 2.3.2 Vertical Structure of the Eddy . . . . . . . . . . . . . . . . 2.3.3 Recurrence of the Phenomenon . . . . . . . . . . . . . . . 2.4 Summary and Conclusions . . . . . . . . . . . . . . . . . . . . . . Bibliography . . . . . . . . . . . . . . . . . . . . . . . . . . . . . . . .. xv. 1 1 1 3 5 6 7. 11 12 14 15 27 29. 33 34 37 38 39 40 47 49 51.
(20) Ángel M. Amores Maimó. 3 Environmental factors controlling particulate mass fluxes on the Mallorca continental slope (Western Mediterranean Sea) 3.1 Introduction . . . . . . . . . . . . . . . . . . . . . . . . . . . . . . 3.2 Data Sets and Methodology . . . . . . . . . . . . . . . . . . . . . 3.3 On the origin of the measured sediment fluxes . . . . . . . . . . . 3.4 Ecological Implications . . . . . . . . . . . . . . . . . . . . . . . . 3.5 Summary and Conclusions . . . . . . . . . . . . . . . . . . . . . . Bibliography . . . . . . . . . . . . . . . . . . . . . . . . . . . . . . . .. 55 56 58 60 66 66 67. 4 Influence of the hydrodynamic conditions on the accessibility of the demersal species to the deep water trawl fishery off the Balearic Islands (western Mediterranean) 4.1 Introduction . . . . . . . . . . . . . . . . . . . . . . . . . . . . . . 4.2 Data and Methods . . . . . . . . . . . . . . . . . . . . . . . . . . 4.2.1 Catches . . . . . . . . . . . . . . . . . . . . . . . . . . . . 4.2.2 Hydrodynamic Data . . . . . . . . . . . . . . . . . . . . . 4.2.2.1 Satellite images . . . . . . . . . . . . . . . . . . . 4.2.2.2 Moorings . . . . . . . . . . . . . . . . . . . . . . 4.2.3 Statistical Analysis . . . . . . . . . . . . . . . . . . . . . . 4.3 Results and Discussion . . . . . . . . . . . . . . . . . . . . . . . . 4.4 Summary and Conclusions . . . . . . . . . . . . . . . . . . . . . . Bibliography . . . . . . . . . . . . . . . . . . . . . . . . . . . . . . . .. 73 74 77 77 78 78 79 79 80 88 89. Summary and Discussion Bibliography . . . . . . . . . . . . . . . . . . . . . . . . . . . . . . . .. 95 97. Conclusions. 99. Future Work Bibliography. 103 . . . . . . . . . . . . . . . . . . . . . . . . . . . . . . . . 104. Appendix A: characteristics of the water masses.. 107. Appendix B: features of the moored instruments.. 109. List of Figures. 111. List of Tables. 117. Global Bibliography. 119. Epı́leg. 133. xvi.
(21) Introduction The Region Under Study The Balearic Islands, located in the Western Mediterranean, are the natural limit between the Balearic and the Algerian subbasins (Fig. 1). These two areas are connected via channels between the islands. The Ibiza Channel (80 km wide, with a maximum depth of 800 m) is located between Cape La Nao (Iberian Peninsula) and Ibiza Island; the channel between Ibiza and Mallorca is known as the Mallorca Channel (80 km wide and 600 m deep); meanwhile the Menorca Channel, the shallowest (100 m deep) and narrowest (35 km wide) is located between Mallorca and Menorca Islands [Garcı́a et al., 1994]. The continental shelf of the Balearic subbasin (38◦ 450 to 42◦ 300 N and 0◦ 200 W to 4◦ 000 N) is relatively narrow (15-30 km), with the exception of the Ebro River delta southwards, where it becomes wider up to 60-70 km. The slope is very steep, with depth increasing from 200 m to over 1000 m in only a few kilometers. The shelf around the Islands, at both Balearic and Algerian sea sides, is even narrower (5-20 km) and the slope becomes steeper and discontinuous due to the previous mentioned channels between the islands. Further details about the topographic characteristics of the region can be found, for example, in Garcı́a et al. [1994].. Hydrodynamics around the Balearic Islands The mean circulation in the Balearic subbasin, situated north of the archipelago up to the Iberian Peninsula, is driven by a density gradient between the fresher coastal water and the relatively saltier water in the center of the subbasin. This density gradients form the Catalan Front [Font et al., 1988; Violette et al., 1990] near the Continental slope and the Balearic front along the islands slope. The Northern Current (NC), which is associated with the Catalan front, flows southward along the Iberian Peninsula slope, following the isobaths, and coming from the northern coast of Sicily, the western Italian coastline and the Ligurian and. 1.
(22) Ángel M. Amores Maimó. 72oN 54oN o. 36 N o. o. 18 N. 42 N. o. NC. 0. 30’. o. 18 S o. 36 S 54 S. Ebro River delta. ric. b Su. lea. 120oW. 60oW. 0o. 60oE. 120oE. 30’. BC. Ba. 72oS 180oW. 41oN. sin ba. o. 40oN. 180oW S. Menorca Channel. Mallorca. 30’ Mallorca Channel Ibiza Channel. n. as bb Su. ria ge Al. 1oW. 30’. 0o. 30’. 1oE. 30’. 2oE. 39oN. in. C Cape La Nao. 30’. 3oE. S. NC = Northern Current BC = Balearic Current C Mooring position. 30’. 4oE. 30’. 30’. 38oN 5oE. Figure 1: Map showing the main characteristics of the ocean circulation in the Balearic subbasin. The positions of the moorings are marked with an S inside a star for Sóller mooring and a C inside a square for Cabrera mooring. Isobaths are plotted between 500 m and 2500 m with a step of 500 m. Black arrows indicate the permanent currents, while the grey ones indicate the temporal features.. Provenal coast [Millot, 1999]. When the NC reaches the Ibiza Channel, two different behaviors are possible, depending on the mesoscale situation [Pinot et al., 2002]. Normally, a portion of the NC may leave the Balearic subbasin via the Ibiza and Mallorca Channels towards the Algerian subbasin, while the rest gets reflected northward to form the Balearic Current (BC) which flows along the Islands’ northern slope. In this case, the resident water between 200 m and 700 m, is mostly Levantine Intermediate Waters (LIW, refers to appendix A for further details of the water masses). When the previous winter had dry and cold winds as Mistral and Tramontane, which cause cooling and evaporation, an amount of Western Mediterranean Intermediate Waters (WIW) can be generated in the Gulf of Lion. This water mass is normally located between 100 m and 300 m and displaces the LIW forming the resident water at the intermediate depths [Mertens and Schott, 1998; Millot, 1999; Pinot et al., 2002]. When these WIW reach the Balearic Channels in late spring, the NC most often gets blocked and a different configuration of flow through the channels is observed. Most of the NC reflects northwards, reinforcing the BC, and the southward flow through the channels is reduced [Monserrat et al., 2008]. The deepest part of the water column, below. 2.
(23) Mesoscale Hydrodynamics and Fishing Resources. 700 m, is occupied by Western Mediterranean Deep Waters (WMDW). Refer to Massutı́ et al. [2014]; Millot [1999]; Pinot et al. [2002] for a better description of the circulation. The Algerian subbasin, the zone between the Balearic Islands and the north of Africa, is controlled by a completely different dynamics. The circulation of the Algerian subbasin is driven by the Algerian current which interacts with the Alboran sea gyres and spreads the Atlantic water towards the Balearic Islands. The northern part of the subbasin has no clear steady current, although its circulation is affected by the changes in the mesoscale structures in the southern part of the subbasin and the entrance of Mediterranean water coming in from the Balearic subbasin via the channels. The mesoscale processes in the Mediterranean Sea are important since they affect to the large-scale circulation and water masses distribution pattern with important consequences on the ecosystems. These mesoscale phenomena, such as eddies, filaments or meanders, can have an horizontal scale from few km to hundreds of km and their vertical range can be superficial or extend down to the bottom. Moreover, their life span can be from a few days to several weeks [Amores et al., 2013a], months [Pascual et al., 2002] or even years [Puillat et al., 2002]. For example, the Atlantic Water flowing in the Algerian Current can generate eddies of both signs, cyclonic or anticyclonic. Few times every year, these eddies might reach a diameter around 100 km and extend down to the seabed (more than 2000 m). Due to this vertical extension, which is deeper than the currents they were developed from, these eddies can follow the isobaths and leave the current path. The same structures are also formed in the Northern Current and the Balearic Current. These currents are strongly intensified during winter due to the deep water formation in the Gulf of Lions leading to the development of instabilities. An example of this process can be found in Amores et al. [2013a]. In this case, an anticyclonic eddy developed from an instability of the BC is described. It lasted for one month, reaching down to the bottom (around 900m) and modifying temporally the deep slope circulation.. Hydrodynamic vs Fishing Resources. Population dynamics has been and still is a topic of wide interest in oceanography around the world. One of the main factors that determine its evolution is human activity, either through fishing [Cook et al., 1997] or through polluting the ecosystems. Besides the human activity, the environmental variables have also been recognized as a factor affecting the population dynamics. Both types, abiotic (climate and hydrography) and biotic (trophic resources and predators) factors can produce intra- and inter-annual oscillations in the population evo-. 3.
(24) Ángel M. Amores Maimó. lution of the different fishing resources [Browman and Stergiou, 2004]. Due to that both biotic and abiotic factors are involved, a multidisciplinary approach is advised. Pursuing the objective of how these factors affect the deep water ecosystems and demersal resources of the Balearic Islands, the IDEA project Influence of oceanographic structure and dynamics on demersal populations in waters of the Balearic Islands was carried out between 2003 and 2006. On one hand, the intra-annual variability was studied through oceanographic surveys, monitoring the bottom trawl fishing fleet and studying the population dynamics of two key species, the European hake (Merluccius merluccius) and the red shrimp (Aristeus antennatus). On the other hand, long-term analysis of the parameters of these species and, climatic, meteorological and oceanographic indices were studied as inter-annual indicators of the environmental conditions. The main results of IDEA project were: • The development of models explaining how climatic conditions affect the hydrodynamics around the Balearic Islands [Monserrat et al., 2008]. • Different hydrodynamics scenarios were found in the fishing grounds of the bottom trawl fishing fleet [López-Jurado et al., 2008]. • It was observed that environmental and biological factors can influence the accessibility of the key species, as the hake [Cartes et al., 2009; Hidalgo et al., 2008a,b] and red shrimp [Cartes et al., 2008; Guijarro et al., 2008]. As a natural evolution of IDEA project, the IDEADOS project Structure and dynamics of the bentho-pelagic slope ecosystem in two oligotrophic zones of the western Mediterranean: a multidisciplinary approach at different spatio-temporal scales in the Balearic Islands was born in 2008 and lasted until 2013. It was designed to test the hypothesis arising from IDEA project with the main objective of determine the relationships between environmental conditions and the nektobenthic slope communities, in two zones north (here on called Sóller) and south (referred as Cabrera) of Mallorca island (Fig. 1) at an intra-annual scale. Among other studies, a mooring line was installed in each area (see the following section and appendix A for more details). The objective of setting these two moorings was double: a) On one hand, to study the intra-annual hydrodynamic variability in each zone of interest and find the similarities and differences between both locations. b) On the other hand, when the hydrodynamic features of both sides were established, seek a possible relation between the hydrodynamic and the red shrimp availability.. 4.
(25) Mesoscale Hydrodynamics and Fishing Resources. Moorings Description. Train Wheels. Acoustic Release. PPS3/3 Sediment Trap. CTD. Nortek Aquadopp. One mooring line was deployed in each area in order to collect the required hydrodynamic data. The line from Sóller was placed northwest of Mallorca Island (39◦ 49.682’ N - 2◦ 12.778’ E) meanwhile the mooring from Cabrera was located southwest of the island, into the Mallorca Channel (38◦ 59.484’ N - 2◦ 28.907’ E) (Fig. 1). Both moorings were deployed at about 900 m depth with a height of Nortek Aquadopp Billing Buoy 600 m above the seabed. Each moorHeading Buoy + CTD SBE37 ing consisted on four CTD (ConductivArgos Buoy ity, Temperature and Depth) Seabird Sediment Trap Acoustic Release 37 sensors placed at fixed depths at around 300 m, 500 m, 700 m and 900 m. In addition, two Nortek Aquadopp current meters were installed in the middle levels (at about 500 m) and near the bottom (around ~300m 900 m depth). A near-bottom PPS3/3 Technicap sequential sampling sediment trap (12 collecting cups, 0.125 m2 opening and 2.5 height/diameter aspect ratio for the cylindrical part) ~500m was placed 30 m above the bottom (an scheme of the mooring is shown in Fig. 2). The lines were held at the seabed with two train wheels of 250 kg each and an acoustic release allowed their ~700m recovery. Observations of the thermohaline properties and currents were collected at sampling rates of 10 min for the CTD, 30 min for the current meters and 10 days for the sediment ~900m traps. A list of the main properties of these instruments can be found in the appendix B. The moorings were continually Figure 2: Scheme of the moorings configuration. recording data from mid-November 2009 until mid-February 2011. During this period, two maintenances were required because of the selected sampling rate for the sediment traps. These maintenances took place in mid-March and in mid-September 2010. The depth where. 5.
(26) Ángel M. Amores Maimó. the instruments were located did not change significantly after the maintenances. The instruments encountered no significant problems during the whole period with the only exceptions of the 500m and 900m CTDs from Sóller and the 300m CTD from Cabrera which ran out of batteries around January 2011, about one month prior to the end of the experiment. The sediment trap time series have some gaps. The Cabrera sediment trap time series has a long gap in the middle of the experiment due to bad-working of the cups rotation mechanism. In addition the lack of ship availability during one of the scheduled maintenances produced another shorter gap at the time series from the trap at Sóller.. Satellite Data From the available satellite data products, Sea Surface Heigth (SSH) and Sea Surface Temperature (SST) were used. Daily gridded SSH fields with a map spacing of 1/8◦ ×1/8◦ were obtained from the merged satellite AVISO products available at www.aviso.oceanobs.com. The absolute dynamic topography is calculated as the sum of the sea level anomalies and the mean dynamic topography [Rio et al., 2007]. The regional sea level anomalies for the Mediterranean Sea available at AVISO server are a multimission product with up to 4 satellites at a given time, spanning the period from 1992 to present. All standard geophysical corrections were applied, including the so-called Dynamic Atmospheric Correction (DAC), produced by CLS. This correction combines the high frequency (H-F) of the Mog2D model [Carrère and Lyard , 2003] and the low frequency of the classical inverted barometer correction. These model outputs were used to correct the newly released altimeter data sets and therefore reducing the aliasing effects of H-F signals [Volkov et al., 2007]. The regional mean dynamic topography covers the Mediterranean Sea and it is based on 7 years of observations (1993−1999). Despite its good performance in the open ocean and the wide range of applications, the altimetric products, both gridded and along-track fail when approaching to the coast, mostly due to the land contamination in the signal. Several efforts are currently devoted to the recovery and improvement of near-coastal altimetry observations. However, this new generation of observations is not fully developed for the global coastal ocean yet, not even for the Mediterranean Sea. Daily sea surface temperature (SST) data were collected from MyOcean data base (http://www.myocean.eu). The regional gridded product for the Mediterranean Sea is a high resolution SST anomaly, computed using the CNR MED analysis at 1/16◦ ×1/16◦ horizontal resolution and starting in December 2010.. 6.
(27) Mesoscale Hydrodynamics and Fishing Resources. The thesis structure is the following. In the chapter 1, the data collected from both moorings is analyzed [Amores and Monserrat, 2014]. The hydrodynamic conditions of both places are studied and compared. It is observed that Sóller fishing ground is a more hydrodynamic active zone with numerous eddies, some of them reaching down to the bottom. In the next chapter, one of these eddies is analyzed in detail [Amores et al., 2013a]. It lasted around one month and clearly reached down to the seafloor, quintupling the mean near bottom currents and affecting to the resuspension of sediments and near bottom water turbidity. The quantification of the amount of sediments collected by the sediment traps at the moorings and their possible triggering mechanisms are studied in chapter 3 [Pasqual et al., 2013]. Accordingly to the greater hydrodynamic activity of Sóller, the amount of sediments collected by the sediment trap of this zone was also greater. Some evidences are shown suggesting most of these differences could be related to the eddies described in the previous chapters. Chapter 4 is where all the results from the previous three chapters are applied. It shows that the sediments resuspended by mesoscale features like the eddy described in chapter 2, can affect to the red shrimp ( Aristeus antennatus) catches, presumably forcing the large individuals to displace to greater depths, where they cannot be fished [Amores et al., 2013b]. After the results explained in chapters 1, 2, 3 and 4, a discussion of their implications is developed. Then, the main conclusions of this thesis are listed. The last part of this document is focused on the possible future work that could be carried out based on the results of this thesis.. Bibliography Amores, A., and S. Monserrat (2014), Hydrodynamic comparison between the north and south of Mallorca Island, J. Marine Systems, doi: 10.1016/ j.jmarsys.2014.01.005. Amores, A., S. Monserrat, and M. Marcos (2013a), Vertical structure and temporal evolution of an anticyclonic eddy in the Balearic Sea (western Mediterranean), J. Geophys. Res. Oceans, 118, 2097–2106, doi: 10.1002/jgrc.20150. Amores, A., L. Rueda, S. Monserrat, B. Guijarro, C. Pasqual, and E. Massutı́ (2013b), Influence of the hydrodynamic conditions on the accessibility of Aristeus antennatus and other demersal species to the deep water trawl fishery off the Balearic Islands (western Mediterranean), J. Marine Systems, doi: 10.1016/j.jmarsys.2013.11.014. Browman, H. I., and K. I. Stergiou (2004), Perspectives on ecosystem-based ap-. 7.
(28) Ángel M. Amores Maimó. proaches to the management of marine resources, Mar Ecol Prog Ser, 274, 269–303. Carrère, L., and F. Lyard (2003), Modelling the barotropic response of the global ocean to atmospheric wind and pressure forcing Comparisons with observations, Geophys. Res. Lett., 30, doi: 10.1029/2002GL016473. Cartes, J. E., V. Papiol, and B. Guijarro (2008), The feeding and diet of the deep-sea shrimp Aristeus antennatus off the Balearic Islands (Western Mediterranean): Influence of environmental factors and relationship with the biological cycle, Progress in Oceanography, 79, 37–54, doi: 10.1016/j.pocean.2008.07.003. Cartes, J. E., M. Hidalgo, V. Papiol, E. Massutı́, and J. Moranta (2009), Changes in the diet and feeding of the hake Merluccius merluccius at the shelf-break of the Balearic Islands: Influence of the mesopelagic-boundary community, Deep Sea Research Part I: Oceanographic Research Papers, 56 (3), 344 – 365, doi: 10.1016/j.dsr.2008.09.009. Cook, R. M., A. Sinclair, and G. Stefansson (1997), Potential collapse of North Sea cod stocks, Nature, 385, 521–522, doi: 10.1038/385521a0. Font, J., J. Salat, and J. Tintoré (1988), Permanent features in the general circulation of the Catalan Sea, Oceanol. Acta, 9, 51–57. Garcı́a, E., J. Tintoré, J. M. Pinot, J. Font, and M. Manriquez (1994), Surface Circulation and Dynamics of the Balearic Sea, Coastal Estuarine Stud., 46, 73–91, doi: 10.1029/CE046p0073. Guijarro, B., E. Massutı́, J. Moranta, and P. Dı́az (2008), Population dynamics of the red shrimp Aristeus antennatus in the Balearic Islands (western Mediterranean): Short spatio-temporal differences and influence of environmental factors, Journal of Marine Systems, 71 (3-4), 385–402, doi: 10.1016/j.jmarsys.2007.04.003. Hidalgo, M., E. Massutı́, J. Moranta, J. Cartes, J. Lloret, P. Oliver, and B. Morales-Nin (2008a), Seasonal and short spatial patterns in European hake (Merluccius merluccius L.) recruitment process at the Balearic Islands (western Mediterranean): The role of environment on distribution and condition, Journal of Marine Systems, 71 (34), 367 – 384, doi: 10.1016/j.jmarsys.2007.03.005. Hidalgo, M., J. Tomás, H. Høie, B. Morales-Nin, and U. S. Ninnemann (2008b), Environmental influences on the recruitment process inferred from otolith stable isotopes in Merluccius merluccius off the Balearic Islands, Aquat Biol, 3(3), 195 – 207, doi: 10.3354/ab00081.. 8.
(29) Mesoscale Hydrodynamics and Fishing Resources. López-Jurado, J. L., M. Marcos, and S. Monserrat (2008), Hydrographic conditions affecting two fishing grounds of Mallorca island (Western Mediterranean): during the IDEA Project (20032004), Journal of Marine Systems, 71, 303–315, doi: 10.1016/j.jmarsys.2007.03.007. Massutı́, E., M. Olivar, S. Monserrat, L. Rueda, and P. Oliver (2014), Towards understanding the influence of environmental conditions on demersal resources and ecosystems in the western Mediterranean: Motivations, aims and methods of the IDEADOS project, Journal of Marine Systems, doi: 10.1016/j.jmarsys. 2014.01.013. Mertens, C., and F. Schott (1998), Interannual variability of deep-water formation in the northwestern Mediterranean, J. Phys. Oceanogr., 28, 1410–1424, doi: 10.1175/1520-0485(1998)028h1410:IVODWFi2.0.CO;2. Millot, C. (1999), Circulation in the Western Mediterranean Sea, Journal of Marine Systems, 20, 423–442, doi: 10.1016/S0924-7963(98)00078-5. Monserrat, S., J. L. López-Jurado, and M. Marcos (2008), A mesoscale index to describe the regional circulation around the Balearic Islands, J. Mar. Syst., 71, 413–420, doi: 10.1016/j.jmarsys.2006.11.012. Pascual, A., B. B. Nardelli, G. Lanicol, M. Emelianov, and D. Gomis (2002), A case of an intense anticyclonic eddy in the Balearic Sea (western Mediterranean), J. Geophys. Res., 107(C11), 3183, doi: 10.1029/2001JC000913. Pasqual, C., A. Amores, M. Flexas, S. Monserrat, and A. Calafat (2013), Environmental factors controlling particulate mass fluxes on the Mallorca continental slope (Western Mediterranean Sea), Accepted in J. Marine Systems, XXX, XXX, doi: XXX. Pinot, J. M., J. L. López-Jurado, and M. Riera (2002), The canales experiment (19961998): interannual, seasonal, and mesoscale variability of the circulation in the Balearic Channels, Prog. Oceanogr., 55(3-4), 335–370, doi: 10.1016/ S0079-6611(02)00139-8. Puillat, I., I. Taupier-Letage, and C. Millot (2002), Algerian Eddies lifetime can near 3 years, Journal of Marine Systems, 31 (4), 245 – 259, doi: http://dx.doi. org/10.1016/S0924-7963(01)00056-2. Rio, M.-H., P.-H. Poulain, A. Pascual, E. Mauri, G. Larnicol, and R. Santoleri (2007), A mean dynamic topography of the mediterranean sea computed from altimetric data, in-situ measurements and a general circulation model, J. Mar. Syst., 65, 484–508, doi: 10.1016/j.jmarsys.2005.02.006.. 9.
(30) Ángel M. Amores Maimó. Violette, P. E. L., J. Tintoré, and J. Font (1990), The surface circulation of the Balearic Sea, J. Geophys. Res., 95, 1559–1568, doi: 10.1029/JC095ic02p01559. Volkov, D. L., G. Larnicol, and J. Dorandeu (2007), Improving the quality of satellite altimetry data over continental shelves, J. Geophys. Res., 112, C06,020, doi: 10.1029/2006JC003765.. 10.
(31) Chapter 1 Hydrodynamic comparison between the north and south of Mallorca Island La ciencia se compone de errores, que a su vez, son los pasos hacia la verdad. Julio Verne (1828-1905) This chapter has been published in: • Amores, A. and S. Monserrat. Hydrodynamic comparison between the north and south of Mallorca Island. J. Marine Systems, 2014. doi: 10.1016/j. jmarsys.2014.01.005. Abstract A hydrodynamic comparison between two zones of fishing interest, one located to the north and the other to the south of Mallorca Island (Balearic Islands, Western Mediterranean) was done. The comparison was conducted using the data from two moorings, one placed in the middle of the Balearic Current, in the Balearic subbasin (herein, Sóller) and the other in the Mallorca Channel, near the Algerian subbasin (called Cabrera). The instruments moored, continuously recorded the temperature, salinity and currents at different depths, for over 15 months. The data analysis suggests that Sóller is hydrodynamically more active than Cabrera, at least during the time of recording the measurements. The mean currents were higher at Sóller than at Cabrera at all depths, also showing greater maximum speeds and variability. In addition, the presence of more mesoscale eddies in Sóller became evident from the altimetry data. These eddies were not only significantly more energetic near the surface, they also generally. 11.
(32) Ángel M. Amores Maimó. reached to greater depths, affecting the velocities of the seabed currents. Subsequent to each significant eddy episode, strong changes in temperature and/or salinity were observed, along the entire water column. Spectral analysis revealed the presence of high frequency oscillations with periods of a few hours. One energy peak, with a period around 3.7h, was observed at both locations, probably related to trapped waves around Mallorca or the Balearic Islands, while others (3h and 2h) were reflected only in Sóller, suggesting they could be associated with some standing resonance waves between the Iberian Peninsula and Mallorca.. 1.1. Introduction. The Balearic Islands, located in the Western Mediterranean, are the natural limit between the Balearic and the Algerian subbasins (Fig. 1.1). These two areas are connected via channels between the islands. The Ibiza Channel (80 km wide, with a maximum depth of 800 m) is located between Cape La Nao (Iberian Peninsula) and Ibiza Island; the channel between Ibiza and Mallorca is known as the Mallorca Channel (80 km wide and 600 m deep); meanwhile the Menorca Channel, the shallowest (100 m deep) and narrowest (35 km wide) is located between the Mallorca and Menorca Islands [Garcı́a et al., 1994]. The mean circulation in the Balearic subbasin, situated north of the archipelago up to the Iberian Peninsula, is driven by a density gradient between the fresher coastal water and the relatively saltier water in the center of the subbasin. Due to this density gradient, the Northern Current (NC) flows southward along the Iberian Peninsula slope, following the isobaths. When the NC reaches the Ibiza Channel, two different behaviors are possible, depending on the mesoscale situation [Pinot et al., 2002]. Normally, a portion of the NC may leave the Balearic subbasin via the Ibiza and Mallorca Channels while the rest gets reflected northward to form the Balearic Current (BC) which flows along the Islands’ northern slope. The resident water between 200 m and 700 m, is mostly the Levantine Intermediate Waters (LIW). When the previous winter was particularly cold, the Western Mediterranean Intermediate Waters (WIW) generated in the Gulf of Lion and normally located between 100 m and 300 m, could have displaced the LIW forming the resident water at the intermediate depths [Mertens and Schott, 1998; Millot, 1999; Pinot et al., 2002]. When these WIW reach the Balearic Channels in late spring, the NC most often gets blocked and a different configuration of flow through the channels is observed. Most of the NC reflects northwards, reinforcing the BC, and the southward flow through the channels is reduced [Monserrat et al., 2008]. The Western Mediterranean Deep Waters (WMDW) are located in the deeper part of the water column, below 700 m (refer Massutı́ et al. [2014]; Millot [1999]; Pinot et al. [2002] for a better description of the circulation and. 12.
(33) Mesoscale Hydrodynamics and Fishing Resources. the properties of these water masses). The Algerian subbasin, the zone between the Balearic Islands and the north of Africa, is controlled by a completely different dynamics. The circulation of the Algerian subbasin is driven by the Algerian current which interacts with the Alboran sea eddies and spreads the Atlantic water towards the Balearic Islands. The northern part of the subbasin has no clear steady current, although its circulation is affected by the changes in the mesoscale structures in the southern part of the subbasin and the entrance of Mediterranean water coming in from the Balearic subbasin via the channels.. Pe. n.. o 42 N. o 38 N o. 36 N. bb. u cS. ri lea. o. 40 N S. Menorca Channel. Mallorca. 30’. 39 N. C Cape La Nao. Ibiza Channel. n ria. 30’. in as bb u S. ge. 38oN o 1W. Al 30’. 0. o. 30’. o. 1E. 30’. o. 2E. 0. −0.5. Mallorca Channel. o. 30’. S o. 3E. Sóller. C. Cabrera. −1.5. BC. Ba. S CTD CTD + current meter CTD CTD + current meter. −1. NC = Northern Current BC = Balearic Current C Mooring position. 30’. o. 4E. 30’. CTD CTD + current meter CTD CTD + current meter. Mallorca. Ebro River delta. Depth (km). 0. −1. in as. o o 4E 8E. o. o o 8W 4W. 30’. −0.5. 40 N Balearic Islands. 41oN. NC. o. Ib er ia n. 30’. 0. o 44 N. Mallorca. 42oN. −1.5 o. 5E. 0. 20. 40. km. 60. 80. 100. Figure 1.1: Map showing the main characteristics of the ocean circulation in the Balearic subbasin. The positions of the moorings are marked with an S inside a star for Sóller mooring and a C inside a square for Cabrera mooring. Isobaths are plotted between 500 m and 2500 m with a step of 500 m. Black arrows indicate the permanent currents, while the grey ones indicate the temporal features. The enclosed areas are 0.5◦ radius circles where the occurrence of eddies is checked (they seem to appear as ellipsoids due to the map projection). The bathymetric profiles correspond to the red lines indicated in the map.. The main objective of this study, which is included in the IDEADOS project [Massutı́ et al., 2014], is to analyze the similarities and differences in the hydrodynamic conditions between two zones of fishing interest, one situated in the Balearic subbasin, to the north of Mallorca Island and the other in the northern part of the Algerian subbasin, to the south of Mallorca. The results found are to be of significance for IDEADOS when assessing the manner in which the variability of the fishery resources in both areas might be driven by a different hydrodynamic frame. With this objective in mind, a mooring line was deployed in each zone to retrieve a set of hydrodynamic data to facilitate a comparison. One instrument line was located in the Balearic subbasin, near Sóller, while a. 13.
(34) Ángel M. Amores Maimó. second one was placed in the Mallorca Channel, in the northern part of the Algerian subbasin, close to Cabrera Island. The terms Sóller and Cabrera are used to identify these two regions throughout the manuscript (Fig. 1.1). In this work, we first present the mooring lines, instrumentation and the data set measured. Then, the methodology used is described and the most interesting results are shown. A detailed comparison between the two zones is elaborated. The last section includes the summary and conclusions drawn.. 1.2. Data Sets and Methodology. Hydrodynamic data were acquired using two identical mooring lines. The line from Sóller was placed on the northwest side of Mallorca Island (39◦ 49.682 N 2◦ 12.778 E) and the line from Cabrera was located on the southwest side of the island, into the Mallorca Channel (38◦ 59.484 N - 2◦ 28.907 E) (Fig. 1.1). The moorings were deployed at about 900 m depth to a height of 600 m above the seabed. Each mooring consisted of four CTD (Conductivity, Temperature and Depth) Seabird 37 sensors placed at fixed depths at around 300 m, 500 m, 700 m and 900 m. In addition, two Nortek Aquadopp current meters were installed in the middle levels (at about 500 m) and near the bottom (around 900 m depth). A sediment trap (not used in this study) was placed 30 m above the bottom. Observations of the thermohaline properties and currents were collected at sampling rates of 10 min for the CTD and 30 min for the current meters. The moorings were continually recording data from mid-November 2009 until mid-February 2011. During this period, two maintenances were required because of the selected sampling rate for the sediment traps. These maintenances took place in mid-March and in mid-September 2010. The depth where the instruments were located did not change significantly after the maintenances. The instruments encountered no significant problems during the whole period. The only exceptions were the CTDs at 500m and 900m in Sóller and the one at 300m in Cabrera which ran out of batteries around January 2011, about one month prior to the end of the experiment. Simultaneous surface information was obtained from the AVISO service available at http://www.aviso.oceanobs.com, which provides gridded Sea Surface Height (SSH) fields with a map sampling of 1/8◦ ×1/8◦ . The absolute dynamic topography is obtained as the sum of the sea level anomalies provided, measured by the altimetry satellites and the mean dynamic topography based on seven years of observations (1993-1999) [Rio et al., 2007]. The regional sea level anomalies for the Mediterranean Sea are a multi-mission product with up to 4 satellites at a given time, spanning the period from 1992 to the present. The data provided are corrected to include all standard geophysical corrections, including Dynamic At-. 14.
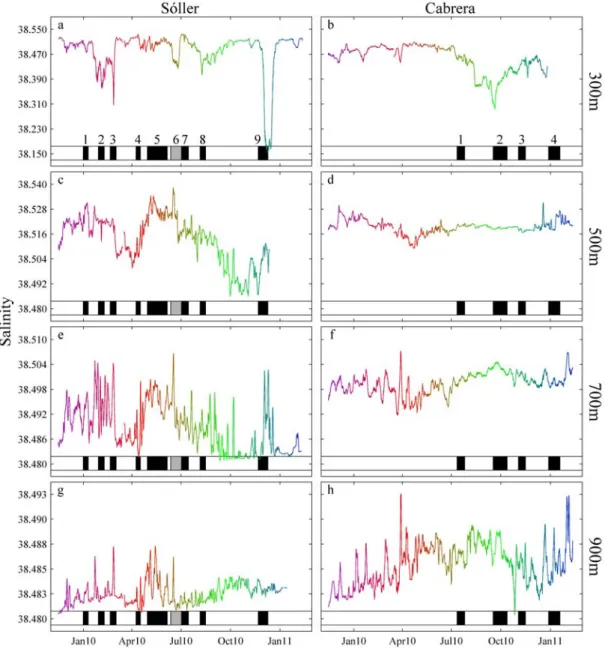
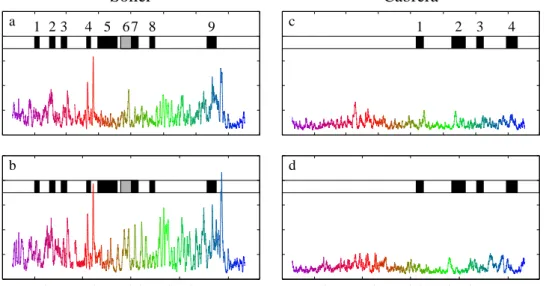
(35) Mesoscale Hydrodynamics and Fishing Resources. mospheric Correction (DAC). This latter correction combines the high frequency of the Mog2D model [Carrère and Lyard , 2003] with the low frequency of the classical inverted barometer correction. The formation and evolution of the eddies in the region of interest have been studied by applying an automated eddy detection scheme [Nencioli et al., 2010]. This scheme is a flow geometry based scheme. The method fixes the center of the eddy as the local velocity minimum into an area with rotating flow, and the eddy boundaries are defined as the outermost closed streamline around the center, for which the velocity continues to still radially increase. In order to improve the algorithm performance of the automatic method of detecting the eddies, the AVISO velocity fields are linearly interpolated from the 1/8◦ ×1/8◦ grid to 1/16◦ ×1/16◦ as performed by Liu et al. [2012]. The number of grid points from a reference one from which the increase in the magnitude of the velocity is checked, has been fixed to 3 (parameter a of the algorithm) and the number of grid points of the area used to find the velocity local minimum has been selected to be 2 (parameter b of the algorithm). The equivalent radius of each eddy located has been calculated as the radius of the circumference with the same area while the circulation is the vorticity integral within the eddy area. The computed spectra have been performed with a half-overlapping KaiserBessel window of 2048 points, the initial number of degrees of freedom being 14. These spectra have also been smoothed, averaging per frequency bands, which permitted an increase in the degrees of freedom towards the high frequencies. Wavelets used Morlet as the mother function.. 1.3. Results. The temperature and salinity time series measured by the moorings during the time of deployment are shown in Figs. 1.2 and 1.3. The first column shows the results from the Sóller mooring, whereas the second column lists the measurements from Cabrera. Each row is assigned to a particular depth in increasing order (300 m, 500 m, 700 m and 900 m). The time series colors denote time, starting with the purple color and moving linearly to blue. This time color scale enables us to identify the time of the relevant features in the TS and PVD diagrams shown later on. This color scheme is followed throughout the manuscript. A visual inspection of the temperature and salinity time series shows greater amplitude oscillations in Sóller. This observation is quantified in Fig. 1.4 where the ratios between the standard deviations of the series measured at the Sóller and Cabrera locations are shown. All the instruments (the only exception being salinity at 900 m) presented standard deviations significantly greater in Sóller. 15.
(36) Ángel M. Amores Maimó. Figure 1.2: Temperature time series after been filtered with a 24h low pass running average filter. The first column shows the measurements from the Sóller mooring and the second column shows the data registered at Cabrera. Each row corresponds to an increasing depth (300 m, 500 m, 700 m and 900 m). Colors indicate the time evolution to facilitate the comparison with other diagrams. Black patches indicate when an eddy was detected. The grey patch in the Sóller time series indicates the presence of two eddies at the same time.. than in Cabrera, with the maximum value at 500 m depth. This result suggests that Sóller is a region with greater variability than Cabrera. Only eddies meeting the selection criteria as detected by the automated scheme. 16.
(37) Mesoscale Hydrodynamics and Fishing Resources. Figure 1.3: Similar to Fig. 1.2 but for the salinity time series.. [Nencioli et al., 2010], are shown in Fig. 1.5. The detection requirements specify that eddies have a lifespan of more than 10 days and their centers remain for at least one whole day in the selected area (ellipsoids in Fig. 1.1), similar to the criteria applied by Amores et al. (2013a). The presence of the eddies is also shown in Figs. 1.2 and 1.3, using black patches in the lower parts of the frames. The eddies are also numbered. The total number of eddies detected is around twice the number in Sóller. 17.
(38) Ángel M. Amores Maimó. Depth (m). 300. 500. 700. T S. 900 0 0.5 1. 2 3 σSóller/σCabrera. 4. Figure 1.4: Ratios between the Sóller and Cabrera standard deviations at different depths. Temperature standard deviation ratios are shown in blue and the salinity standard deviation ratios in red.. (9) than in Cabrera (4) and almost all of them are anticyclonic. The mean of the absolute value of the circulation of the total number of eddies (being the circulation sum of the vorticity inside the eddy area during its entire lifetime) is around 1.5 times greater in Sóller than in Cabrera. The duration of the eddies remains almost the same in both areas (∼ 19 days), although the mean equivalent radius is 5 km greater in Cabrera than in Sóller. Observation of the temperature and salinity time series (Figs. 1.2 and 1.3) recorded when the eddies remained in each area, clearly reveals that the eddies in Sóller generally extend their effects down to the deeper levels than the eddies detected in Cabrera. One example of this fact is the significant drop in the temperature and salinity registered in Sóller at 300m between November and December 2010, coinciding with the last eddy detected in this region (No. 9). This decrease at 300 m changed into an increase of both the variables with depth, down to 900 m, which ensured the stability of the water column (refer Amores et al. [2013] for more details). The same effect, although of smaller magnitude, has also been observed in Sóller, at least during the third and sixth eddies. Conversely, this behavior has never been observed in the Cabrera time series of temperature and salinity, where the eddy effects were not noticeable below 500 m. The TS diagrams for the entire period of study are shown in Fig. 1.6. The Sóller measurements spread out across a wider area than for Cabrera, which again reveals the greater variability present at Sóller. The eddy episodes mentioned above are clearly reflected in Sóller at 300 m. The dark green portion, moving from the Levantine Intermediate Waters (LIW, the resident water at this depth) to the Western Mediterranean Intermediate. 18.
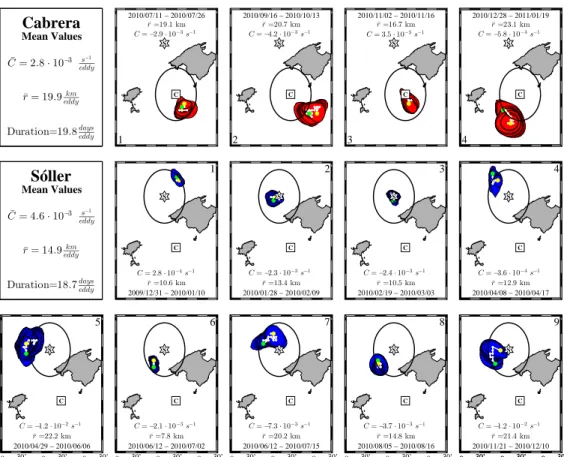
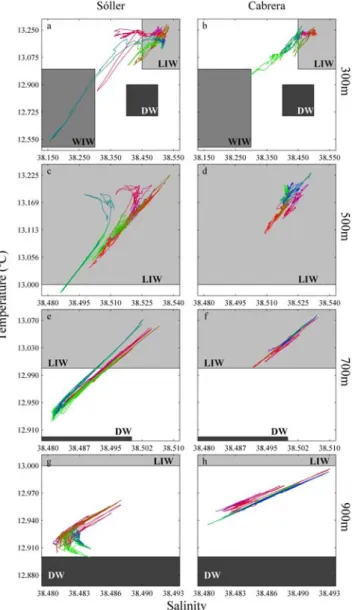
(39) Mesoscale Hydrodynamics and Fishing Resources. 2010/07/11 − 2010/07/26 r̄ =19.1 km C = −2.9 · 10 −3 s−1. Cabrera Mean Values. 2010/09/16 − 2010/10/13 r̄ =20.7 km C = −4.2 · 10 −3 s−1. S. 2010/11/02 − 2010/11/16 r̄ =16.7 km C = 3.5 · 10 −3 s−1. S. 30’. 2010/12/28 − 2011/01/19 r̄ =23.1 km C = −5.8 · 10 −4 s−1. S. 40oN. S. s−1. C̄ = 2.8 · 10−3. eddy. 30’. km r̄ = 19.9 eddy. C. C. C. 39oN. C. 30’. Duration=19.8 days eddy. 1. 2 1. Sóller Mean Values C̄ = 4.6 · 10. 4. 2. S. 38oN. 3. S. 4. S. 30’. C. C. 5. C. C = −2.3 · 10 −3 s−1 r̄ =13.4 km 2010/01/28 − 2010/02/09. C = 2.8 · 10 −4 s−1 r̄ =10.6 km 2009/12/31 − 2010/01/10. Duration=18.7 days eddy 30’. 6. S. C = −2.4 · 10 −3 s−1 r̄ =10.5 km 2010/02/19 − 2010/03/03. 7. S. 39oN. C. C = −3.6 · 10 −4 s−1 r̄ =12.9 km 2010/04/08 − 2010/04/17. 8. S. 38oN. S. 30’. 40oN. S. 30’. 39oN. 38oN o 1E. 30’. 9. 30’. 30’. 30’. 40oN. S. s−1 eddy. −3. km r̄ = 14.9 eddy. 40oN. 3. C. C. C = −1.2 · 10 −2 s−1 r̄ =22.2 km 2010/04/29 − 2010/06/06 30’ 30’ o o. 2E. 3E. 30’ o. 1E. C. C = −2.1 · 10 −3 s−1 r̄ =7.8 km 2010/06/12 − 2010/07/02 30’ 30’ o o. 2E. 3E. 30’ o. 1E. C. C = −7.3 · 10 −3 s−1 r̄ =20.2 km 2010/06/12 − 2010/07/15 30’ 30’ o o. 2E. 3E. 30’ o. 1E. C = −3.7 · 10 −3 s−1 r̄ =14.8 km 2010/08/05 − 2010/08/16 30’ 30’ o o. 2E. 39oN. C. 3E. 30’ o. 1E. C = −1.2 · 10 −2 s−1 r̄ =21.4 km 2010/11/21 − 2010/12/10 30’ 30’ o o. 2E. 3E. 30’ o. 30’38. N. Figure 1.5: The first two panels show the mean features (circulation, radius and duration) of all the eddies detected in each zone. Each following frame shows the features of every individual eddy for Cabrera (in red) and Sóller (in blue) with the same numbering as from Figs. 1.2 and 1.3. The trajectory from the starting point in green to the ending point in yellow is also indicated. The enclosed areas are the zones where the occurrence of eddies has been checked. Note that the sixth and seventh eddies in Sóller were simultaneous for some time but they have been plotted in different frames.. Waters (WIW) correspond to the eddy described in Amores et al. [2013]. The red-pink area, which indicates two different eddies (Nos. 2 and 3), are clearly separated into two parts. The first part, which reveals a change in the salinity, however, maintaining the temperature more or less unchanged, corresponds to the entrance of waters revealing Atlantic features. The second part, when changes in both salinity and temperature are seen, is related to the WIW. Moving downwards in depth, from 500 m to 900 m, the characteristics of the water change gradually from LIW to Deep Waters (DW), a normal response for the resident waters of this area [Balbı́n et al., 2012; Pinot et al., 2002]. On the other hand, the Cabrera 300 m TS diagram reveals that the characteristics of the waters in this region were confined to a smaller area (when compared. 19.
(40) Ángel M. Amores Maimó. Figure 1.6: Temperature Salinity (TS) diagrams. Data have been smoothed by using a 24h low pass running average filter. The colors are the same than those used in Figs. 1.2 and 1.3 and they indicate the time evolution.. with Sóller). Water properties deviated from the normal LIW (the resident water) to WIW only in the green portion, which corresponds to the presence of some eddies in this region. When moving to the deeper levels, a slight displacement from LIW to DW is observed. However, the water properties do not get as close to DW as they do for the Sóller region. A comparison of the Progressive Vector Diagrams (PVD) and the speed for each depth in which a current meter was deployed (500 m and 900 m) is presented. 20.
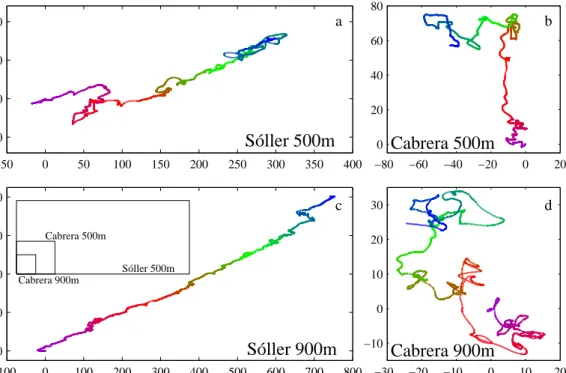
(41) Mesoscale Hydrodynamics and Fishing Resources. 80. a. 100. b 60. 50 40 0 20. Distance (km). −50 −50. Sóller 500m 0. 50. 100. 150. 200. 250. 300. 400 300 200. 0. 350. 400. c. −60. −40. −20. 0. Cabrera 500m. 20. d. 30 20. Sóller 500m. 10. Cabrera 900m. 0. 100. −10. Sóller 900m. 0 −100. Cabrera 500m. −80. 0. 100. 200. 300. 400. 500. 600. 700. 800. Cabrera 900m. −30. −20. −10. 0. 10. 20. Distance (km) Figure 1.7: Progressive Vector Diagrams (PVD) for the current meters of both moorings. Data have been smoothed by using a 24h low pass running average filter. The scale relationship between the PVD scales is visible inside the Sóller 900 m PVD. The colors are the same than those used in Figs. 1.2 and 1.3 and indicate the time evolution.. in Figs. 1.7 and 1.8, respectively. The current mean values are greater at Sóller (3.9 cm/s at 500 m and 5.2 cm/s at 900 m) than they are at Cabrera (2.3 cm/s at 500 m and 2.2 cm/s at 900 m). Significantly greater speeds have been recorded at 900 m than at 500 m in the Sóller region. Otherwise, at Cabrera, the speeds are observed to be similar at both depths. Greater speeds in the water column have been previously observed close to the bottom [Millot, 1994] although the exact reason for this phenomenon still remains unclear [Pinot et al., 2002]. A possible explanation for these measurements could be attributed to the fact that the Sóller mooring has been deployed along a very steep slope, whereas the Cabrera mooring is located in a relatively flat area (Fig. 1.1). The placement of the Sóller mooring, the steep slope, and the fact that the Balearic Current flows in from the Northern Current, after experiencing a significant gyre just before the Ibiza Channel, could explain the greater velocities measured near the bottom. The PVDs at Sóller (Figs. 1.7a and c) clearly reflect the steady Balearic Current, flowing northeast along the islands slope. The dominant current is. 21.
(42) Ángel M. Amores Maimó. Sóller 0.25. a. 0.20. 1 23. Cabrera. 4 5 67 8. c. 9. 1. 2 3. 4 500m. 0.15. Speed (m/s). 0.10 0.05 0 0.25. b. d. 0.20. 900m. 0.15 0.10 0.05 0. Jan10. Apr10. Jul10. Oct10. Jan11. Jan10. Apr10. Jul10. Oct10. Jan11. Figure 1.8: Speed time series for the current meters of both moorings (panel a and c are from 500m depth and b and d are from 900m depth). Data have been smoothed by using a 24h low pass running average filter. The colors are the same as those used in Figs. 1.2 and 1.3 and indicate the time evolution. Black patches reveal when an eddy is detected. The grey patch in the Sóller time series indicates the presence of two eddies at the same time.. only disturbed by the presence of successive eddies which trigger a change in the direction of the current (Fig. 1.7) as well as an increase in the speed values in almost all the cases (Fig. 1.8). These gyres, associated with the eddies, are stronger at 500 m but still noticeable at 900 m, at least for the third and ninth eddies. It should be stated that the dimensions of the Sóller PVD frame at 900 m are twice the size of the 500 m frame. This fact, which implies larger displacements at 900 m than at 500 m, takes into account two different effects: first, the direction of the current is more constant at 900 m than at 500 m; and second, the speed at 900 m is also generally greater than at 500 m. The same results are also observed in Fig. 1.8. The PVDs from Cabrera, however, do not show a clear dominant direction for the currents, which is an intrinsic feature of the deployment area, due to the significant effect of the mesoscale events in this region on the distribution of the currents [Pinot et al., 2002]. Only a dominant northwards current is observed at 500 m during the initial period. Also, neither the PVDs (Fig. 1.7) nor the speed time series (Fig. 1.8) present a clear signal of the eddies observed in this region on the surface data. Conversely to Sóller, the PVD frame from 500 m is double the size of the 900 m PVD frame, although in this case it is due only to the previously mentioned dominant northwards direction of the current during the. 22.
(43) Mesoscale Hydrodynamics and Fishing Resources. Sóller. 5. Cabrera 500m. 500m. 7 6. 4 5 3. 4 3. 2. 1 0. 0. 5. 900m. 900m. 7 6. 4. Speed (cm/s). Frequency (%). 2 1. 5 3. 4 3. 2. 2 1 1 0 0º. 45º. 90º. 135º. 180º. 225º. 270º. 315º. 360º 0º. 45º. 90º. 0 135º 180º 225º 270º 315º 360º. Direction. Figure 1.9: The number of times that a direction was measured (black histogram) and the corresponding mean speed for this orientation (red line) for each location and depth.. first part of the measurements, as the speeds show similar values at both depths. Finally, a comparison between the Sóller and Cabrera PVDs frames sizes reveals, once more, that the current speeds are significantly greater in Sóller, and also that a more constant current direction is present, which is related to the steady Balearic Current. The differences between the current distributions in both zones become even clearer on analyzing the number of times a given direction is measured and the mean speed for this orientation (Fig. 1.9). In Sóller, there is a predominant direction, around 70◦ (taking the zero at the north and increasing clockwise) at both the 500 m and 900 m depths. This direction coincides with the orientation of the slope of the island and, consequently, with the path of the Balearic Current. This predominant direction shows a higher frequency at 900 m than at 500 m, which indicates a greater variability in the upper layers. Moreover, there is a second maximum in the opposite direction (250◦ -260◦ ) which takes into account the re-. 23.
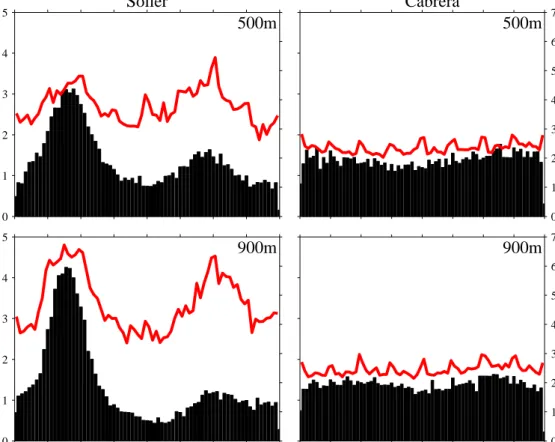
(44) Ángel M. Amores Maimó. versal of the currents during the eddy events. Regarding the velocity distribution, the same two maximums have been observed for the very same orientations, with almost the same mean speed values (between 5-6 cm/s at 500 m and 6-7 cm/s at 900 m). The distribution of the speeds and directions is totally different at Cabrera. There is no predominant direction and the mean speed is almost the same in all directions. Values are also similar at both depths (between 2 and 3 cm/s).. Figure 1.10: Velocity wavelets from Sóller at 500 m (a) and 900 m (c) and for Cabrera at 500 m (b) and 900 m (d) during the entire recording period. The vertical strips correspond to the mooring maintenances. The mother function used in wavelet computations is Morlet.. Figure 1.11: Pressure wavelets from Sóller at 300 m (a) and 900 m (c) and for Cabrera at 300 m (b) and 900 m (d) during the entire recording period. The vertical strips correspond to the mooring maintenances. The mother function used in wavelet computations is Morlet.. The frequency variability has been studied through wavelets and spectral analysis. Wavelets for the velocity modulus and the whole set of available data are shown in Fig. 1.10. The inertial frequency (f ∼ 0.0534h−1 ∼ 18.74 h) is the more energetic component during the whole period, being always more energetic in Sóller than in Cabrera. Moreover, sudden energy spurts are observed in Sóller. 24.
(45) Mesoscale Hydrodynamics and Fishing Resources. Figure 1.12: Pressure spectra for Sóller, at all available depths, for a period when an eddy was present in the area exerting a significant influence on the mooring (a) (from 18/11/2009 to 14/3/2010) and when no eddy was observed in the zone (b) (from 1/4/2010 to 26/7/2010). The main tide components are indicated in grey; the peaks with a possible resonant origin are indicated in red; the peaks related with the inertial frequency are indicated in green.. wavelets during the time when most of the eddies have been detected. At these times, the energy appears to spread outwards affecting the lower frequencies, these frequencies being related to the characteristics of the eddies. These energy spurts in the speed wavelets are also reflected in the pressure wavelets (Fig. 1.10). A clear energetic increase at the inertial frequency is observed during the most energetic eddies (third and ninth). These energy increases are related to the depressions of the instruments due to the tilting of the mooring associated with the strong currents. This effect can be better visualized by performing a spectral analysis of two different periods of time: the first period (from November 18, 2009 to March 14, 2010) includes the presence of two intense eddies in Sóller (eddies 2 and 3) (Fig. 1.12a); meanwhile, the second period (from April 1 to July 26, 2010), does not show any particular feature, either in Sóller or Cabrera (Fig. 1.12b). Thus, to correctly interpret the pressure spectra in Sóller, it must be assumed that the currents associated with the eddies is strong. 25.
Figure


+7
Documento similar
Astrometric and photometric star cata- logues derived from the ESA HIPPARCOS Space Astrometry Mission.
In the previous sections we have shown how astronomical alignments and solar hierophanies – with a common interest in the solstices − were substantiated in the
Díaz Soto has raised the point about banning religious garb in the ―public space.‖ He states, ―for example, in most Spanish public Universities, there is a Catholic chapel
teriza por dos factores, que vienen a determinar la especial responsabilidad que incumbe al Tribunal de Justicia en esta materia: de un lado, la inexistencia, en el
MD simulations in this and previous work has allowed us to propose a relation between the nature of the interactions at the interface and the observed properties of nanofluids:
Government policy varies between nations and this guidance sets out the need for balanced decision-making about ways of working, and the ongoing safety considerations
No obstante, como esta enfermedad afecta a cada persona de manera diferente, no todas las opciones de cuidado y tratamiento pueden ser apropiadas para cada individuo.. La forma
The Dwellers in the Garden of Allah 109... The Dwellers in the Garden of Allah
