ISSN: 2254-7088
The effect of subsidising firms on voting
behaviour: Evidence from Flemish elections
Caroline Buts, Vrije Universiteit Brussel, Belgium* Marc Jegers, Vrije Universiteit Brussel, Belgium Dimi Jottier, Vrije Universiteit Brussel, Belgium
Abstract
Despite an international consensus on the importance to limit State aid spending, large amounts of resources are still devoted to a wide variety of subsidies to firms. A sizable literature studies the relationship between general government spending and the proximity of elections, mostly documenting a positive link. In addition, other studies verify whether this strategy of increasing government expenditure pays off in terms of number of votes. We focus on one type of government spending that can be quite vulnerable to becoming ‘targeted spending’, i.e. subsidies to firms. We empirically test the relationship between the amount of subsidies granted to firms at the local level and local support for incumbent parties in the regional government. To that end, we make use of subsidy data derived from financial statements on 2008 and Flemish election results of 2004 and 2009. We find that the total amount of subsidies as well as subsidies per capita granted in 2008 positively correlate to support for incumbent parties 2009, meaning that voters appear to reward subsidy granting politicians.
JEL Classification
H25; D72; L50
Keywords
subsidies; voting behaviour; industrial policy
* Address for correspondence: Caroline Buts, Vrije Universiteit Brussel, Department of Applied Economics, Pleinlaan 2, BE-1050 Brussel, Belgium. E-mail: [email protected].
Introduction
Governments spend a substantial amount of resources, allocating subsidies to private firms, seemingly in order to correct market failures or to support specific regions or sectors. However, there also seems to be a consensus that (taking into account a few exceptions) State aid should be forbidden as it can lead to costly subsidy races between countries and in the long run can create inefficient companies (Hancher et al. 2006). Furthermore, in practice, we see that these subsidies are often ineffective or inefficient in a sense that goals are not (fully) reached or that the benefits achieved do not justify the costs incurred.
Therefore, it is argued that mechanisms should be implemented to control or restrict wasteful spending on subsidies. Dewatripont and Seabright (2006) suggest that domestic political control mechanisms are not the best option. In theory, political accountability works as follows: citizens vote as a function of their evaluation of government performance. Incumbent parties are electorally punished for a ‘bad’ performance, and a ‘good’ performance is rewarded with additional support in the ballot box. In doing so, incentives are created for politicians to implement a policy perceived to be ‘good’ in order to remain in office. As already mentioned, subsidies are not the most efficient way to allocate government’s resources, but are perceived by voters as “evidence of effort on the part of the politicians” (Dewatripont and Seabright, 2006, p. 514). If voters reward this effort with additional votes, the political control mechanism creates a perverse effect: it then becomes rational for politicians to spend money on wasteful subsidies as this would “improve their chances of re-election” (Dewatripont and Seabright, 2006, p. 514).
The aim of this paper is to empirically test whether subsidies indeed are related to electoral outcome, a relationship which, to the best of our knowledge, has not yet been directly tested. It serves as a further specification of the broader literature on pork-barrel politics that studies politicians who direct spending in order to win additional votes. Subsidies are chosen as they are probably more sensitive to become ‘targeted’ spending projects than many other types of government spending. The relationship is tested at the local level. The economic voting literature shows that electoral support for national governments is greater in local jurisdictions where economic prosperity is higher (Pattie et al., 1997; Johnston et al., 2000, 2002). Hence, if subsidies have an electoral effect, the support for governments should be higher in local jurisdictions where the amount of allocated subsidies is higher. We compare the 2009 electoral results of the incumbent parties of the Flemish government between the different electoral cantons and hypothesize that a high amount of subsidies allocated to a specific region increases local electoral support for the incumbent parties.
The remainder of this paper is organized as follows: in section 1 the ineffectiveness of many state aid measures is discussed as well as the obvious international desire to diminish or even abolish this kind of spending. Furthermore, we look at literature on the determinants of election outcome and the importance of a local context. The last part of this section reviews the literature on pork-barrel politics and thus discusses the relationship between the level of government spending and upcoming elections as well as the influence of this spending on vote shares of incumbent parties. The second section specifies our model and describes the data. The results of the empirical analysis are presented in section 3. A conclusion and discussion can be found in section 4.
Literature
Frequently, goals are not reached, or when they are, the costs are out of proportion. Examples of this are the crowding out effect of R&D subsidies1, the ineffectiveness of many rescue and restructuring measures2 and the hugely costly
aid to boost employment.3 Next to this wide evidence of inefficiencies, an international consensus seems to exist among politicians and organizations about the desire to diminish State aid measures. This becomes evident in the European Union’s State aid policy and the World Trade Organization’s Agreement on Subsidies and Countervailing Measures. From a theoretical point of view, Collie (2000 and 2002) makes a well-reasoned plea for a serious reduction of State aid over time in the EU, based on welfare grounds.
We then may ask why governments keep spending resources to the current extent in this often inefficient way. While searching for explanations, we find several possibilities. A first one is provided by Baldwin and Robert-Nicoud (2007). Governments support inefficient firms simply because these firms have a strong lobby. In a way, the process of integration in the European Union stimulates this demand for government support. Integration increases market performance but, at the same time, higher competition threatens to force non-efficient firms out of the market. These firms will then ask for aid from their national governments. Furthermore, penalties for acting against EU State aid rules are not always severe enough, possibly leading to situations in which, despite welfare being reduced, granting aid is an equilibrium outcome (Martin and Valbonesi 2008). Another explanation is offered by Dewatripont and Seabright (2006) and represents the theoretical foundation for our empirical analysis: subsidies are seen by voters as an effort of politicians. Voters will reward politicians for this effort in the ballot box. In their turn, politicians are aware of this and grant subsidies to show their commitment and thereby gain support for future elections. Normally, the mechanism of domestic political accountability would control politicians, but in this case it does not and it even provides an incentive for wasteful spending.
Political accountability builds on the ‘carrot and stick’ model: a good performance (as perceived by voters) leads to electoral gain for incumbent parties, contrary to a bad performance. This hypothesis has been intensively investigated in the economic voting literature. From this literature, we conclude that economic prosperity – generally measured by variables such as unemployment rate, inflation and economic growth - has positive effects on electoral results for incumbent parties (for a review see Mueller, 2003 and Nannenstad and Paldam, 1994). As wasteful spending is shown to be a sign of rather bad governance, we would expect the accountability mechanism to punish politicians for this. However, here the mechanism works in the opposite way. Subsidies are not evaluated as being wasteful but as an effort of politicians which generates extra votes. This encourages politicians to continue subsidising.
Economic prosperity as measured in the voting literature can be perceived at different levels. Voters can assess the performance of the national economy (voting socio-tropically) and they can look at the prosperity of their own household (voting ego-tropically). Research has shown that both levels are important although voters seem to be more socio-tropic than ego-tropic (Lewis-Beck and Paldam, 2000).
Furthermore, it has been suggested that the local context wherein these evaluations are made also plays an important role (Books and Prysby, 1999).
1 For a review on the econometric literature on crowding out of R&D subsidies, see David et al. (2000). In addition, Lach (2002) and Gelabert et al. (2009) find that these kinds of subsidies are only effective when granted to small firms or firms with low levels of appropriability.
2 London Economics (2004), Chindooroy (2007) and Glowicka (2008).
Through the local media, social interaction and personal experiences, voters in states with low economic prosperity would be more confronted with negative information, which affects their assessment of the government’s economic performance.
Not only assessments but also voting behaviour is affected by the local context. Controlling for national and personal assessment, Pattie et al. (1997) find that, for the 1992 UK elections, voters who thought that their region was worse off were less likely to vote Conservative (the incumbent party at that time) and more likely to vote Labour (the main opposition party). Their results are confirmed by Johnston et al. (2000, 2002) who find that, controlling for national, personal and regional assessments, economic prosperity in a region (measured by the unemployment rate) increased support for incumbent parties in that specific region. However, Berry and Howell (2007) state that evidence of retrospective voting in national elections seems to be steadier than in local settings. From Duch and Stevenson (2006) we learn that economic voting is not found to influence all elections, but a clear reason for this has not yet been found. They find varying evidence for economic voting depending on national context and time.
The accountability mechanism has also been tested with a wider range of variables. Hagerty (2006) adds measures for the quality of life to this ‘responsibility hypothesis’ and finds that crime rates are important in predicting election outcome. However, the influence of crime rates tends to be smaller than that of the economic condition.
Finally, the relationship between government spending and vote shares has been discussed in the literature. There is evidence suggesting that governments indeed seem to believe that subsidies positively impact on voting behaviour. In addition, it has been discussed whether this kind of spending to win additional votes actually pays off. The phenomenon is referred to as pork-barrel politics.
Verdier (1995) explains that politicians grant subsidies in order to create a (stable) network of supporters. Kwon (2005) documents the fact that the level of government expenditure in South Korea depends on the proximity of future elections. Also, it is known that in developing countries, white elephants (funded projects with a negative social surplus) are used in an attempt to influence election outcome. Robinson and Torvik (2005) show that certain politicians are able to derive very large political benefits from this kind of projects.
Keeping the above findings in mind, Keefer and Knack (2007) make an interesting addition. They find that public investment is higher in regimes with little political checks. However, they do say that further research is necessary to determine the cause: is it to compensate for incompetence of the regime or is the money spent on ‘preferential’ projects? Also Manzetti and Wilson (2007) state that nations with weaker democratic regimes are more likely to have a high amount of targeted spending to win votes.
Alvarez and Saving (1997), Levitt and Snyder (1997) and Leigh (2008) find that high spending results in more votes. The second team finds that it takes about $14 000 in federal funding to win an additional vote. The last author distinguishes between types of spending and finds the strongest relationship between funding and additional votes in the Roads to Recovery Program, about the same amount that was found by Levitt and Snyder (1997).
Specification and data
In the literature review, we find evidence that State aid is often ineffective and that it is accepted that it should mostly be forbidden. Nevertheless, huge amounts of State aid are spent each year by national governments. For example, in 2010 the EU-27 spent 0.6% of aggregated GDP on State aid.4 This, together with the
evidence from the literature on pork-barrelling, leads us to believe that in many cases there could be political motives to government spending. In this research we want to look at one specific form of spending, namely subsidies to firms as we believe that they could be especially sensitive to becoming ‘targeted’ spending in order to win votes. In a way, it boils down to the fact that politicians grant subsidies even though overall believe is that these subsidies should only be allowed in exceptional circumstances. Therefore, keeping in mind that a link exists between subsidies and electoral competition, we think that a realistic explanation is presented by Dewatripont and Seabright (2006): politicians grant subsidies to show their commitment and in this way try to gain more support in next elections. In this theory subsidies are perceived by voters as an effort of politicians, signalling a caring government. This is rewarded with electoral support in next elections. The voting decisions are made on a point in time when voters are aware of the subsidy, but not of its effect, which in most cases can only be evaluated after a few years. In the present paper we want to empirically investigate whether subsidies indeed affect voting behaviour and hypothesize that differences in electoral support for incumbent parties between the different regions can partly be explained by differences in the amount of subsidies granted to firms located in these different regions.
We thus start from the theoretical model presented by Dewatripont and Seabright (2006) as we believe that voters reward politicians for their effort. Subsidies to firms are used to test this as they are a form of spending likely to be used for pork-barrel politics. People working in the aid receiving firms are aware of the fact that subsidies were granted to these firms. This may not always be true, but it will be in the majority of cases. Some types of subsidies are namely more likely to be communicated towards the employees than others. For example, aid for R&D or rescue and restructuring aid will usually be known in the entire firm, whereas several smaller subsidies may be not. The employees of the receiving firm are likely to inform family and close friends and thus in this way make sure the information spreads. The more firms receive subsidies, the more inhabitants of a certain area are aware of the ‘caring’ incumbent politicians. Also, as pointed out in the literature review, pork-barrelling is observed more in smaller states as described by Hauk and Wacziarg (2007). Indeed, the effect of pork-barrelling will logically be larger were local communities are small and social interaction is often quite high. Where there are many contacts with the neighbourhood and within recreational organizations, information will spread more easily. Moreover, press in Flanders is very local and helps spreading these facts by reporting all kinds of local news, including economic news that is locally relevant.
For the empirical analysis, we use election data of the Flemish region for 2004 and 2009. Flanders represents a typical example of a Western democracy, with a proportional multiparty system, located within the European Union. It provides for a
good test case as data on subsidies can be calculated per firm (see below). Flanders is one of the three Belgian regions besides Wallonia and the (smaller) Brussels region. The Belgian regions have considerable autonomy. Their major competences are in the field of economic policy and education. Every five years, elections are held to choose representatives for the Flemish parliament. Within this parliament, a majority forms the government. After the 2004 elections, the government was formed out of three cartels: CD&V-N-VA (cartel of the Christian democrats and a nationalist party), VLD-Vivant (a liberal cartel) and Sp.a-Spirit (a left wing cartel). The next elections for the Flemish government in 2009 resulted in a new coalition of CD&V, Sp.a and N-VA.5
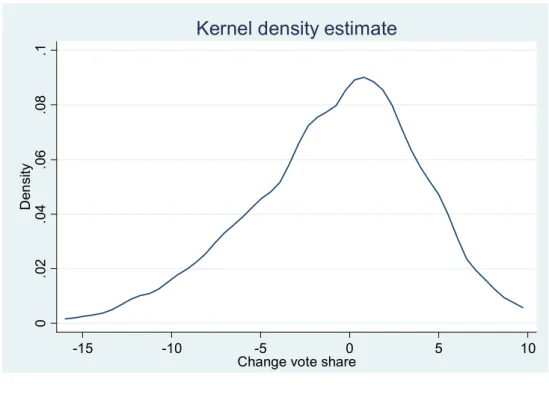
Flanders (13 682 km²) is divided into five electoral districts. Each of these districts consists of several cantons (103 in total). In 2009 there lived, on average, 59 821 people in a canton with a minimum of 3 672 and a maximum of 490 492.6 To analyze the impact of subsidies, we study the electoral results of parties that made up the government between 2004 and 2009. These results differ substantially between cantons as can be seen in Figure 1. Vote share changes are calculated for every canton. On average, incumbent parties lost 1 percentage point of their electoral support. However, in one canton they lost 14 percentage points of their vote shares, whereas they also won 8 in another.
Figure 1: Kernel density plot of vote change of incumbent parties (per canton)
0
.0
2
.0
4
.0
6
.0
8
.1
De
n
si
ty
-15 -10 -5 0 5 10
Change vote share
Kernel density estimate
5 Cartel partners CD&V and N-VA decided to go separately to the 2009 elections. The two other cartels making up the Flemish government after 2004, chose a new name for the 2009 elections.
6 The difference in size of the cantons implies that the perception of localness differs for voters within different cantons. A small canton is much more ‘local’ than a larger canton. Johnston et al. (2000), however, demonstrate that the response of voters to local unemployment levels is scale invariant. Whether unemployment was measured at a very small scale (around 500 people) or at the constituency scale (around 70 000 people on average) it still had a negative effect on the electoral support of incumbent parties. We see that including a dummy variable for cantons containing a big city does not impact on our results (see below). All in all, all cantons can be labeled ‘small’ compared to the small units of observations found in the literature.
Empirical model
We hypothesize that these differences in electoral results between cantons can be (partly) explained by differences in subsidies granted to firms located in these cantons. We expect that in cantons where private firms received more subsidies, the electoral support for incumbent parties will be higher than in other cantons. This leads to the following function, estimated at the canton level:
Votes2009 = α + β1 Votes2004 + β2 Subsidy + β3 X + ε
Where Votes2009 stands for the vote share of all the incumbent parties at the 2009 elections, Votes2004 is the vote share of these parties at the 2004 elections. Subsidy is the amount of subsidies or in a second step the subsidies per capita granted to firms in the canton in 2008. X is a set of socio-economic parameters ranking all cantons. In a second step we also look at relative change in vote share. Subsidies. We will focus on all subsidies to firms in Flanders, excluding other measures such as loans or guarantees. In Belgium, subsidies are granted by several levels of government and through different organizations under their supervision. The subsidies are linked to the elections of the regional governments, which grant the bulk of the subsidies. A small proportion of the subsidies is provided by the federal government (also directly going to the firms). However, from Limosani and Navarra (2001) we learn that voters can reward politicians for spending that occurs at a different level of government. We assume that voters do not really differentiate between resources coming from different levels of government. Through personal experience, their social network or local press, they are informed about the subsidies and relate this to the politicians that are in office. Most of the subsidy granting organizations are not willing to provide detailed information on this topic, the amount of subsidies they award and to whom, except for IWT (Agency for Innovation by Science and Technology). Therefore, we estimated the subsidies per firm (and subsequently calculated subsidies per canton) from the firms’ annual accounts.7 We include two tests, one with the absolute level of subsidies for which the variable is scaled by a factor 100 000 and one with subsidies per capita.
The method of calculation of subsidies leads to an inclusion of all capital grants to firms conditionally upon being subsequently invested by the firm. It concerns subsidies provided by all levels of government for a variety of objectives such as research and development, start-up aid and sustainable development. Subsidies granted as a result of aid schemes8 as well as ad hoc types are included. The purpose is to investigate the joint influence of all these subsidies to firms.
Flemish firms received subsidies for a total amount of €829 million in 2008. This represents on average a subsidy of €80 per capita. However, there are quite some differences between the cantons. In one canton, we find no subsidies at all. In another canton, subsidies amount to €2 622 per capita. In our analysis we include only subsidies and subsidies per capita of 2008 instead of total subsidies over the four years between the two elections because, as was mentioned in the literature review, it has been shown that governments seem to increase their spending, including subsidies, in the year prior to elections. Additionally, voters can be assumed to have short memories, rather recalling last years’ subsidies than last five year period’s subsidies. We expect that subsidies will positively impact on incumbent support following the mechanism explained above.
7 The method of calculation of subsidies can be found in Appendix 1.
Socio-economic condition. We control for the socio-economic condition in a canton. As suggested in the literature, the economic condition and quality of life in a specific region influences the evaluation of government performance made by voters in that region. To control for these effects we use a socio-economic canton rank as proposed by Sanderson and Eggerickx (2010). A low value for the index represents a high ranking and thus a ‘better’ canton. This index is an overall performance indicator and includes a canton’s scores for different parameters, measuring the general well-being of inhabitants. To control for economic performance, income per capita and the unemployment level are taken into account. To have a broader picture, also measures of more general well-being are included such as quality of life, living environment and the availability of public services. These aim to quantify certain topics that are important in the daily life in local communities. The first two are based on quantifiable dimensions such as the quality of houses (measured amongst others by the number of bathrooms), built surface, proximity and surface of green and wooded areas, health, life expectancy and environmental concerns such as local emission rates. Availability of public services will typically measure the accessibility of several kinds of services such as public schools, administrative services, public nursing homes, public health care institutions, doctors, and public transport. Here, it is the proximity and quantity that is measured, as well as the availability of public buses. Each time, the partial scores are added and cantons are ranked according to the total score. We expect better socio-economic conditions to result in better electoral results for incumbent parties.
Results
By means of a classical OLS regression, we explain the number of votes that incumbent parties of the 2004-2009 period receive at the Flemish elections of 2009.
Regression results can be found in Tables 1 and 2.9 In Table 1 we look at the
absolute value of subsidies as one of the independent variables. Table 2 shows results when we change to subsidies per capita. The second column of each table explains the joint vote share of all incumbent parties. In column three the relative change in vote share each time is the dependent variable.10
First, it is clear that there is a very strong and positive link between the election outcome of 2004 and results of 2009. Incumbents of the 2004-2009 period are more likely to have many votes in a canton at the 2009 elections when they had a high vote share at previous elections, despite some ‘regression’ in the sense that high shares in 2004 tend to be followed by a loss of votes.
Next, we take a look at subsidies and subsidies per capita going to firms. Throughout the four estimations, we find that there is a significant positive relationship between subsidies and the vote share in 2009, meaning that cantons that receive high subsidies the year previous to the elections reward incumbent
9 Including a dummy variable for cantons containing one of the five province capitals does not alter results significantly. One could argue that this kind of variable should be included as it is not unusual for firms to have their headquarters in a larger city, but their main activity somewhere else. Also, cities typically host more workers living somewhere else. Subsidies might enter the calculations of the bigger cantons, but employees are from another region. Including a dummy variable for ‘undecided’ cantons, i.e. cantons where the largest party changed between the 1999 and 2004 elections or cantons were vote share for incumbents and opposition was close, does not alter the results.We also estimated our regressions applying robust regression techniques. The results do hardly differ from the ones presented (results can be obtained from the authors upon request). Including a variable to control for size of the cantons does not change the results. The size variable does not reach significance. An overview of all variables included and their sources can be found in Appendix 2.
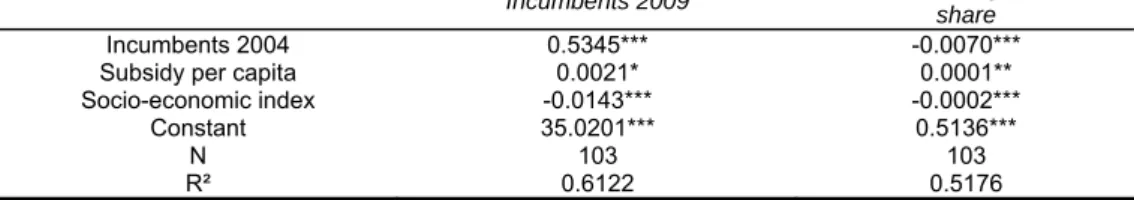
parties with more votes than cantons that receive less subsidies. An increase of €1 subsidy per capita, increases vote share for incumbent parties with 0.0021 percentage points (Table 2). €80 subsidy per capita is granted on average. For the canton with the highest subsidies, this represents a change in vote share of 6 percentage points, which is substantial given the number of parties participating at the elections. The found effect confirms expectations. The subsidies taken into account are the ones going to firms. These matter because they are observed by the voter public in the following way: many people work close to home or at least have many relatives and/or friends working in that region. If more subsidies are awarded to firms in a specific canton, we can expect that they are ‘experienced’ by more voters as more employees will be aware of the subsidies. Voters are informed by personal experience, but can also learn about the subsidies through their social network or local press. Then, we continue with the reasoning by Dewatripont and Seabright (2006) that voters indeed reward politicians for subsidies. The subsidies are perceived as a kind of effort of politicians. The economic impact of the spending decision can often only be evaluated after the elections. Therefore, voting support is given on the basis of the spending decision itself and not on the actual effectiveness of the subsidy which can only be observed at a later moment in time and is then implicitly incorporated in the variable measuring general well-being.11
Third, following the literature, we control for the socio-economic condition of the cantons. We expect that a good economic condition and quality of life would be rewarded with more votes. This is confirmed by the results for the variable measuring the socio-economic condition. The sign observed is negative, remembering that the variable is an ordinal variable, with higher values pointing at worse socio-economic conditions. Cantons were inhabitants have a high feeling of general well-being, measured as economic condition, but as well as quality of life and availability of public services, award more votes to incumbent parties.12 Table 1: Results with subsidies as an absolute variable
Incumbents 2009 Relative change in vote
share
Incumbents 2004 0.5520*** -0.0067***
Subsidies 0.0024** 0.000041**
Socio-economic index -0.0153*** -0.0002***
Constant 33.9927*** 0.4974***
N 103 103
R² 0.6223 0.5308
*** significant at 1% level; ** significant at 5% level; * significant at 10% level
11 This paper focuses on a type of spending that is likely to be sensitive to becoming ‘targeted’ spending. Building on existing literature, it could be interesting to look at the effect of more general types of public spending. This however falls outside the scope of this paper.
Following the method proposed by Petrarca and Padovano (2011), we also test whether there is an influence of the level of subsidies in neighbouring cantons. We calculate per canton the level of subsidies relative to the subsidies received in neighbouring cantons. This however does not seem to have an effect.
Table 2: Results with subsidies per capita
Incumbents 2009 Relative change in vote share
Incumbents 2004 0.5345*** -0.0070***
Subsidy per capita 0.0021* 0.0001**
Socio-economic index -0.0143*** -0.0002***
Constant 35.0201*** 0.5136***
N 103 103
R² 0.6122 0.5176
*** significant at 1% level; ** significant at 5% level; * significant at 10% level
Most usual regression diagnostics do not raise concerns. When checking multicollinearity, we find no variance inflation factors that exceed 2. As the normally used threshold is 10, we conclude that there are no concerns with regard to multicollinearity. The augmented partial residual plots do not raise concerns about non-linearity. When plotting residuals versus fitted values, we see that the data cloud becomes somewhat thinner towards the ending which might raise concerns about heteroskedasticity. These are however only minor as there is no real pattern to be found in the plot.
However, subsidy per capita has a few outliers. In order to check whether these influence the results, we run regressions with and without them and find no significant differences. Robust regression was also used, which provided similar results (see also footnote 9).
Finally, one might be critical about the assumed direction of causality between subsidies and election outcome. Instead of higher subsidies leading to better election outcome, one could argue that more subsidies are awarded to regions where incumbent support was rather low in the past. Theoretically, this cannot be a problem in the present case as election results of 2009 are explained by subsidies of 2008. Nonetheless, we check endogeneity by means of a Durbin-Wu-Hausman test (as one could say that subsidies are dependent on previous election results and that these are highly correlated to future election outcome), but conclude that there are no problems of that kind. In addition and perhaps most convincingly, when the opposite direction is tested, we find no evidence of a correlation between subsidies and 2004 vote share. Considering these diagnostics, results can be confidently interpreted.
Conclusion and discussion
We study the impact of subsidies to firms on election outcome in Flanders (Belgium). To that end, we look at the election outcome for the incumbent parties at the Flemish level in the 2009 elections for all 103 cantons. We find a significant positive relationship between the amount of subsidies and subsidies per capita granted to a canton’s firms and the vote share of the incumbent parties, meaning that voters seem to reward politicians for spending resources on subsidies.
The motive for this paper is to uncover a possible explanation for granting subsidies. Apart from the overall consensus that State aid should be forbidden, literature provides evidence that many of the subsidies that are still in place for a variety of reasons are not efficient. The question then remains why governments keep on investing such large amounts of resources in different kinds of subsidies. Following the theoretical work of Dewatripont and Seabright (2006) who explain that subsidies are a by-product of political accountability, we show empirically that voters seem to reward politicians for subsidies as higher amounts of subsidies result in more support for the incumbent parties. We do however not judge the effectiveness of the subsidies.
elections than on the local level, as is explained by Berry and Howell (2007). The present study shows that there can be retrospective voting at the local level. We add the possibility that the accountability mechanism can create undesired effects as well when voters make a ‘wrong’ assessment on a government decision under the limited information that they observe as will often be the case with regard to subsidies. The literature on pork-barrelling is specified further as we distinguish one specific type of spending, namely subsidies to firms. Even in stable democracies and multi-member electorates, both usually less sensitive to pork-barrel spending, awarding subsidies can improve the incumbent’s chances of re-election. However, this is not always confirmed in existing literature. So, specific conditions can be defined further for this kind of spending to work. Probably, the small size of the cantons and the organization thereof is an important factor. Having relatively dense social networks and a truly local press, for example, helps politicians to spread information among the voter public. This makes it easier to bring the message across that resources were spent, and therefore, as Dewatripont and Seabright (2006) pointed out in their theoretical model, that incumbents ‘care’, resulting in extra support during upcoming elections.
For future research it would be interesting to look at this type of effect in other countries and especially to verify whether the ideology of the standing government matters for the effect of subsidies on voting outcome.
Two remarks still need to be made: as we studied Flemish election outcomes, one could argue that only Flemish subsidies should have been taken into account. However, we included all subsidies received by firms. This is justified by the fact that first, most of these subsidies come from the Flemish government or an organization under its responsibility. Second, most voters do not distinguish between regional and federal funds in their evaluation of government performance. And even when they do, literature provides proof that it is possible for voters to reward politicians at one level of government for spending stemming from another level. A second remark, as mentioned earlier: Flanders is a very specific case and further research is thus necessary to check the extent of the found relationship in other countries.
Quite substantial policy implications can be derived from the results obtained. As politicians are rewarded for subsidies by voters, they will probably put a rather high effort into granting subsidies. From this point of view, we can thus conclude that a control on State aid is absolutely essential. This control will need to be organized at the national as well as at the supranational levels. The European Commission, for example, has the jurisdiction to decide on the authorization of State aid measures planned by EU Member States. However, not all subsidies fall under the notification obligation for a variety of reasons such as no effect on trade between Member States, block exemptions, and the de minimis regulation. For this rather considerable amount of financial resources that is spent on subsidies to firms, there should be an independent control system in place at the national level as well, to ensure that there are no harming consequences stemming from subsidies and to control for possible misallocation as a result of political motives.
References
Alvarez, Michael and Janson L. Saving (1997) ‘Deficits, democrats and distributive benefits’, Political Research Quarterly, 50(4): 809-831.
Baldwin, Richard E. and Frédéric Robert-Nicoud (2007) ‘Entry and asymmetric lobbying: why governments pick losers’, Journal of the European Economic Association, 5(5): 1064-1093.
Berry, Christopher R. and William G. Howell (2007) ‘Accountability and local elections: rethinking retrospective voting’, The Journal of Politics, 69(3): 844-858.
Books, John and Charles Prysby (1999) ‘Contextual effects on retrospective economic evaluations, The impact of the state and local economy’, Political behaviour, 21(1): 1-16.
Chindooroy, Rohan, Patrice Muller and Giovanni Notaro (2007) ‘Company survival following rescue and restructuring State aid’, European Journal of Law and Economics, 24(2): 165-187.
Collie, David R. (2000) ‘State aid in the European Union: the prohibition of subsidies in an integrated market’, International Journal of Industrial Organization,
18(6): 867-884.
Collie, David R. (2002) ‘Prohibiting State aid in an integrated market: Cournot and Bertrand Oligopolies with differentiated products’, Journal of Industry, Competition and Trade, 2(3): 215-231.
David, Paul A., Bronwyn H. Hall and Andrew A. Toole (2000) ‘Is public R&D a complement or substitute for private R&D? A review of the econometric evidence’,
Research Policy, 29(4-5): 497-529.
Dewatripont, Mathias and Paul Seabright (2006) ‘“Wasteful” public spending and State aid control’, Journal of the European Economic Association, 4 (2-3): 513-522.
Duch, Raymond M. and Randy Stevenson (2006) ‘Assessing the magnitude of the economic vote over time and across nations’, Electoral Studies, 25(3): 528-547.
European Commission (2010) ‘Studies and reports: Total State aid by Member State as a percentage of GDP’, URL (consulted on 12 Dec. 2011): http://ec.europa.eu/competition/state_aid/studies_reports/expenditure.html.
European Union (2008) ‘Consolidated versions of the Treaty on European Union and the Treaty on the Functioning of the European Union’, Official Journal C 115 of
9 May 2008.
Feldman, Paul and James Jondrow (1984) ‘Congressional elections and local federal spending’, American Journal of Political Science, 28(1): 147-164.
Gelabert, Liliana, Andrea Fosfuri and Josep A.Tribo (2009) ‘Does the effect of public support for R&D depend on the degree of appropriability?’, The Journal of Industrial Economics, 57(4): 736-767.
Glowicka, Elzbieta (2008) State aid and competition policy: the case of bailouts in the European Union, Dissertation, Humboldt-Universität Berlin.
Hagerty, Michael R. (2006) ‘Quality of life from the voting booth: the effect of crime rates and income on recent U.S. presidential elections’, Social Indicators Research, 77(2): 197-210.
Hancher L., T. Ottervanger T. and J. P. Slot (2006) EC State aids. London: Sweet
and Maxwell.
Hauk, Willian R. and Romain Wacziarg (2007) ‘Small states, big pork’, Quarterly Journal of Political Science, 2: 95-106.
Herron, M.C. and Shotts K.W., 2003 ‘Winners, losers and the congressional pork barrel’, Working paper, Northwestern University.
Jegers, Marc and Hilda Theunisse (2007) ‘Elementen van boekhouden en analyse van jaarrekeningen’ (Elements of accounting and financial statement analysis).
Brussel: VUBPress.
voting: The 1997 General election in England and Wales’, Political Behavior 22(2):
121-143
Johnston, Ron and Charles Pattie (2002) ‘Geographical scale, the attribution of credit/blame, local economic circumstances, and retrospective economic voting in Great Britain 1997: an extension of the model’, Environment and Planning C: Government and Policy, 20(3): 421-438.
Keefer, Philip and Stephen Knack (2007) ‘Boondoggles, rent-seeking, and political checks and balances: public investment under unaccountable governments’, The Review of Economics and Statistics, 89(3): 566-572.
Kwon, Hyeok Y. (2005) ‘Targeting public spending in a new democracy: evidence from South Korea’, British Journal of Political Science, 35(2): 321-341.
Lach, Saul (2002) ‘Do R&D subsidies stimulate or displace private R&D? Evidence from Israel’, The Journal of Industrial Economics, 50(4): 369-390.
Leigh, Andrew (2008) ‘Bringing home the bacon: an analysis of the extent and effects of pork-barreling in Australian politics’, Public Choice, 137(1-2): 279-299.
Levitt, Steven D. and James M. Snyder (1997) ‘The impact of federal spending on house election outcomes’, The Journal of Political Economy, 105(1): 30-53.
Lewis-Beck, Michael S. and Martin Paldam (2000) ‘Economic voting: An introduction’, Electoral studies,19: 113-121.
Limosani, Michele and Pietro Navarra (2001) ‘Local pork-barrel politics in national pre-election dates: The case of Italy’, Public Choice, 106(3-4): 317-326.
London Economics (2004) ‘Ex-post evaluation of the impact of rescue and restructuring aid on the international competitiveness of the sector(s) affected by such aid’, Final report to The European Commission, Enterprise Directorate General.
Manzetti, Luigi and Carole J. Wilson (2007) ‘Why do corrupt governments maintain public support?’, Comparative Political Studies, 40(8): 949-970.
Martin, Stephen and Paola Valbonesi (2008) ‘Equilibrium State aid in integrated markets’, The BE Journal of Economic Analysis and Policy, 8(3) Article 33.
Mueller, Dennis C. (2003) Public Choice III. Cambridge University
Press :Cambridge.
Nannenstad, Peter and Martin Paldam (1994) ‘The VP-function: A survey of the literature on vote and popularity functions after 25 years’, Public Choice, 79(3-4):
213-245.
Pattie, Charles, Daniel Dorling and Ron Johnston (1997) ‘The electoral geography of recession: local economic conditions, public perceptions and the economic vote in the 1992 British general elections’, Transactions of the institute of British Geographers, New series, 22(2):147-161.
Pattie, Charlie and Ron Johnston (2008) ‘Positional issues, valence issues and the economic geography of voting in British elections’, Journal of Economic Geography, 8(1):105-126.
Petrarca, Ilaria and Fabio Padovano (2011) ‘From taxes to politics, from politics to taxes: evidence of yardstick competition in the Italian municipalities’, Condorcet Center working paper. URL (consulted 24 May 2012) :
http://crem.univ-rennes1.fr/wp/2011/2011-01-ccr.pdf.
Robinson, James A. and Ragnar Torvik (2005) ‘White elephants’, Journal of Public Economics, 89: 197-210.
communes et des quartiers en Belgique’, Cahiers de démographie locale, 2:
115-158.
Stein, Robert M. and Kenneth N. Bickers (1994) ‘Congressional elections and the pork barrel’, The Journal of Politics, 56(2): 377-399.
Tannenwald Robert (2002) ‘Are state and local revenue systems becoming obsolete?’, National Tax Journal, 55(3): 467-489.
Verdier, Daniel (1995) ‘The politics of public aid to private industry-The role of policy networks’, Comparative Political Studies, 28(1): 3-42.
Appendix 1: Calculating the amount of subsidies
received
To calculate the amount of subsidies that each firm received, we follow Jegers and Theunisse (2007). They propose the following formula:
Investment subsidies = difference in book value of investment subsidies (∆15) + investment subsidies recognized as revenues (proportional to depreciation of subsidized asset) (9125)
+difference in book value deferred taxes (∆168)-transfer to deferred taxes (680)+transfer from deferred taxes (780)13
As subsidies increase later taxes, part of the subsidy obtained is booked as deferred tax. The last three terms allow us to estimate this part. The first two terms calculate the net subsidy received.
Appendix 2: Variable description and sources
Variable name Description Source
Incumbents 2009 Independent variable 1: vote share of incumbent parties at the 2009 elections per canton
(in%)
http://www.binnenland.vlaander en.be/verkiezingen
Relative change Independent variable 3: growth of vote share per canton
Own calculation from: http://www.binnenland.vlaander
en.be/verkiezingen Incumbents 2004 Vote share of incumbent parties
in the 2004 elections (in%) http://www.binnenland.vlaanderen.be/verkiezingen Inhabitants Number of inhabitants per
canton
(only used to calculate per capita variables)
http://statbel.fgov.be/nl/modules/ publications/statistiques/bevolki
ng/
Subsidy and subsidy per capita Amount of subsidies and subsidies per capita going to
each canton
Calculated as described in appendix 1
Socio-economic index Ranks municipalities according to their socio-economic
performance.
(http://knack.rnews.be/ Last consulted: 25. March 2010) Sanderson and Eggerickx, 2010