Rhythmic profile assessment of breast cancer cell lines and adipose derived stem cells after circadian entrainment
62
0
0
Texto completo
(2) INSTITUTO TECNOLÓGICO Y DE ESTUDIOS SUPERIORES DE MONTERREY. CAMPUS MONTERREY ESCUELA DE MEDICINA Y CIENCIAS DE LA SALUD. “RHYTHMIC PROFILE ASSESSMENT OF BREAST CANCER CELL LINES AND ADIPOSE DERIVED STEM CELLS AFTER CIRCADIAN ENTRAINMENT”. TESIS. PRESENTADA COMO REQUISITO PARCIAL PARA OBTENER EL GRADO ACADÉMICO DE:. MAESTRO EN CIENCIAS BIOMÉDIAS. POR: B.S. EDUARDO FRANCISCO LÓPEZ RUIZ. MONTERREY, N.L.. MAYO 2019.
(3) Para Mirna y Eduardo Que son y serán mi ejemplo incansable de amor y generosidad. ii.
(4) Sean Patrick Scott, Doctor en Bioquímica y Biofísica Molecular, Profesor Investigador, Catedrático en Bioingeniería y Medicina Regenerativa, como director del presente trabajo y Fabiola Castorena Torres, Doctora en Ciencias, con Especialidad en Toxicología Medicina, Profesora Investigadora, Catedrático en Investigación, como coordinador académico.. CERTIFICAN que la memoria presentada por Eduardo Francisco López Ruiz, alumno de la Maestría en Ciencias Biomédicas, con el Título “Rhythmic Profile Assessment of Breast Cancer cell lines and Adipose Derived Stem Cells after Circadian Entrainment”, reúne los requisitos requeridos para ser presentada y juzgada por el Tribunal correspondiente para optar al grado de Maestro.. Dr. Sean Patrick Scott.. Dra. Fabiola Castorena Torres.. Monterrey. Nuevo León a 08 de Mayo de 2019. iii.
(5) INSTITUTO TECNOLÓGICO Y DE ESTUDIOS SUPERIORES DE MONTERREY. CAMPUS MONTERREY. ESCUELA DE MEDICINA Y CIENCIAS DE LA SALUD. Los miembros del comité de tesis recomendamos que el presente proyecto de tesis presentado por el B.S. Eduardo Francisco López Ruiz sea aceptado como requisito parcial para obtener el grado académico de:. Maestro en Ciencias Biomédicas. Comité de Tesis. ____________________________________ Director: Sean Patrick Scott GIEE Bioingeniería y Medicina Regenerativa, Tecnológico de Monterrey. ____________________________________ Codirector: Jorge Eugenio Moreno Cuevas Universidad de Monterrey. ____________________________________ Sinodal: Rocío Ortiz López GIEE Cáncer Tecnológico de Monterrey. ____________________________________ Sinodal: Judith Zavala Arcos GIEE Terapias Innovadoras en Ciencias Visuales, Tecnológico de Monterrey. _______________________________ Dra. Fabiola Castorena Torres Director del Programa Mayo 2019 iv.
(6) “RHYTHMIC PROFILE ASSESSMENT OF BREAST CANCER CELL LINES AND ADIPOSE DERIVED STEM CELLS AFTER CIRCADIAN ENTRAINMENT”. Por. Eduardo Francisco López Ruiz. TESIS. Presentada al Programa de Graduados en Ciencias Biomédicas. Este trabajo es requisito parcial para obtener el grado de Maestro en Ciencias Biomédicas. INSTITUTO TECNOLÓGICO Y DE ESTUDIOS SUPERIORES DE MONTERREY. Mayo, 2019. v.
(7) I. Resumen El reloj circadiano es un mecanismo adaptativo que los organismos han desarrollado a lo largo de los años como rasgo evolutivo. Dada su etimología, estas características le confieren al organismo la capacidad de responder a los estímulos del día con mucha mayor eficiencia. La luz solar es el principal estímulo que sincroniza este mecanismo y que, a partir de los ojos, transduce señales hacia todo el cuerpo. Así mismo, todas las células del cuerpo tienen mecanismos intrínsecos que pueden ser sincronizados por otros estímulos como hormonas, estrés o calor. Este mecanismo es de vital importancia y está relacionado con procesos fisiológicos como la regeneración y proliferación celular. Esta tesis abordó dos problemáticas principales. Primero, se confirmó la inducción del ritmo circadiano a través de un estímulo de vitamina D en un modelo de células madre derivadas de tejido adiposo. Esto, mediante la cuantificación de la expresión génica de Bmal1 en un procedimiento convencional de choque de suero fetal bovino e inducción por vitamina D. Sin embargo, no se pudieron reproducir las oscilaciones previamente reportadas en la expresión del gen circadiano Per2. A su vez se observaron diferencias en el patrón de expresión de los diferentes genes canónicos de pluripotencialidad. Interesantemente, tras un análisis matemático, se encontró que la expresión de Oct4 tenía un comportamiento en sincronía con Bmal1 después del tratamiento por suero fetal bovino. Esto abre la posibilidad de una relación mucho más directa del estado de pluripotencialidad con el mecanismo canónico de ritmos circadianos. Segundo, se evaluó el perfil proteico de dos líneas celulares de cáncer de mama (MCF-7 y MDA-MB-231) después de una sincronización por suero fetal bovino. A pesar de que se ha demostrado que el mecanismo molecular circadiano es poco funcional en líneas de cáncer de mama, se ha explorado la posibilidad que haya ritmicidad en estas líneas celulares. Se confirmó que hay patrones de comportamiento rítmicos en ambas líneas celulares. Ninguna proteína se identificó con comportamiento rítmico en ambas líneas celulares. Sin embargo, proteínas con un comportamiento constante a lo largo de 72 horas muestran un patrón de expresión fuertemente diferencial en ambas líneas celulares. Estos hallazgos demuestran que la profundidad del rol de los ritmos circadianos aún no ha sido comprendida a su totalidad. En el caso del modelo en células madre, un mayor rol en el estado de pluripotencialidad se sugiere ser estudiado. En el caso de las líneas de cáncer de mama, su caracterización y posible identificación como blancos terapéuticos. vi.
(8) II. Summary The circadian clock is an adaptive mechanism that organisms have developed over the years as an evolutionary feature. Given its etymology, these characteristics give the body the ability to respond to the stimuli of the day with much greater efficiency. Sunlight is the main stimulus that synchronizes this mechanism and that, from the eyes, transduces signals to the whole body. Likewise, all the cells of the body have intrinsic mechanisms that can be synchronized by other stimuli such as hormones, stress or heat. This mechanism is of vital importance and is related to crucial physiological processes such as cell regeneration and proliferation. This thesis addressed two main issues. First, the induction of the circadian rhythm was confirmed through a vitamin D stimulus in a model of adipose derived stem cells. This, by means of the quantification of the gene expression of Bmal1 in a conventional procedure of bovine serum shock and induction by vitamin D. However, the oscillations in the expression of circadian gene Per2 could not be replicated as in previous study. In turn, differences were observed in the expression pattern of the different canonical genes of pluripotency. Interestingly, after a mathematical analysis, it was found that the expression of Oct4 had a behavior in synchrony with Bmal1 after treatment by fetal bovine serum. This opens the possibility of a much more direct relationship of the state of pluripotency with the canonical mechanism of circadian rhythms. Second, the protein profile of two breast cancer cell lines (MCF-7 and MDA-MB-231) was evaluated after synchronization by fetal bovine serum. Although it has been shown that the circadian molecular mechanism is not very functional in breast cancer lines, the possibility of rhythmicity in these cell lines has been explored. It was confirmed that there are rhythmic behavior patterns in both cell lines. No protein was identified with rhythmic behavior in both cell lines. However, proteins with a constant behavior over 72 hours show a strongly differential expression pattern in both groups. These findings show that the depth of the role of circadian rhythms has not yet been fully understood. In the case of the model in stem cells, a greater role in the state of pluripotency is suggested to be studied. In the case of breast cancer lines, their characterization and possible identification as therapeutic targets.. vii.
(9) III. Acknowledgement I would like to express my infinite gratitude to my parents for the wholesome support over this process. A lifetime admiration, respect and deep love to you. My special appreciation, gratitude and admiration to my main advisor, Dr. Sean Scott. His guidance let me discover love and respect for science. Thanks for your support. I want to thank Dr. Jorge Moreno for his support and friendship. His leadership over the focus group allowed me to live an amazing experience all the time I spent at CITES. To Dr. Rocio Ortiz and Dr. Judith Zavala, for serving as my committee members, and for their help in this dissertation. Special thanks to all people at CITES. Specially to Isabel García for the materials, time and kindness along this time. My complete admiration to her. My gratitude to all the undergraduate students that helped and volunteered during my master’s studies. Daniela, Ivana, Victor, David, Daniel and Diego, it was great to share this experience with you. To Carlos who became a sincere friend after week long experiments. Appreciation, admiration and gratitude to him. My gratitude and love to my classmates. Ramiro and Paloma, for their emotional support and advise during the program. And special thanks to Mayela. A true friend and inspiration. Thank you for your kindness and unconditional help. My complete admiration, gratitude and love to Jocelin, with whom I have shared almost a year of emotional struggles and happy moments. Your help, support and guidance carry me through bad times. I wish the very best to you always. Special thanks to Arturo. One of my very best friends. Your support and patience helped me to keep in the race. Thanks for the good moments and wish you the best in your fight.. viii.
(10) IV. Table of Contents I. Resumen ............................................................................................................................. vi II. Summary .......................................................................................................................... vii III. Acknowledgement ......................................................................................................... viii IV. Table of Contents ............................................................................................................ ix V. Index of tables and figure ................................................................................................. xi 1. Introduction ........................................................................................................................ 1 2. Literature Review ............................................................................................................... 2 2.1 Circadian Rhythms ....................................................................................................... 2 2.1.1 Circadian Entrainment............................................................................................ 3 2.1.2 Vitamin D as a Circadian Inductor ......................................................................... 5 2.2 Mesenchymal Stem Cells.............................................................................................. 6 2.2.1 Adipose-Derived Mesenchymal Stem Cells .......................................................... 7 2.2.2 Pluripotency ........................................................................................................... 9 2.3 Breast Cancer .............................................................................................................. 11 2.3.1 Breast Cancer and Circadian Rhythms................................................................. 12 3. Aims and Justification ...................................................................................................... 14 3.1 Research Proposal ....................................................................................................... 14 3.2 Hypothesis .................................................................................................................. 14 3.3 Objectives ................................................................................................................... 15 3.3.1 General Objectives ............................................................................................... 15 3.3.2 Specific Objectives ............................................................................................... 15 3.4 Justification ................................................................................................................. 16 4. Materials and Methods ..................................................................................................... 17 4.1 Adipose Derived Stem Cell Genetic Assessment ....................................................... 17 4.1.1 Cell Culture .......................................................................................................... 17 4.1.2 Entrainment .......................................................................................................... 17 4.1.3 RNA isolation from samples ................................................................................ 18 4.1.4 Expression analysis of circadian and pluripotency genes by qPCR .................... 19 4.2 Breast Cancer Protein Profiling .................................................................................. 19 4.2.1 Cell Culture .......................................................................................................... 19 4.2.2 Entrainment .......................................................................................................... 20 4.2.3 Protein Extraction and Sample Standardization ................................................... 20 4.2.4 2D Electrophoresis ............................................................................................... 21 ix.
(11) 4.2.3 Normalization ....................................................................................................... 21 4.2.4 Analysis ................................................................................................................ 21 5. Results and Discussion ..................................................................................................... 22 5.1 Adipose Derived Stem Cell Genetic Expression Assessment .................................... 22 5.2 Breast Cancer Protein Profiling .................................................................................. 29 6. Conclusion and Perspectives ............................................................................................ 38 7. References ........................................................................................................................ 40 8. Appendixes ....................................................................................................................... 49 A. Primers Sequences and Efficiencies ............................................................................ 49 B. Normalization Example ............................................................................................... 50. x.
(12) V. Index of tables and figure Figures Figure 1. Mammalian circadian clock and its transcriptional-translational feedback network. .................................................................................................................................. 4 Figure 2. Temporal expression profile of Bmal1 and Per2 in synchronized ADSCs ........... 22 Figure 3. Relative mRNA Levels ......................................................................................... 23 Figure 4. Temporal expression profile of pluripotency genes .............................................. 24 Figure 5. MetaCycle modeling and Bmal1 expression ........................................................ 26 Figure 6. MetaCycle modeling in serum shocked cells and the expression of Notch1 and Oct4 genes ............................................................................................................................ 27 Figure 7. MetaCycle model comparison from serum shocked cells .................................... 28 Figure 8. Flow chart for SSP analysis. ................................................................................. 29 Figure 9. Representative SSPs from MCF-7 Horse Serum Shock ....................................... 33 Figure 10. Representative SSPs from MCF-7 Bovine Serum Shock ................................... 34 Figure 11. Representative SSPs from MDA-MB-231 Bovine Serum Shock ....................... 35 Figure 12. SSPs matched from MCF-7 bovine serum and MDA-MD-231 bovine serum ... 37. Tables Table 1. AD-MSC and BD-MSC surface markers comparison ............................................ 8 Table 2. Breast cancer Immunohistochemical classification............................................... 12 Table 3. MetaCycle Analysis for Circadian and Pluripotency genes ................................... 25 Table 4. MCF-7 Horse Serum shock MetaCycle summary.................................................. 30 Table 5. MCF-7 Bovine Serum shock MetaCycle summary................................................ 31 Table 6. MDA-MB-231 Bovine Serum shock MetaCycle summary ................................... 32. xi.
(13) 1. Introduction They way organisms have adapted to Earth’s environmental conditions is a clear trait of evolution. Regulation of metabolic and physiological activities in response to daily stimulus are a strong evidence that rhythmicity and routine play a fundamental role in the regulation and adaptation of organisms. The response of these organisms to the changes over the day and night, and how they respond to those stimuli are responsibility of the circadian rhythms. Even though, most of this mechanism are regulated through the light-darkness changes perceived through the eyes (Korenčič et al., 2015), there are inherent clocks all over the body called peripheral clocks (Dibner, Schibler, & Albrecht, 2010). These last mechanisms are a clear trait of early response to daily stimulus and stress. While, the master clock from the suprachiasmatic nucleus (SCN) is synchronized with the light-dark stimulus, the independent clocks in the body may be synchronized through different signaling, like hormones, neurotransmitters or even heat. This synchronization process is called entrainment. In this thesis, two main topics are explored; first, the behavior of pluripotency genes after circadian entrainment using adipose derived stem cells (ADSCs) as a model. Comprehending the molecular phenomena around the peripheral clocks’ synchronization. Second, the protein profile assessment of MCF-7 and MDA-MB-231 cancer cell lines after circadian entrainment. This part intends to elucidate the rhythmic behavior of different breast cancer cell lines after circadian entrainment, with the final goal of identifying proteins which rhythmically oscillate in different cell lines and are feasible targets for chronotherapy.. 1.
(14) 2. Literature Review 2.1 Circadian Rhythms Circadian Rhythms (CR) are endogenous mechanisms that dictate how specific functions of organisms behave (biochemically, physiologically, etc.) during the course of a day (24 ± 4 h) (Touitou, Reinberg, & Touitou, 2017) in humans, the circadian system is a complex entity. Architecture starts in the eye and continues through the pineal gland. This gland produces melatonin (5-methoxy-N-acetyltryptamine), a crucial neurohormone for functioning of the inherent clock, and is secreted during the dark phase of the light-dark cycle (Touitou et al., 2017). It has been shown that these CRs are intrinsic to the cell even at in vitro conditions, so it is inferred that internal synchrony is largely governed by the hypothalamic suprachiasmatic nuclei that facilitate anticipation and adaptation of solar cycle. Thus, a regular circadian rhythm is closely related to homeostatic mechanisms: healthy clockwork = healthy body and mind (Reddy & O’Neill, 2010). Therefore, if the in vitro models show circadian behavior, the CRs must not completely induce by external factors but cells possess an internal independent and regulated mechanism. The endogenous cell oscillators driving daily rhythms are conceived as a cell-autonomous clock that is governed by an interlocked network of genomic and transcriptional feedback loops. These elements are called “modulation factors” and are associated with E-boxes, ROR-elements and D-boxes and their genomic precursors (Bmal1, Per2, Cry1), and they may be involved in differential regulation of cytochromes p450 and harmonic loops in 12 h periods (Korenčič et al., 2015). As mentioned before, a homeostatic regulation and functioning of stem cells are crucial for different regenerative, proliferative and maintenance mechanisms. Further, misregulation of activity may lead into many disorders such as cancer (Seymour, Twigger, & Kakulas, 2015), and circadian rhythms are clearly involved in some of these ailments. It has been shown that identified circadian genes (Per1, Per2, Clock, Bmal1, and Npas2) are altered in breast cancer leading to an arrhythmic regulation and expression of several mechanisms in cells (Edyta Reszka, Przybek, Muurlink, & Pepłonska, 2017). Even though different types of breast cancer cell lines (MCF-10A, MCF-7, ZR-75-30, MDA-MB-231 and HCC-1954) present different gene expression profiles (Gutiérrez-Monreal, Treviño, MorenoCuevas, & Scott, 2016a). Several other studies confirmed that there is a link between 2.
(15) circadian rhythm disruptions and tumorigenesis and even positive results in the relation with prognosis (Cadenas et al., 2014). Additional data suggest that the microRNAome in circadian disruption-induction in rodent model directly affects mammary gland tissue as an epigenetic link to breast cancer development (Kochan et al., 2015), and in human cell culture (ChacollaHuaringa, Moreno-Cuevas, Trevino, & Scott, 2017). Hence the circadian rhythm relation with stemness may be proved as a cell proliferation and migration phenomenon like cancer. Actually, it has been suggested that normal homeostatic functions regulated by circadian rhythms in mice, tend to be reduced to upgrade specific-tissue stress response, leading to a newly aged reprogramming in stem cells (Solanas et al., 2017). Thus, many studies now are paying more attention to the role of circadian clock genes and the influence over stem cells, as some studies suggested that circadian rhythms are key tools in the differentiation, migration and cell cycle of mesenchymal stem cells (MSCs) (Boucher, Vanneaux, Domet, Parouchev, & Larghero, 2016). Fig. 1 shows the molecular mechanisms of mammalian circadian clock and its composition. 2.1.1 Circadian Entrainment Keeping in mind that the circadian control is inducted mostly by external factors, assessing in vitro conditions would require an independent stimulus to replace this inherent signaling. The suprachiasmatic nucleus, in mammals, is synchronized with 24 hour a day stimulus called zeitgeber. This external input is predominantly light, due to the day-night transition. Physiologically the light synchronization is dictated by visual stimulus and transduced into the control of the clock mechanisms. This process is known as entrainment. Anyhow, the peripheral clocks all over the body typically remain active without any external alert. The expression of this rhythmicity without a connection with the major synchronization is called free-running rhythm (Aschoff, Gerecke, & Wever, 1967). At in vitro conditions there are several ways to “awake” these inherent clocks. The fact that reproducing the whole signaling process at laboratory conditions to mimic the master synchronization is nearly impossible, techniques that attempt to reproduce the inherent behavior. This external form of entrainment may be achieved by the culmination of neuronal, hormonal and/or metabolic factors in a direct or indirect way (Balsalobre, Damiola, & Schibler, 1998). This groundbreaking procedure lead into the search for finding 3.
(16) Figure 1. Mammalian circadian clock and its transcriptional-translational feedback network. “Circadian mechanism involves transcriptional-translation feedback loops comprised of a ser of core clock genes. In mammals. In mammals, the circadian clock is composed of a primary negative feedback loop involving the genes, Clock (and its paralogue neuronal PAS domain protein 2, Npas2), Bmal1, period homologue 1 (Per1), Per2, cryptochrome 1 (Cry1) and Cry2. CLOCK (or NPAS2) and BMAL1 are basic helixloop-helix PAS-domain containing transcription factors that activate transcription of the Per and Cry genes. The resulting PER and CRY proteins heterodimerize, translocate to the nucleus and interact with the CLOCK– BMAL1 complex to inhibit their own transcription. After a period of time, the PER–CRY repressor complex is degraded and CLOCK–BMAL1 can then activate a new cycle of transcription. The secondary autoregulatory feedback loop is composed of Rev-Erba, which is a direct target of the CLOCK–BMAL1 transcription activator complex. REV-ERBA feeds back to repress Bmal1 transcription and competes with a retinoic acid-related orphan receptor (ROR) to bind ROR response elements (RREs) in the Bmal1 promoter. In addition to the transcriptional activators and repressors, post-translational modification and degradation of circadian clock proteins are crucial steps for determining circadian periodicity. Key kinases for PER (and CRY) phosphorylation are casein kinase 1 delta (CSNK1D) and CSNK1E. One of the roles for phosphorylation of clock proteins is to target them for polyubiquitylation and degradation by the 26S proteasomal pathway”. Image and description taken from Takahashi and collaborators (J. S. Takahashi, Hong, Ko, & McDearmon, 2008).. 4.
(17) out the synchronization mechanisms. Right after this discovery, many chemical substances were demonstrated to trigger the circadian pathway and inducing rhythmicity in mammalian cultured cells. For example, chemical induction of PKA, PKC and/or MAPKs, G-proteincoupled receptors, the glucocorticoid receptor and release of intracellular calcium, all elicited the oscillation of clock genes transcripts. Other chemicals that have been shown to trigger circadian gene expression are retinoic acids, prostaglandins, glucose and synthetic ligands of the orphan receptor NR1D1 (Saini, Uter, Iani, Os, & Chibler, 2011). The dependent signaling involved, may be inferred, participate in both clock synchronization/entrainment. In this thesis, it is proposed to assess two main procedures to entrain adipose derived cells: bovine serum-shock and 1α,25-dihydroxyvitamin D3 shock. 2.1.2 Vitamin D as a Circadian Inductor Vitamin D3, also known as cholecalciferol, is a type of Vitamin D made in the skin, found in food and used as a dietary supplement. Since vitamin D can only be produced through photochemistry via skin. Humans —as other terrestrial vertebrates—, need to consume foods that contain vitamin D, or be exposed to UV-R to meet their vitamin D requirement (Lucock et al., 2015). Several tissues and cells in the body have Vitamin D Receptor (VDR) and several possess the enzymatic machinery to convert the primary circulating form of vitamin D, 25-hydroxyvitamin D, to the active form, 1,25dihydroxyvitamin D, which provide an insight into the whole role of the vitamin and its functions (Michael & Holick, 2007). As VDR is found in most of tissues, the main role of the vitamin D is regulating bone metabolism and calcium and phosphorus homeostasis (Kim & Dohee, 2017). As a pretty frequent nuclear receptor, VDR is involved —as 1, 25dihydroxyvitamin D—, directly or indirectly in the control of more than 200 genes (Holick, 2006). Therefore, vitamin D interaction with VDR is involved in several physiological processes such as epithelial mesenchymal transition (Larriba, García De Herreros, & Muñoz, 2016); regulation in proliferation, differentiation, apoptosis and angiogenesis (Michael & Holick, 2007); up and down regulation in adhesion, cell migration and invasion in breast cancer (Pendás-Franco et al., 2007) and in the regulation of blue-light dependent cryptochromes, which are key in circadian oscillations in animals and plants (Lucock et al., 2015).. 5.
(18) Recent approaches willing to explain how the organism induce the rhythmicity in stem cells have led to the discovery that Vitamin D plays an important role in osseointegration and cartilage regeneration (Mengatto, Mussano, Honda, Colwell, & Nishimura, 2011). In the same order of ideas, the CRs could be tightly related to the active form of Vitamin D (1, 25(OH)2D) and Vitamin D-like metabolites as there is a rhythmic variation in their concentration during a 24 h cycle —day-night variation —(Jones et al., 2017). Moreover, 1α,25-Dihydroxyvitamin D3 (active form of Vitamin D) is known to induce CR in MSCs compared to regular induction with serum shock (Gutierrez-Monreal, CuevasDiaz Duran, Moreno-Cuevas, & Scott, 2014). 2.2 Mesenchymal Stem Cells One of the main intrinsic characteristics of the pluricellular organisms is tissue regeneration; part of this contribution directly depends on stem cells. These cells hold the division and differentiation (into any specialized cell) capability; additionally, they possess the capacity of self-renewal to preserve the existence of the SCs through an asymmetric division, resulting into an identical SCs and a progeny with differentiation potential. Now it is known, to the contrary to what was believed that the SCs are distributed through different niches of all the organs and tissues, even in aged organisms, so this regenerative mechanism is presumably available through all stages of life (Crisan et al., 2008). The MSCs are one of the most studied and characterized Adult Stem Cells (ASC) because of their great therapeutic potential; these are described as a peculiar group with high medical prospective since their great effect over tissue injuries and inflammation— endogenous or exogenous— (Caplan, 2015). MSCs are adult non-hematopoietic cells that were first isolated from bone marrow, and now can be isolated from any tissue of the body. MSCs were originally described as precursors of stromal elements, ex vivo plastic-adherent growth type of cells; nowadays they have been shown to differentiate into skeletal muscle, adipose tissue, cartilage, bone, and tendon (Via, Frizziero, & Oliva, 2012). Additionally, some of the studies suggest that they can differentiate into neural cells, such as neurons and glial cells (Hermann et al., 2004). Even though, MSCs are identified as vessel-lining pericytes that may contribute to vessel homeostasis by reacting to tissue damage modulating inflammatory reaction locally. In that order of ideas, all kinds of ASCs should be located. 6.
(19) throughout the body, as they are not specialized in a regular physiological function rather than the regenerative process; all these kinds of cells reside in controlled and specific microenvironments called “niche”. The stem nell niche is used to describe just the location of the stem cells, but they are more than that: they provide the optimal arrangement of cellular components of the microenvironment surrounding stem cells and emanating from support cells. This means that the stem cell niche are complex sites of regulation too and are involved in how MSCs act at the end. Therefore, the niche saves stem cells from depletion, as a defensive barrier to exuberant overproliferation, special maintenance of stem cells, anchored to the stem cells, generation of extrinsic factors that control fate and number of stem cells and even self-renewal (Kfoury & Scadden, 2015). The exact location of these sites is poorly known and understood as they are present throughout the body, even when the evidence suggests that MSCs are located within the vicinity of vessel walls. After all, ASC remain in an undifferentiated state throughout life but in vitro they usually undergo an aging process in which morphology is changed, and their proliferative capacity is roughly decreased (Via et al., 2012). Furthermore, various adult mesenchymal tissues have been identified as sources of MSCs such as trabecular and cortical bone, synovial membranes, tendons, skeletal muscle, peripheral blood, periosteum, umbilical cord blood, Whanton’s jelly, and adipose tissue. As the main topic of interest in this work, MSCs coming from adipose tissue will be the central interest to develop.. 2.2.1 Adipose-Derived Mesenchymal Stem Cells Adipose-derived Mesenchymal Stem Cells (AD-MSC) are increasing popularity since they offer an attractive alternative to the use of bone marrow mesenchymal stem cells (BMMSCs), mainly due to the ease of tissue collection, high initial cell yields, and robust proliferative capacity in vivo. AD-MSCs can be obtained from liposuction aspirates as one of the most popular ways to obtain them, under local anesthesia, if small amounts of adipose tissue are needed. In comparison, there are more than 50 times more stem cells in 1 g of fat compared to 1 g of aspirated bone marrow with a cell count of 5,000 stem cells coming from adipose tissue against 100 to 1,000 cells/mL out of marrow subtraction (Strem et al., 2005). As BM-MSCs, the AD-MSCs appear to be able to differentiate in vitro toward the osteogenic,. 7.
(20) myogenic, chondrogenic, and adipogenic types; for these reasons, it was believed that MSC located in peripheral blood were mobilized from other source (Caplan, 2015). Anyhow, as Table 1. AD-MSC and BD-MSC surface markers comparison Surface markers. Expression Pattern (Domini ci et al., 2006) MSC. (Haynesworth, Baber, & Caplan, 1992). AD. BM. BM. CD9. +. +. CD10. +. +. CD13. +. +. +. +. CD271. +. .+//-. SSEA-4. -. .+//-. -. +. -. CD19. -. BM. (Lv, Tuan, Cheung, & Leung, 2014) AD. CD14. AD. (Strem et al., 2005). CD29. +. +. +. +. CD31. -. +. -. -. -. +. -. -. +. +. +. +. -. +. -. -. CD49d. +. -. CD49e. +. +. CD54. +. +. CD55. +. +. CD59. +. +. CD34. -. CD44 CD45. -. CD 71. +. +. CD73. +. +. +. CD90. +. +. +. +. +. CD105. +. +. +. +. +. CD106. -. +. CD117. +. +. CD146. +. +. CD166. +. +. STRO-1. +. +. *(MSC) Mesenchymal Stem Cells; (AD) Adipose-Derived populations; (BM) Bone Marrow populations. 8.
(21) they share some surface markers, both groups are identified as MSC populations with some similitudes and differences, as shown in Table 1. AD-MSCs as all the adult SCs emerge at some point of the development, and as they age, there is a clear loss in pluripotency and tissue restricted differentiation ability. Although plenty of studies show, that mesenchymal lineage has the potential to be stem cells, some of the requirements to formally demonstrate selfrenewal and differentiation in vivo were not that conclusive. Due to the use of the same abbreviation —MSC—, the reference to Stem or Stromal cells requires a characterization of their lineage which has involved incongruities in results and in plenty of literature there is not a consensual test to evaluate stemness (Dominici et al., 2006; Phinney & Senseb́ e, 2013). Moreover, as Kfoury & Scadden reviewed, the “Mesenchymal Stem Cell nomenclature proved to be problematic when it became obvious that not all plastic adherent stromal cells have comparable self-renewal and in vivo differentiation ability into multiple lineages” (2015). All this controversy led the International Society for Cellular Therapy (ISCT) to resolve the nomenclature clarification: “restricting the use of the term Mesenchymal Stem Cells for cells that meet the stem cell criteria and recommending the term Multipotent Mesenchymal Stromal Cells for any fibroblast-like plastic adherent cells regardless of tissue of origin” (2015). Briefly after the ISCT added minimal criteria to the identification of real stem cells: CD105+, CD73+, AND CD90+; CD45-, CD34-, CD14- (CD11b), and CD79α(CD19-), and HLA-DR surface molecules in addition to the ability to differentiate into osteogenic, chondrogenic, and adipogenic lineages in vitro as shown in Table 1 (Dominici et al., 2006). These immunological biomarkers are specific for human cells, as the rodent models present a slightly different pool of CDs (Chamberlain, Fox, Ashton, & Middleton, 2007). 2.2.2 Pluripotency One of the main attributes of MSCs is their remarkable capability of differentiation, both, in vitro and in vivo, into various mesenchymal tissues (bones, cartilage, fat, muscles, tendons, and bone marrow). Their significant plasticity, as they possess an intrinsic ability to transdifferentiate or undergo and abrupt alteration in phenotype, show a tremendous potential for the treatment such as immunological and non-immunological disorders (Squillaro, Peluso, & Galderisi, 2016), as other pathological issues such as degenerative ocular diseases. 9.
(22) (Labrador-Velandia et al., 2016), circulation and heart diseases (Kanelidis, Premer, Lopez, Balkan, & Hare, 2016), and other specific tissue disorders. The wide clinical and therapeutic potential of MSC, beside their differentiation characteristic, is due to their location throughout the body, as they may be located and isolated from almost every tissue. It is now suggested that perivascular cells in multiple human organs (muscle, pancreas, adipose tissue, and placenta), showing no evidence of endothelial hematopoietic and myogenic cell markers, preserving mitogenicity yet their long-term culture, differentiation potential, and chemotaxis (Crisan et al., 2008). The presence of MSC markers at peripheral perivascular cells may indicate that blood vessels walls harbor a reserve of MSC progenitors probably related to almost every kind of adult stem cells (2008). Additionally, to this new evidence, more and more studies are made around the behavior of MSC and how they interact with the adjacent cells and organs, and how they contribute in specific regenerative processes. Moreover, this behavior may be strictly ligated to the differentiation mechanism, so it might be inferred that there is a direct relation between pluripotency, at different levels (transcriptomic, proteomic, metabolomic), and the general homeostatic, maintenance and regenerative machinery. New focus in medicine, therefore, aim to manage the use of MSC to optimize the body’s very powerful and ever-changing intrinsic regenerative potential (Caplan, 2015). Yet, knowing the genomic basics of pluripotency potential in SCs is an indispensable tool to analyze the specialization and specific activity of pluripotent cells. Therefore, due to the plasticity of MSCs the artificial differentiation is a way better focus to regenerative treatments in complex tissues; for that, the understanding or the molecular processes leading to the commitment and differentiation of cells should drive to a cell reprogramming, not by a nuclei transplantation, as tried before, but by introducing and manipulating gene functions into cells (SánchezAlvarado, Alejandro; Yamanaka, 2014). Human adult stem cells tend to have specific molecular expression, such as human adult germ stem cells, and this one is related to other stem cells but not identical to true pluripotent cells (Conrad et al., 2016). Deductively a specific gene expression could lead to a pathway or pluripotency or differentiation potential, so variations in the expression may be the difference in the behavior of different SC behavior. By now reverse differentiation has been achieved: differentiated cells may be programmed into an embryonic-like state by the nuclear transfer; the induction was made by the introduction under embryonic stem cell culture conditions of Oct3/4, Sox2, c-Myc, and Klf4 10.
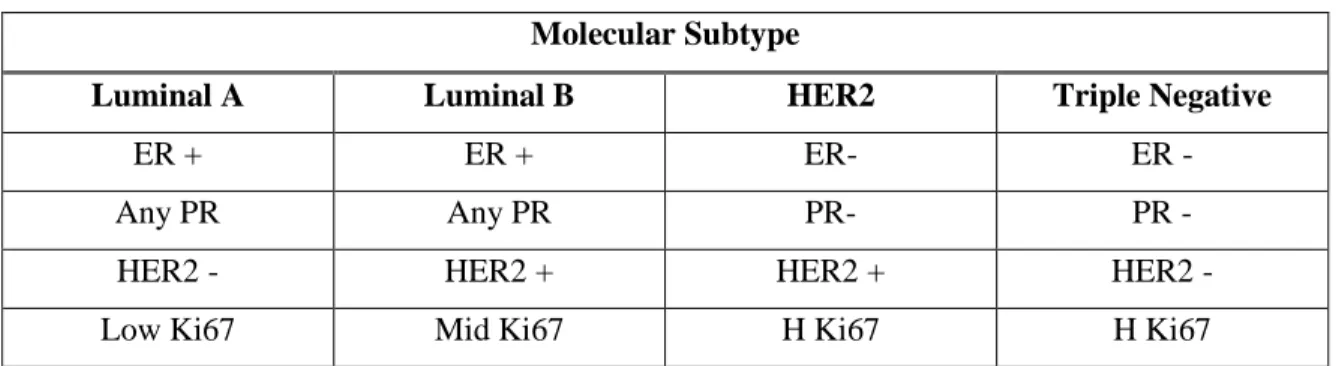
(23) (K. Takahashi & Yamanaka, 2006). These four were identified as the first pluripotency gene pool, anyhow, other genes are usually included as pluripotency markers such as Notch1 (Tadeu & Horsley, 2013) and Nanog (Seymour et al., 2015). The identification of this specific expression related to stemness should guide into a proteomic way of behavior, suddenly. As an analogical behavior the genomic of stem cells is closely related to the cancer and aberrant tissues. The strongest evidence suggest that adult stem cells share certain transcriptomic characteristics with Embryonic Stem Cells regulated by master pluripotency transcription factors: Oct4, Sox2, and Nanog; thus, aberrant expression of these factors may lead to an oncogenic process resulting in heterogeneous tumors fueled by Cancer Stem Cells (Seymour et al., 2015). Moreover, proteomic and metabolomic of SC, in general, is wider than what know it is understood; for instance it has been discovered that the secretomederived products from MSC may influence the sited tissue in clinical trials, open the possibility to a new mechanism of regeneration beside the exclusive SC differentiation (Vizoso, Eiro, Cid, Schneider, & Perez-Fernandez, 2017). This far, pluripotency mechanism and differentiation/reverse differentiation have a lot of missing paths to be fully understood so new focuses of studying them may be needed in order to fill the gaps. 2.3 Breast Cancer Breast cancer has become a major public health issue in developing and middle-income countries. In Mexico, due to its mortality and incidence rates, breast cancer has risen in past few decades into a serious public health problem (Chávarri-Guerra et al., 2012). By 2008, nearly 7.6 million deaths were accounted, representing almost 13% of the total deaths worldwide (Chávarri-Guerra et al., 2012). The ratio of mortality to incidence is substantially higher in low-income and middle-income countries (64-75%) than in high income countries (46%) (Farmer et al., 2010). This reflects a strong correlation in the survival rate of women with their incomes and shows a great disparity in the prognosis of the disease (Farmer et al., 2010). After almost half a century of intensive research about cancer it may be affirmed that not ever single type of breast cancer is treated the same way. Different response is a common factor due to biological variation derived from genetic background (Merino Bonilla, Torres. 11.
(24) Tabanera, & Ros Mendoza, 2017). Table 2 summarizes the molecular classification of breast cancer using regular immunohistochemical techniques. Table 2. Breast cancer Immunohistochemical classification Molecular Subtype Luminal A. Luminal B. HER2. Triple Negative. ER +. ER +. ER-. ER -. Any PR. Any PR. PR-. PR -. HER2 -. HER2 +. HER2 +. HER2 -. Low Ki67. Mid Ki67. H Ki67. H Ki67. ER: Estrogen Receptors; PR: Progesterone Receptors; HER2: Human Epidermal Growth Factor 2; Ki67: basal proliferative ratio Ki67; (L/M/H) Low, Middle, High, ratio. Retrieved from (Merino Bonilla et al., 2017). 2.3.1 Breast Cancer and Circadian Rhythms It is known that woman, specially nurses, that work nocturnal schedules have more propensity to develop breast cancer (Davis, Mirick, & Stevens, 2001). One of the main mechanisms proposed to explain this phenomenon is the light-shifting from electric bulbs that might disrupt circadian rhythms. It is supposed, then, that a misfunction of the suprachiasmatic nucleus and therefore a circadian disruption, may lead into a worst prognosis in cancer. For example, Canaple et al have demonstrated that, in mice model, disruptions in circadian rhythms due to suprachiasmatic nucleus lesions might result into worse tumor progression (Canaple, Kakizawa, & Laudet, 2003). Keeping in mind that peripheral circadian clocks are mostly independent, a broader study at tissue specific behavior is suitable for understanding the effects of these disruptions at cancer. It is known that breast tissue contains a network of branched epithelial ducts surrounded by a basement membrane, rich with fibroblast-rich and adipose-rich stromal extracellular matrix (Muschler & Streuli, 2010). The role of the inherent clocks in breast tissue is important for the basal functions of the zone. At mice model, there has been discovered clocks within breast epithelium using real-time bioluminescent imaging from PER2:Luc (Lowrey et al., 2004). Therefore, daily variations in a rhythmic way are expressed at core proteins BMAL1 and PER2. Moreover, during the development of the gland from 12.
(25) virgin through to full lactation, tissue isolated at the same time odd day reveals that Bmal1 and Per1 mRNA are increased during pregnancy and lactation, while Per2 falls ((Casey et al., 2014; Metz, Qu, Laffin, Earnest, & Porter, 2006)). It is inferred then, that this local clocks at breast tissue are controlled by the microenvironment. Even though, the mechanism linking the cell exterior to clock control are not yet know, or comprehended, but could involve the cytoskeleton and/or nuclear envelope proteins, one of which regulates transcription of the Bmal1 gene (Lin et al., 2014). In this context, the regulation over the tissue is highly related with stemness in the zone. Self-renewal capacity of mammary progenitor stem cells becomes compromised in mice that have a defective CLOCK/BMAL1 complex, revealing a circadian influence on breast function (Hoffman et al., 2010). Studies in other tissues have demonstrated similar links between the circadian clock and stem cells, which leads into getting interest in circadian as a possible detonator.. 13.
(26) 3. Aims and Justification 3.1 Research Proposal It is supposed that 1α, 25-Dihydroxyvitamin D3 may lead to a pluripotency signaling regulations, as it is believed that its role over regenerative process is not deeply known. In addition, the relationship between stemness and differentiation process has been described lately. Therefore, this thesis proposes an AD-MSC culture model with Vitamin D treatment, that may serve as a transcription regulator of pluripotency gene pool (Oct4, Sox2, Nanog, Notch1 and Rex1); and a serum shock treatment as a circadian rhythm control. This, with the purpose of assessing the behavior of pluripotency core gen machinery and a transversal comparation with two of the main circadian clock genes: Bmal1 and Per2. In the end, the evidence may show if there is difference in the behavior due to the circadian induction and/or Vitamin D treatment against the control group, and if the behavior of pluripotency core machine is alike the circadian oscillations, along 72 hours with 4 hours’ time point samples. As well, in the research group it has been demonstrated that there are oscillations around 24 hours in breast cancer cell lines at different expression levels. In this thesis it is proposed a single experiment to complement a major project in the group. MCF-7 and MDAMD-231 cell lines are evaluated with a standard serum shock experiment and the total protein is quantified and run in 2D to compare the protein profile of both cell lines along 72 hours with 4 hours’ time point samples. 3.2 Hypothesis Adipose Derived Stem Cells part: Inducing rhythmicity in adipose derived stem cells will change pluripotency patterns at genetic expression Breast Cancer part: MCF-7 and MDA-MB-231 cell lines have different rhythmic protein patterns along 72 hours. 14.
(27) 3.3 Objectives 3.3.1 General Objectives Adipose Derived Stem Cells part: Elucidate the expression pattern of circadian core genes and pluripotency genes in adipose derived stem cells with Serum Shock and Vitamin D entrainment Breast Cancer part: Identify differences in rhythmicity protein patterns at MCF-7 and MDA-MB-231 cell lines 3.3.2 Specific Objectives Adipose Derived Stem Cells part: •. Make a standard entrainment and a Vitamin D entrainment procedure in fresh adipose derived stem cells. •. Get the expression pattern of circadian core and pluripotency genes through qPCR. •. Analyze the data to identify rhythmicity in entrained cells. •. Analyze the data to identify differences in Vitamin D treatment and Serum Shock entrainment. Breast Cancer part: •. Make a standard entrainment procedure at MCF-7 and MDA-MB-231 cell lines. •. Run 2D gels for protein identification. •. Identify protein patterns along time. •. Analyze the protein data to distinguish proteins that behave with rhythmicity. •. Comparison of both datasets. 15.
(28) 3.4 Justification Adipose Derived Stem Cells part: There is no clear pathway for Vitamin D in pluripotency nor circadian synchronization. Getting a better understanding of the role and action of Vitamin D would guide into better clinical trials with the use of stem cells. In the other hand, if there is no difference with the serum shock control, a stronger relation between circadian regulation and the process of differentiation may be formulated. In summary, the purpose of strengthening the mechanism knowledge and its relationship with stem cells may be achieved with the problem proposed in this thesis. Breast Cancer part: Parting from the fact that there is not a clear understanding of the circadian nor rhythmic mechanisms of MCF-7 or MDA-MB-231 is not yet elucidated, this thesis pretend to amplify the protein profile of both cell lines. The analysis of the two groups along the time may elucidate a better comprehension in the behavior of different protein fluctuations, leading into a differential recognition of proteins. At the end, the highlighted proteins might serve as potential biomarkers, given the fact that some preliminary studies show that people respond in different ways due to the time of the day the chemotherapy is supplied.. 16.
(29) 4. Materials and Methods 4.1 Adipose Derived Stem Cell Genetic Assessment 4.1.1 Cell Culture Adipose Derived Stem Cells were isolated and cultured as reported in (Cuevas-Diaz Duran et al., 2013). Upon informed consent, a female patient, 35 years old, undergoing cosmetic liposuction at NeoMedics ® (Monterrey, Nuevo León, Mexico) had sample taken from her lower back. This procedure was performed, and cells were donated at passage number 0, gently by the master’s student Mayela Giacoman. Afterwards cells were maintained at standard conditions for primary stem cell culture. The plate for passage number 0 was supplied with DMEM-F12 (1:1) with L-Glutamine at 2.428 g/L of Sodium Bicarbonate (Gibco, Life Technologies), supplemented with 10% Fetal Bovine Serum (FBS) (Gibco, Life Technologies) and 1% of antibiotic-antimycotic reagent (Gibco, Life Technologies). Flasks were washed with 1X phosphate buffered saline (PBS, Gibco, Life Technologies), previously sterilized, and media was changed completely every 3 days. Cells were incubated at 37°C and 5.0% CO2 in humidified incubators. Maintenance medium consisted on DMEM-F12 supplemented with 10% FBS, and 1% antibioticantimycotic reagent. Whenever cells reached 70 to 80 % confluence, they were expanded into sterile flask until enough cells were gotten. Provider protocol for detachment was performed, with 0.25% Gibco® Trypsin-EDTA (Life Technologies), centrifuged at 375 x g for 10 minutes. Trypsin-EDTA was inactivated with maintenance medium with 10% FBS. The entrainment was prepared for three experimental conditions at the same experimental size. After a regular trypsinization, cell pellet was resuspended with same maintenance medium. Cells were quantified and plated on 6-well plate at a density of 25 to 30, 000 cells per well. 4.1.2 Entrainment After cells were prepared for the entrainment, cells were maintained in standard conditions and monitored daily until 70-80% confluence. To induce circadian rhythms in cultured ADSCs, Serum Shock procedure was performed, as described previously (Balsalobre et al., 1998). Cells were starved overnight with serum-free DMEM-F12. Media was retired and 17.
(30) cells were washed with 1x PBS with gently moves. By this point, three experimental conditions are considered: 1) DMEM-F12 with 50% FBS was then supplemented and incubated for 2 hours. After the incubation time, another PBS wash was performed and resupplied with serumfree DMEM-F12. This is the serum shock group 2) Serum-free DMEM-F12, 100 nM 1α,25-dihydroxyvitamin D3 (1α,25-(OH)2D3) (D1530, Sigma-Aldrich) was supplemented, and incubated for 2 hours. After the incubation time, another PBS wash was performed and resupplied with serum-free DMEM-F12, 100 nM 1α,25-dihydroxyvitamin D3 (1α,25-(OH)2D3). This is the vitamin D experimental group. 3) Serum-free DMEM-F12 was then supplemented and incubated for 2 hours. After the incubation time, another PBS wash performed and resupplied with serum-free DMEM-F12. This is the control group Every 4-h after each treatment, starting right after the 2-hour incubation mentioned before, cells were harvested, and RNA isolated for 72 hours.. 4.1.3 RNA isolation from samples Total RNA was extracted from ADSCs by using TRI Reagent® (Sigma Aldrich). Total RNA was isolated following the manufacturer’s protocol. Cell lysis was performed directly on the culture 6-well plates by adding 600 μL of TRI Reagent ®. Every two wells were considerate a biological triplicate. Each sample was homogenized gently and frozen at -70°C until it was processed for RNA extraction process. When processed, samples were thawed in ice and stand at room temperature for 5 minutes. Samples were mixed with 60 μL of bromo-chloro-propane (Sigma Aldrich) and centrifugated at 12,000 x g for 15 minutes at 4°C, which produced three fractionation phases separated into aqueous, inter and organic phases. RNA was separated from the aqueous phase by pipetting and placed in a new 1.7 mL centrifuge tube. 300 μL of isopropanol and 5 μL of Glycogen from Mytilus edulis (Sigma Aldrich) were added and centrifugated the samples at 12,000 x g for 15 minutes at 4°C. Precipitated RNA was washed with 75% ethanol and 18.
(31) centrifugated again at 12,000 x g for 10 minutes at 4°C. Afterwards, ethanol was discarded carefully and samples were air dried. Pellet was finally dissolved in 50 μL nuclease-free water. RNA was incubated at 60°C for 5 minutes to completely dissolve the pellet. The RNA concentration and purity were determined by spectrophotometry using NanoDrop One® (Thermo Fisher).. 4.1.4 Expression analysis of circadian and pluripotency genes by qPCR RNA samples were reverse transcribed into cDNA using High Capacity cDNA Reverse Transcription Kit (Applied Biosystems) according to the manufacturer instructions. A total of 1,000 ng of RNA were reverse transcribed into cDNA using random primers. qPCR analysis was performed using the PowerUp™ SYBR™ Green Master Mix (Applied Biosystems). The cDNA equivalent to 50 ng of input RNA was analyzed. qPCR was performed using the manufacturer’s procedure. Applied Biosystems® StepOne System (Life Technologies) thermocycler was used and programmed as follows: 50°C for 2 minutes, 95°C for 2 more minutes, followed by 40 to 50 cycles of 95°C for 15 seconds, 58°C for 15 seconds and 72°C for a minute. Relative quantification of target genes transcripts in comparison to the reference gene transcript, and to time zero, was calculated using the method described in “A new mathematical model for relative quantification in real-time RT-PCR” (Pfaffl, 2001). Primer sequences were previously blasted to assess mRNA binding only. qPCR efficiencies were determined for the interested genes and shown in Appendix A.. 4.2 Breast Cancer Protein Profiling 4.2.1 Cell Culture MCF-7 Breast cancer cell line was purchased from the American Type Culture Collection (ATCC®, Rockville, MD, USA): MCF-7 (ATCC® HTB22™). MDA-MB-231 cell line was kindly donated by Dr. Nadia Jacobo Herrera from Instituto Nacional de Ciencias Médicas y Nutrición “Salvador Zubirán” in México City. Cells were grown in 25cm2 and 75cm2 culture flasks and then moved into 55cm2 petri dishes (Corning Inc., Corning, NY, USA) in a volume of 5 mL, 12 mL and 10 mL culture medium, respectively. Cells were maintained in their 19.
(32) respective cell culture container until they reached an 85% confluence and split at a ratio of 1:4 and followed by 1:15 split into petri dishes. All cell cultures were grown under aseptic conditions in an incubator at 37°C with 5% CO2. 4.2.2 Entrainment Breast cancer cells were cultured in petri dishes in their corresponding culture medium until 90% confluence. The culture medium was removed and then washed with 1X phosphate buffered saline (PBS, Gibco, Life Technologies). After the wash, cells were starved for 12 hours with the corresponding basal medium. For both cell lines MDA-MB-231 and MCF-7, basal medium was DMEM-F12 (Gibco, Life Technologies). Afterward starvation, culture basal medium was removed, and cells were serum shocked with their respective growth basal medium supplemented with 50% Fetal Bovine Serum (FBS, Gibco, Life Technologies) and immediately incubated for 2 hours at 37°C with 5% CO2. Then, growth basal medium supplemented with 50% Fetal Bovine Serum was removed and cells were washed with 1X PBS, added new basal medium and placed in the incubator under same conditions. 4.2.3 Protein Extraction and Sample Standardization Sample were taken out from the 70°C fridge and thawed in ice for about 3 hours giving thermal shocks every 30 minutes with hands. After that, samples were centrifugated at 14,000 x g, at 4°C, 10 minutes; samples were moved to an Eppendorf concentrator at 30°C until they reached a final volume of ~250 μL. Later 1 mL of acetone 100% was added to each microtube sample and moved to a fridge at -20°C overnight. The next day, a 10 minutes centrifugation was performed at 14,000 x g and 4°C and to form a pellet. Succeeding the centrifugation, 1mL of acetone 80% was added to each microtube sample and followed by a final centrifugation. Once all protein pellets were collected, rehydration buffer combined with protease inhibitor [1X] was added and protein samples were stored in a fridge at -70°C. Protein samples obtained from the protein concentration procedure were quantified by a spectrophotometer. Dilutions 1:20 were made in order to work with the Quick StartTM Bovine Gamma Globulin (BGG) Standard Set and a protein assay standard curve was created. Finally, protein concentration was determined by using Quick StartTM Bradford 1X Dye Reagent and read in a spectrophotometer.. 20.
(33) 4.2.4 2D Electrophoresis The first-dimension separation was done by isoelectrofocusing (IEF), in which proteins were separated electrophoretically based on their pI; the second-dimension separation step is SDS-PAGE, where proteins already separated by their pI were further separated by their molecular weight. The 2D gels were read in a photo-document device and gels were stored in bi-distilled water at 4°C 4.2.3 Normalization Normalization was performed taking in count beta actin as a constitutive protein. All the 2D gels were matched together with PDQuest software and spots (proteins) were identified in each 2D gels per timepoint. A software selection was performed afterwards to choose which spots were correctly identified and which ones were not real spots. 4.2.4 Analysis The oscillation determination was performed using the MetaCycle integrated R package (Wu, Anafi, Hughes, Kornacker, & Hogenesch, 2016). This mathematical algorithm fits large scale with the incorporation of ARSER, JTK_CYCLE and Lomb-Scargle to conventionally evaluate periodicity in time-series data. The intensity data retrieved from the PDQuest software along time shows protein behavior along time with periodicity around 24 hours. These proteins are potential candidates. At this step, both cell lines expression was compared to show the behavior in similar proteins.. 21.
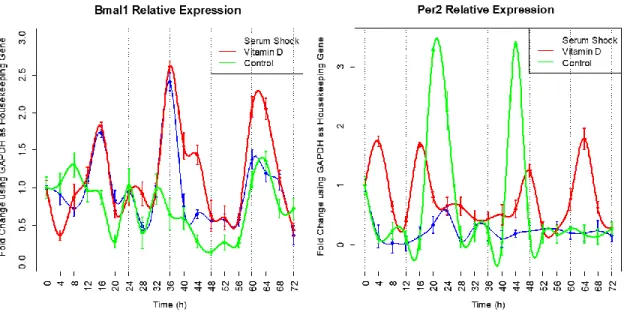
(34) 5. Results and Discussion 5.1 Adipose Derived Stem Cell Genetic Expression Assessment After the qPCRs the whole data was processed to analyze the circadian behavior of the three experimental conditions. In the past, the group have demonstrated that 1α,25dihydroxyvitamin D3 may induce the circadian rhythm transcription machinery as serum shock does. The results presented in Fig. 2 show the assessment of Bmal1 and Per2 in the three experimental conditions proposed previously.. Figure 2. Temporal expression profile of Bmal1 and Per2 in synchronized ADSCs The expression of Bmal1 gene in serum shocked ADSCs (blue), ADSCs under constant presence of 1α,25dihydroxyvitamin D3 (red) and control experimental condition (green), was measured by qPCR. Samples were collected every 4 hours for 72 hours. Data points (means of biological triplicates ± standard error) were normalized using Gapdh as internal control gene and to the first time point (t = 0 h). Fold change expression is shown.. The expression of Bmal1 in both experimental conditions confirmed that the synchronization was achieved. In contrast with previous experiments in the group, three complete phases of fold change of the gene expression were achieved, along the 72 hours. Even though, there was no evidence of Per2 oscillation in any of the experimental conditions. This contrasts with previous results were oscillations in serum shocked and 1α,25dihydroxyvitamin D3 treated cells were present. In the results shown in Fig. 2 there is an apparent oscillation pattern in Per2 expression at control condition, but data is not consistent enough to assure it. 22.
(35) PER2 and BMAL1 work systematically in opposition to each other. This means that their expression is autoregulated in a transcription-translation mechanism with feedback signaling. CLOCK-ARNTL (Bmal1) binds to E-box elements in the promoter region of transcriptional family Per and Cry; PER-CRY heterodimers inhibit CLOCK-ARNTL complex and the loop is complete (J. S. Takahashi et al., 2008). Therefore, the expression of Bmal1 and Per2 is supposed to behave in opposite ways. The results of three experimental conditions show no rhythmicity at all. To assess the behavior of the genes evaluated, the mRNA level was compared to the control experimental condition in the seek of absolute expression differences. Fig. 3 show the relative expression of the genes evaluated in this thesis in comparison with the control experimental condition. Analysis was performed at time-point 0 and 4 (0 and 12 hours). Twotailed student t-test was used to compare experimental groups with control.. Figure 3. Relative mRNA Levels Expression of Bmal1, Per2, Nanog, Oct4, Notch1 and Rex1 was compared between experimental conditions at the first time-point (t = 0 hours; A) and at the fourth time-point (t = 12 hours; B), using control condition as reference. Those marked with (*) are considered significant with a two-tailed student t-test of p < 0.05.. Different levels of expression showed that the behavior of the gene expression is underperforming compared to the control condition. This may be explained due to a cell response to the treatment which affects directly to the absolute expression comparison, but not to the behavior of each of the genes assessed. The underperforming expression of Per2 is relevant since the general behavior of it in previous experiments is not consistent with the 23.
(36) results. A probable explanation is the biological variance since the cell culture main source is human patients. It has been shown that ADSCs have heterogenous subpopulations with specific characteristics (Pérez-Silos, Camacho-Morales, & Fuentes-Mera, 2016). These specific features vary from patient to patient, because external factors such as patient age (Hamidouche et al., 2017), or even the isolation process, may interfere in the cell potential (Kitala et al., 2019). Therefore, further analysis and the use of a standardized cell line is suggested to figure out the differences at Per2 behavior.. Figure 4. Temporal expression profile of pluripotency genes The expression of Notch1(upper left), Rex1(upper right), Oct4 (bottom left), and Nanog (bottom right) gene was measured by qPCR. Samples were collected every 4 hours for 72 hours. Data points (means of biological triplicates ± standard error) were normalized using Gapdh as internal control gene and to the first time point (t = 0 h). Fold change expression is shown.. 24.
(37) Pluripotency genes evaluated were analyzed over the 72 hours too. Fig 4 show the behavior of four of the pluripotency genes’ expression patterns. Sox2 could not be evaluated since the expression intensity was below detection levels. Notch1 and Rex1 have a regular behavior in both experimental conditions, compared to the control pattern. Interestingly, Oct4 and Nanog had up and down regulation over time, in serum shocked and Vitamin D treated cells, compared to de control condition. Additionally, the data from the three experimental conditions was analyzed using MetaCycle (Wu et al., 2016). Results from the mathematical fitting are shown in Table 3. Meta2D analysis was used to predict the behavior of the different gene expression.. Table 3. MetaCycle Analysis for Circadian and Pluripotency genes Genes Serum Shock Bmal1 Per2 Nanog Oct_4 Notch1 Rex1 Vitamin D Bmal1 Per2 Nanog Oct_4 Notch1 Rex1 Control Bmal1 Per2 Nanog Oct_4 Notch1 Rex1. Period. Amplitude. Phase. p-value. 23.2569 27.9290 21.1717 22.5071 29.9117 23.2816. 0.4354 0.1415 0.5108 0.9307 0.2102 0.1418. 14.5182 27.0554 16.2420 16.0666 24.6780 17.4999. 0.00517607 ** 0.16458324 0.71752175 0.00018704 ** 0.08530299 0.52651032. 23.686 21.611 23.606 23.815 20.122 21.003. 0.6765 0.3342 0.7949 0.5299 0.4037 0.1130. 14.4114 21.5516 16.1740 17.4698 4.1512 17.3444. 0.00000369 ** 0.51353921 0.42881122 0.42937392 0.57720901 0.68572516. 26.887 24.974 28.667 27.333 23.337 27.597. 0.3166 0.7655 0.3677 0.4568 0.1353 0.0110. 7.7468 22.3418 0.5628 27.2611 2.0229 5.6776. 0.11392825 0.26909119 0.44336641 0.85871582 0.64186023 0.93173466. ** p-value <0.01. 25.
(38) MetaCycle analysis confirmed that Bmal1 in serum shocked cells and Vitamin D treated cells behaved in a circadian way. For a visual confirmation, the data retrieved from the MetaCycle prediction was graphed using the sinusoidal parameters as a model. Fig. 5 show the Bmal1 expression in serum shocked cells and Vitamin D treated cells in comparison with the predictive circadian model.. Figure 5. MetaCycle modeling and Bmal1 expression Bmal1 fold change pattern, in serum shocked (right) cells and Vitamin D (left) treated, is shown. Model retrieved from MetaCycle data is graphed for each condition to confirm the rhythmic behavior of Bmal1 in the experimental conditions.. Visually, the expression of Bmal1 in both experimental conditions is congruent over the lapse of 72 hours and both graphs are at the same phase. The models fitting each of the expression patterns (dotted line in Fig 5) confirms that the expression pattern from serum shocked and Vitamin D treated cells are equivalent: a phase of 14.5128 for the first one and 14.4114 for the second one. An interesting outcome from the MetaCycle analysis is that over the lapse of 72 hours, two genes at serum shocked experimental condition appeared too if into the sinusoidal model. Notch1 from the serum shocked condition, with a p-value equal to 0.085302, showed a rhythmic behavior over time. But, Oct4, at the same experimental condition, almost perfectly fitted into the model, with a p-value equal to 0.000187. Results of the visual fitting are shown in Fig. 6.. 26.
(39) Figure 6. MetaCycle modeling in serum shocked cells and the expression of Notch1 and Oct4 genes Notch1 fold change pattern (left) and Oct4 fold change pattern (right) from serum shocked cells, is shown. Model retrieved from MetaCycle data is graphed for each gene to confirm the rhythmic behavior of both genes compared to the fitted model.. After the visual confirmation of the data from MetaCycle it may be inferred that the behavior of Notch1 in the serum shocked condition is downregulated due to its foldchange. Anyhow, the behavior of Oct4 expression is interesting. Finally, to visually identify the phases of these behaviors, in Fig. 7 it is shown the fitting model of the three hallmarked genes at serum shocked experimental condition.. 27.
(40) Figure 7. MetaCycle model comparison from serum shocked cells Bmal1, Oct4 and Notch1 models retrieved from the MetaCycle data analysis are shown. For the fold change along 72 hours, Gapdh was used as the reference gene.. Putted together, the fitting predictions of the MetaCycle analysis clearly show a diphase in the behavior of Notch1 expression. Three peaks every 24 hours approximately almost synchronized perfectly Oct4 and Bmal1 expression patterns. In contrast, Notch1 expression patter seem to be upregulated when other two are downregulated, such as Per2 feedback loop. Further research is needed to confirm that any of these genes might be involved in the loop signaling from circadian translational machinery. It is known that circadian rhythms are close related to the cell state maintenance and regulation. Anyhow, little is known about the direct action of this translational machinery in processes such as differentiation or pluripotency maintenance. Specifically about the Oct4 and its role in circadian regulation, there is no clear relationship, but the use of Oct4 presence as a pluripotency marker in rhythmic assessment (Reilly, Watkins, & Smithgall, 2011), or rhythmic comparison of Ca+ communication and the role of pluripotency (Streckfuss-bo et. 28.
(41) al., 2013). In the other hand, circadian rhythm mechanism at peripheral level is quite crucial in the transition of cell state. Now, it is known that rhythmicity is absent in most of the stemness like states (Lu et al., 2016). A possible explanation to the peculiar behavior of Oct4 under circadian pression might be evidence of a differentiation process and a possible response to the circadian machinery is present in the Oct4 genetic expression. Further investigation, again, is suggested to confirm this supposition.. 5.2 Breast Cancer Protein Profiling After the normalization through the PDQuest Software (Bio Rad) the data was sorted and filtered to reduce the size of data and eliminate the typical noise from the detection. Due to the nature of the data few steps were performed before to verify that the normalization was performed correctly. Fig 8 is a summary of the process of sorting and filtering for the three data bases. Appendix B show the behavior of each of the datasets after and after the normalization, sorting and filtering process. Normal distribution verification: Norm vs Raw Data Time point verification per spot (SSP). Filtering for quality spots. Normal Distribution verification. Data sorting using SSP as reference. MetaCycle. Figure 8. Flow chart for SSP analysis. Flow chart of the pre-processing data before analyzing it at MetaCycle. 29.
(42) After the pre-processing procedure the three data sets (MCF-7 horse serum shock, MCF-7 bovine serum shock, and MDA-MB-231 bovine serum shock) were analyzed with MetaCycle in the search of candidate proteins that oscillate. Top protein spots for each of the datasets are presented in Table 4, Table 5 and Table 6.. Table 4. MCF-7 Horse Serum shock MetaCycle summary Protein Spot. Period. Amplitude. Phase. p-value. SSP 5107. 20.2011. 1.0876. 1.2278. 1.51E-06. SSP 5909. 20.0201. 0.6707. 2.5643. 4.57E-05. SSP 0101. 23.8075. 0.1964. 9.0507. 0.000108796. SSP 7905. 25.2227. 0.7625. 24.9088. 0.000182846. SSP 3908. 23.5987. 0.8058. 0.4716. 0.000191935. SSP 7602. 27.2905. 0.7541. 0.4620. 0.002566015. SSP 8701. 24.5721. 0.8980. 3.2203. 0.005763467. SSP 8403. 23.4190. 0.6942. 2.4682. 0.006791562. SSP 8808. 20.2280. 0.6591. 8.2209. 0.01047601. SSP 1502. 22.8330. 0.6102. 6.3618. 0.012952434. SSP 3903. 30.3092. 0.7251. 26.7394. 0.013814144. SSP 3703. 25.4998. 0.6657. 1.0835. 0.015648656. SSP 2906. 22.7751. 0.6086. 0.2903. 0.01701845. SSP 4701. 23.2587. 0.4802. 4.2132. 0.017160641. SSP 2903. 23.3901. 1.0245. 3.8168. 0.01741373. SSP 8305. 24.9756. 0.2978. 10.8179. 0.017540798. SSP 7601. 25.6940. 0.6492. 0.6882. 0.017628224. SSP 0501. 26.9446. 0.6970. 25.3016. 0.023119147. SSP 2403. 20.3368. 0.8179. 5.9451. 0.024666216. SSP 1703. 22.8634. 0.7538. 5.1608. 0.030889338. MCF- 7 Horse Serum. 30.
(43) Table 5. MCF-7 Bovine Serum shock MetaCycle summary Protein Spot. Period. Amplitude. Phase. p-value. SSP 6421. 20.0201. 0.7385. 12.3164. 4.74E-05. SSP 4616. 30.0152. 0.6788. 7.9058. 5.37E-05. SSP 5310. 20.7259. 0.6416. 8.8706. 9.15E-05. SSP 7216. 21.3336. 0.4299. 5.7692. 0.000847002. SSP 5314. 21.3928. 0.5805. 10.9205. 0.000938204. SSP 3212. 27.0777. 0.6384. 7.8997. 0.001300128. SSP 3522. 20.0201. 0.2072. 13.0533. 0.001615318. SSP 5608. 29.4411. 0.3854. 8.1421. 0.00189599. SSP 3421. 22.4319. 0.6863. 14.8653. 0.003258053. SSP 4524. 26.8378. 0.6292. 11.5172. 0.004188305. SSP 7711. 21.4770. 0.4399. 6.9474. 0.00561622. SSP 3615. 30.2398. 0.6646. 16.4565. 0.007560631. SSP 3427. 22.1567. 0.5463. 8.5875. 0.007689272. SSP 5217. 20.5203. 0.6650. 11.4162. 0.008039358. SSP 4512. 28.1263. 0.7216. 20.3426. 0.0113318. SSP 3823. 23.0197. 0.6870. 22.6484. 0.011977823. SSP 3625. 24.4985. 0.6690. 9.1649. 0.015001786. SSP 5516. 24.5933. 0.2691. 14.7761. 0.016837009. SSP 6313. 24.7171. 0.5185. 9.5881. 0.02117116. SSP 3517. 23.2366. 0.5040. 15.5262. 0.022781185. SSP 2812. 26.2653. 0.2949. 6.0400. 0.023892727. SSP 2710. 25.9635. 0.3971. 6.8487. 0.02552069. SSP 7313. 24.5240. 0.3977. 9.9777. 0.027021838. SSP 2203. 22.1360. 0.6105. 9.4768. 0.03058505. SSP 6614. 26.8417. 0.2453. 6.4527. 0.031289933. SSP 2707. 25.9635. 0.3992. 6.6594. 0.031835847. SSP 7310. 25.9635. 0.4517. 6.7983. 0.032317867. SSP 6413. 22.8862. 0.6442. 9.5226. 0.035493633. SSP 3218. 22.7170. 0.6961. 9.0985. 0.03973542. SSP 7206. 26.8989. 0.2587. 6.3557. 0.04336258. SSP 7810. 22.7319. 0.5124. 6.2566. 0.045126236. SSP 5216. 20.8512. 0.4025. 6.5804. 0.047310978. SSP 6514. 20.1224. 0.7434. 15.3849. 0.047678535. SSP 7520. 20.9072. 0.4581. 9.5791. 0.049074087. MCF- 7 Horse Serum. 31.
(44) Table 6. MDA-MB-231 Bovine Serum shock MetaCycle summary Protein Spot. Period. Amplitude. Phase. p-value. 29.7188 25.7322 30.0376 27.1457 23.3728 23.3281 25.8629 30.4510 23.1901 28.0314 23.3929 28.3473 23.6984 22.0059 26.7240 21.2192 23.6524 23.6981 22.2234 23.9245 28.6667 29.9720 24.0885. 0.2948 0.4273 0.3767 0.2968 0.5571 0.3463 0.1942 0.5013 0.0073 0.4504 0.1126 0.1165 0.3009 0.4001 0.4019 0.3941 0.4398 0.4335 0.2712 0.1322 0.4942 0.7804 0.2016. 3.3707 7.4012 4.3010 5.5624 21.6508 8.4677 7.6370 30.0874 5.7060 3.3372 7.2823 18.0542 5.5722 6.1114 7.3766 1.0428 8.2057 5.4385 9.3698 5.6037 3.8303 20.3216 6.2156. 7.39E-05 0.00079464 0.00113905 0.00120312 0.00129896 0.00358181 0.00373961 0.00551032 0.00877217 0.00886811 0.01009913 0.01488225 0.01911452 0.02551899 0.02576313 0.02735602 0.0293903 0.03372048 0.03673767 0.03900279 0.04250636 0.04410076 0.04641826. MDA-MB-231 Bovine Serum SSP 4413 SSP 2515 SSP 6307 SSP 4309 SSP 5205 SSP 0117 SSP 5709 SSP 6415 SSP 3208 SSP 4610 SSP 2321 SSP 1711 SSP 3309 SSP 5519 SSP 2404 SSP 6416 SSP 2319 SSP 2615 SSP 5318 SSP 2101 SSP 4608 SSP 9109 SSP 4102. After the MetaCycle analysis spots that had a p-value < 0.05 for the Meta2D analysis were considered as candidates’ proteins. Then, proteins that had a period close to 24 hours were prioritized for the visual confirmation. After that, specific points that were retrieved from the analysis were lastly verified to have a complete representation over the time curse of the analysis, being that at least one spot of the duplicates is present and no more than 3 time points are missing. Fig. 9, 10 and 11 are the top five representative candidate proteins that showed up the features mentioned before.. 32.
(45) Figure 9. Representative SSPs from MCF-7 Horse Serum Shock Normalized mean intensity (duplicates) from 2D-gel readings are graphed for a time course of 48 hours. Five different proteins were chosed as representative visual aid.. 33.
Figure


+6


Documento similar
In low density cultures, spheres are clonally derived colonies that are composed of a minority of stem cells and a majority of progenitor cells, the founding cell of the colony being
SECTION 3 - The role of RINGO proteins in the brain 123 RingoA mRNA is expressed in neural stem cells and proliferating progenitor cells 123 Analysis of neural stem cells
human mesenchymal stem cells from bone marrow and adipose tissue under xeno-free conditions for cell therapy. Stem Cell
Using unperturbed neural stem cells (NSCs) derived from a murine conditional model of loss-of-function of RING1B, we unveil roles of RING1B in cell proliferation,
According to current regulatory issues at the time (2002), our team started a clinical trial process in order to test the ability of adipose-derived stem cells (ASC) to
Human cancer cells show predominant expression of NANOGP8, whereas pluripotent cells (embryonic stem cells and embryonal carcinoma cells) express the NANOG variant
In humans, telomerase activity is restricted to embryonic development, embryonic stem (ES) cells, germ cells, adult stem cell compartments, certain types of Figure 3:
The regulation of more than thousand vitamin D target genes in colon carcinoma cells, normal stem cells, cancer stem cells, stromal NFs and CAFs as well as immune cells of the
