Introduction
In 2010 Spain produced approximately 3.4 million tons of pork, being the second and fourth EU (Eurostat, 2010) and world (Faostat, 2010) producer respectively. Pig production accounted for approximately 35.2% of the final livestock production and 11.4% of the final agricultural production. Catalonia is the main produ-cing region accounting for 27.5% of the total pig pro-duction in Spain followed by Aragón (21.8%) and Castilla y León (8.8%) (MAGRAMA, 2012). According
to SIP Consultors (2011), the growing-finishing (GF) period is the most expensive component of pig pro-duction and accounts for approximately 69% the costs in Spanish pork production. Some of the main factors affecting productivity of GF pigs are genetics, commer-cial type of pig produced, feed and feeding manage-ment, facilities (especially barn conditions) and health status (Losinger, 1998; Maes et al., 2004; Oliveira et al., 2009). Several papers have quantified the effect of these factors on performance, especially concerning genetics, commercial type, feeding management (Gispert
Descriptive study of production factors affecting performance traits
in growing-finishing pigs in Spain
P. S. Agostini
1*, J. Gasa
1, E. G. Manzanilla
1, C. A. Da Silva
2and C. de Blas
31 Grup de Nutrició, Maneig i Benestar. Department de Ciència Animal i dels Aliments.
Universitat Autònoma de Barcelona. 08193 Bellatera, Spain
2 Departamento de Zootecnia. Centro de Ciências Agrárias. Universidade Estadual de Londrina.
Londrina 86081-990. Brazil
3 Departamento de Producción Animal. Escuela Técnica de Ingenieros Agrónomos.
Universidad Politécnica de Madrid. 28040 Madrid, Spain
Abstract
The objective of this study was to build up a data set including productive performance and production factors data of growing-finishing (GF) pigs in Spain in order to perform a representative and reliable description of the traits of Spanish growing-finishing pig industry. Data from 764 batches from 452 farms belonging to nine companies (1,157,212 pigs) were collected between 2008 and 2010 through a survey including five parts: general, facilities, feeding, health status and performance. Most studied farms had only GF pigs on their facilities (94.7%), produced “industrial” pigs (86.7%), had entire male and female (59.5%) and Pietrain-sired pigs (70.0%), housed between 13-20 pigs per pen (87.2%), had ≥50% of slatted floor (70%), single-space dry feeder (54.0%), nipple drinker (88.7%) and automatic ventilation systems (71.2%). A 75.0% of the farms used three feeding phases using mainly pelleted diets (91.0%), 61.3% performed three or more antibiotic treatments and 36.5% obtained water from the public supply. Continuous variables studied had the following average values: number of pigs placed per batch, 1,515 pigs; initial and final body weight, 19.0 and 108 kg; length of GF period, 136 days; culling rate, 1.4%; barn occupation, 99.7%; feed intake per pig and fattening cycle, 244 kg; daily gain, 0.657 kg; feed conversion ratio, 2.77 kg kg–1and mortality rate, 4.3%. Data
reflecting the practical situation of the Spanish growing and finishing pig production and it may contribute to develop new strategies in order to improve the productive and economic efficiency of GF pig units.
Additional key words: facilities; feeding; production indexes; Spanish pig production.
* Corresponding author: [email protected] Received: 19-04-12. Accepted: 08-04-13.
Abbreviations used: ADG (average daily gain); ADURFAT (average duration of the fattening period); BO (barn occupation); CR (culling rate); FBW (final body weight); FCR (feed conversion ratio); GF (growing-finishing); IBW (initial body weight); MORT (mortality rate); NPP (number of pigs placed); TDURFAT (total duration of the fattening period); TFI (total feed intake).
et al., 2007; Niemi et al., 2010) and health status (Martínez et al., 2009). However, there is less research on the effects of facilities and general management on GF pig productivity in commercial conditions. In Spain, Oliveira et al.(2009) studied the effect of several fac-tors on mortality and feed intake in GF farms from one integration company located in Galicia. However, using data from only one company which is located in a region with a limited pig inventory may limit the applicability of these results.
Thus, the objective of this study was to create a data-set of GF pig farms from several companies in Spain in order to have representative information of the present characteristics of the Spanish GF pig industry. Furthermore, the relationships among performance indexes and production factors were also described in a bivariate analysis.
Material and methods
Data collection
Data were collected between July 2008 and July 2010 from a total of 452 GF farms [see questionnaire in Suppl. Table 1 (pdf)]. Recruited farms were integra-ted in nine out of the twenty five biggest pig companies in Spain, accounting for about 20% of the national GF pig production. Most of the farms were located in three Spanish regions, Aragón (44%), Cataluña (35%) and Castilla y León (18%), while a small group (3%) was located in other regions: Navarra, La Rioja and Valen-cia. One to three batches of animals per farm were included in the database adding up to a total of 764 batches. Batch was def ined as a group of pigs from around 15-27 kg that entered a GF unit and was raised until they reached a suitable weight for slaughter. A total of 1,157,212 pigs, accounting for about 1.5% of the total number of pigs slaughtered in Spain during the two-year period, were used to evaluate the varia-bility of both production factors and productive perfor-mance. Production factors were registered at farm level and productive performance was recorded at batch level.
All variables to be registered were selected after an extensive literature review. All variables had been proven to be variation factors in the final output of GF pig farms. On farm, data were collected through a sur-vey model prepared by the research team in agreement with field veterinarians and pig companies participating
in the study. The survey was divided in five sections as indicated in Table 1; four of these sections were related to production factors and one was related to productive performance.
Regarding productive performance records, also included in Table 1, number of pigs placed (NPP) corresponded to the number of pigs which entered the unit in each batch. Averages initial and f inal body weight (IBW and FBW, kg pig–1) were defined as the
total batch weight divided by the number of pigs in each batch when entering the GF unit and prior to transportation to the slaughter facility respectively. Total feed intake (TFI, kg pig–1) was calculated from
the total feed delivered to each batch minus the amount of feed remaining in the silos when each batch was slaughtered, divided by the number of marketed pigs. Average daily gain (ADG) was calculated the as the difference between IBW and FBW divided by the number of days between these measures. Feed conver-sion ratio (FCR, kg kg–1) was obtained dividing the
total feed delivered to each batch (kg) by the difference between the total kilograms of pigs sent to slaughter and the total kilograms of pigs that entered at the GF batch. The “total duration of GF” (TDURFAT, days) is calculated as the number of days elapsed between the entrance of the first group of pigs in the GF unit and the exit of the last group of pigs sent to the slaughter-house. In contrast, the “average duration of GF” (ADURFAT, days) is calculated as the average number of days between the entrance in the GF unit and the exit to slaughter for different groups of pigs sent to the slaughterhouse, respectively. Culling rate (CR) repre-sented the percentage of animals having market value lower than 100%. Causes for this devaluation may be: batch weight far from the average body weight, pre-vious disease, poor conformation, etc. The percentage of barn occupation (BO) was calculated as the number of pigs in the barn divided by the total pig places in the barn multiplied by 100. Finally, mortality rate (MORT) was calculated as the difference between the number of growing pigs entering into the fattening house and the number of pigs sent to the slaughterhouse divided by the number of pigs that entered the GF unit multi-plied by 100.
Data analysis
Des-criptive analysis of classification variables was perfor-med through frequency study using Proc Freq of SAS (SAS Inst., Inc., Cary, NC, USA, version 9.2) for varia-bles included in the group general information,
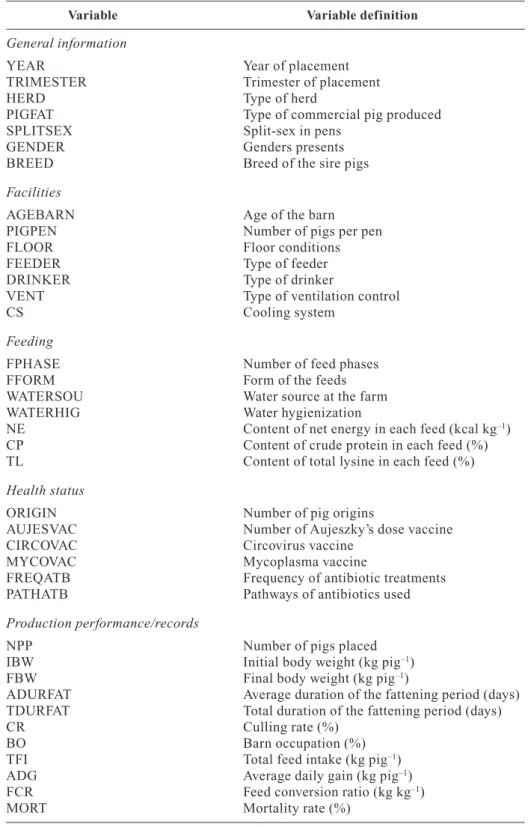
facili-ties and feeding in Table 1. Farm was the experimental unit for all these variables. Descriptive analysis of continuous variables was performed through measures of central tendency (mean and median) and dispersion Table 1.Description of the variables recorded
Variable Variable definition
General information
YEAR Year of placement TRIMESTER Trimester of placement
HERD Type of herd
PIGFAT Type of commercial pig produced SPLITSEX Split-sex in pens
GENDER Genders presents BREED Breed of the sire pigs
Facilities
AGEBARN Age of the barn PIGPEN Number of pigs per pen FLOOR Floor conditions FEEDER Type of feeder DRINKER Type of drinker
VENT Type of ventilation control
CS Cooling system
Feeding
FPHASE Number of feed phases FFORM Form of the feeds WATERSOU Water source at the farm WATERHIG Water hygienization
NE Content of net energy in each feed (kcal kg–1)
CP Content of crude protein in each feed (%) TL Content of total lysine in each feed (%)
Health status
ORIGIN Number of pig origins
AUJESVAC Number of Aujeszky’s dose vaccine CIRCOVAC Circovirus vaccine
MYCOVAC Mycoplasma vaccine
FREQATB Frequency of antibiotic treatments PATHATB Pathways of antibiotics used
Production performance/records
NPP Number of pigs placed IBW Initial body weight (kg pig–1)
FBW Final body weight (kg pig–1)
ADURFAT Average duration of the fattening period (days) TDURFAT Total duration of the fattening period (days)
CR Culling rate (%)
BO Barn occupation (%)
TFI Total feed intake (kg pig–1)
ADG Average daily gain (kg pig–1)
FCR Feed conversion ratio (kg kg–1)
(standard deviation, quartiles and range). For conti-nuous variables (productive performance) batch was the experimental unit. Bivariate analysis of continuous variables was done by Pearson correlation analysis using Proc Univariate, and Proc Corr of SAS. Bivariate analysis of continuous variables AFI, ADG, TDURFAT, FCR and MORT depending on classification variables and was done by using Proc Mixed of SAS with com-pany as random effect and batch as experimental unit. Only company was considered as a random effect be-cause many farms contributed to the study with only one batch of pigs, thus the random effect of farm could not be studied.
Results and discussion
Results of categorical variables describing the farms are presented in Table 2. This study included informa-tion mainly about GF farms (94.7%) including pig batches distributed during all trimesters of 2008 and 2009. According to the MAGRAMA (2011), 11% of the pig farms in Spain were classif ied as farrow-to-finish farms. Thus a low proportion of this type of farms was expected. Concerning farm size, the median value of NPP was 1,217 with values ranging between 233 and 6,198 pigs per batch and 80% of the farms having between 500 and 2,500 pigs per batch (Fig. 1). In Spain, it has been observed a concentration of pig producers in the last years with a decrease in the total number of GF farms and an increase in the number of pigs per farm.
The type of animal produced in each farm depends on the final objective of the producer. Spain is the world leader in production of dry-cured hams and for this purpose high final weight pigs are needed (Resano et
al., 2007). Thus, most farms (86.7%) produced “indus-trial pigs” (95-110 kg at slaughtering) and 13.3% produced “heavy fat pigs” (< 110 kg). The type of pig produced is also closely related to the gender and breed of the animals used. Gender segregation in pens (49.8%), use of entire males (59.5%) and Pietrain-sire pigs (70.0%) are used to produce “light” or “industrial” pigs while mixed-sex pens, presence of barrows and White (Landrace, Large White or their commercial crossings; 19.6%) and/or Duroc-sire pigs (7.8%) are combi-nations used to produce “industrial” or “heavy” pigs. Concerning “facilities”, information about age of farms in Spain is scarce in the literature and in many cases pig farms owners do not know the real age of their farms. In the present study, 38.5% of the farms did not have reliable information about age, approxi-mately 42% of the farms were between ten and thirty years old and only 8.2% reported to be older than 30 years. Presumably, many farms not able to report age were more than thirty years old. Most farms had pens with capacity for 13 to 20 pigs (87%), with ≥50% of concrete slated floor (70%) and nipple drinker (89%). However, a higher heterogeneity was found in feeder type with 54% of farms having a “single-space” dry feeder, 20.6% having this feeder with an incorporated drinker and 24.3% having a “multi-space” conventio-nal dry feeder. Pen size has been increased in recently built GF farms due to better outputs (Penny, 2000) but a low percentage (1.1%) of pens containing more than 20 pigs was found. Both “number of pigs per pen” and “percentage of slatted floor” are important for other factors such as the temperature, density of animals, ventilation control or number of feeders and drinkers. In the last years, there was an increase in single-space feeders with an incorporated drinker in GF pig farms because they had been associated to better feed intake. In fact, multi-space feeders were normally found in older farms. Concerning environmental control, most farms (71%) had “automatic” ventilation but only 10.3% of farms had cooling systems available. In Spain, the use of automatic ventilation control and cooling sys-tems in pig farms could be justified due the high tem-peratures observed between May and September.
Concerning feeding programs, most farms used three (75%) or four (24.3%) feeding phases based on pig age or weight depending on the company and almost all farms used pelleted feeds (91%). Liquid feed has been implanted in some GF farms in recent years but none of them were included in the database. Feeding programs included in this study follow FEDNA (2006)
Figure 1.Distribution of the number of pigs placed per batch
(764 batches).
Number of pig placed
0-500
501-1,0001,001-1,5001,501-2,0002,001-2,5002,501-3,0003,001-3,5003,501-4,0004,001-4,5004,501-5,0005,001-5,5005,501-6,0006,001-6,500> 6,501
% of ba
tches
30
25
20
15
10
5
recommendations to some extent but they are difficult to compare because the time for each feeding phase is very different among farms. Regarding the source of drinking water, 36.5% of farms used public tap water, in approximately 23% water came from a private well, 17.7% used water from a river and 8.5% from other sources. Moreover, 56% of farms treated the drinking
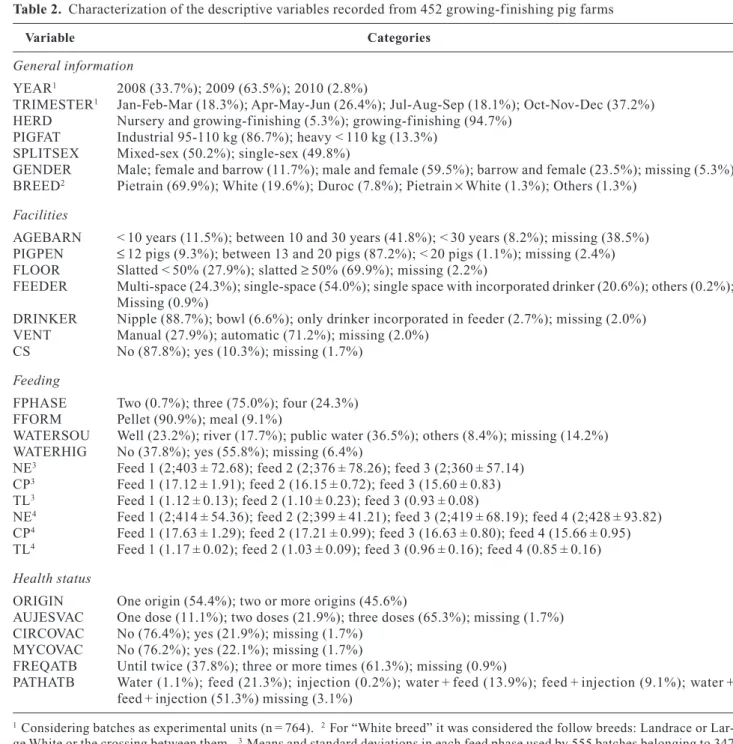
water on farm, in coincidence with those farms which did not use public tap water. This variable indicates indi-rectly the water quality used by pig farms and it could in-fluence productive performance (Nyachoti et al., 2005). Regarding health status, the number of pig origins in each batch is a very important factor affecting health in GF farms (Maes et al., 2000, 2004). In this sense, Table 2. Characterization of the descriptive variables recorded from 452 growing-finishing pig farms
Variable Categories
General information
YEAR1 2008 (33.7%); 2009 (63.5%); 2010 (2.8%)
TRIMESTER1 Jan-Feb-Mar (18.3%); Apr-May-Jun (26.4%); Jul-Aug-Sep (18.1%); Oct-Nov-Dec (37.2%)
HERD Nursery and growing-finishing (5.3%); growing-finishing (94.7%) PIGFAT Industrial 95-110 kg (86.7%); heavy < 110 kg (13.3%)
SPLITSEX Mixed-sex (50.2%); single-sex (49.8%)
GENDER Male; female and barrow (11.7%); male and female (59.5%); barrow and female (23.5%); missing (5.3%) BREED2 Pietrain (69.9%); White (19.6%); Duroc (7.8%); Pietrain×White (1.3%); Others (1.3%)
Facilities
AGEBARN < 10 years (11.5%); between 10 and 30 years (41.8%); < 30 years (8.2%); missing (38.5%) PIGPEN ≤12 pigs (9.3%); between 13 and 20 pigs (87.2%); < 20 pigs (1.1%); missing (2.4%) FLOOR Slatted < 50% (27.9%); slatted ≥50% (69.9%); missing (2.2%)
FEEDER Multi-space (24.3%); single-space (54.0%); single space with incorporated drinker (20.6%); others (0.2%); Missing (0.9%)
DRINKER Nipple (88.7%); bowl (6.6%); only drinker incorporated in feeder (2.7%); missing (2.0%) VENT Manual (27.9%); automatic (71.2%); missing (2.0%)
CS No (87.8%); yes (10.3%); missing (1.7%)
Feeding
FPHASE Two (0.7%); three (75.0%); four (24.3%) FFORM Pellet (90.9%); meal (9.1%)
WATERSOU Well (23.2%); river (17.7%); public water (36.5%); others (8.4%); missing (14.2%) WATERHIG No (37.8%); yes (55.8%); missing (6.4%)
NE3 Feed 1 (2;403 ± 72.68); feed 2 (2;376 ± 78.26); feed 3 (2;360 ± 57.14)
CP3 Feed 1 (17.12 ± 1.91); feed 2 (16.15 ± 0.72); feed 3 (15.60 ± 0.83)
TL3 Feed 1 (1.12 ± 0.13); feed 2 (1.10 ± 0.23); feed 3 (0.93 ± 0.08)
NE4 Feed 1 (2;414 ± 54.36); feed 2 (2;399 ± 41.21); feed 3 (2;419 ± 68.19); feed 4 (2;428 ± 93.82)
CP4 Feed 1 (17.63 ± 1.29); feed 2 (17.21 ± 0.99); feed 3 (16.63 ± 0.80); feed 4 (15.66 ± 0.95)
TL4 Feed 1 (1.17 ± 0.02); feed 2 (1.03 ± 0.09); feed 3 (0.96 ± 0.16); feed 4 (0.85 ± 0.16)
Health status
ORIGIN One origin (54.4%); two or more origins (45.6%)
AUJESVAC One dose (11.1%); two doses (21.9%); three doses (65.3%); missing (1.7%) CIRCOVAC No (76.4%); yes (21.9%); missing (1.7%)
MYCOVAC No (76.2%); yes (22.1%); missing (1.7%)
FREQATB Until twice (37.8%); three or more times (61.3%); missing (0.9%)
PATHATB Water (1.1%); feed (21.3%); injection (0.2%); water + feed (13.9%); feed + injection (9.1%); water + feed + injection (51.3%) missing (3.1%)
1Considering batches as experimental units (n = 764). 2For “White breed” it was considered the follow breeds: Landrace or
Lar-ge White or the crossing between them. 3Means and standard deviations in each feed phase used by 555 batches belonging to 347
herds that had three feed phases at growing-finishing period. 4Means and standard deviations in each feed phase used in 218
almost half of the farms (45.6%) received pigs from two or more origins. This fact may be reflecting the existence of small weaning farms not able to provide enough number of animals for a particular GF unit. All farms vaccinated their pigs against Aujeszky’s disease with proximately 11, 22 and 65% of farms vaccinated one, two and three dose, respectively. However, only around 22% of farms used circovirus and mycoplasma vaccine. Aujeszky’s disease vaccination is so widely used because this disease is under mandatory reporting in Spain where the eradication program started in 1995 and was adapted and reinforced in 2003 (BOE, 1995). Circovirus disease (PCV2) was firstly described in Spain in 1997 and the infection is present in almost 100% of Spanish pig farms (Sibila et al., 2004). However, commercial vaccine against PCV2 was recently deve-loped and it is starting to be used to minimize the effects of this disease in pig production. With respect to M. hyopneumoniae, it is the principal etiologic agent of porcine respiratory disease complex being present in pigs farms worldwide (Thacker, 2006). Vaccination is an important tool for its control enhancing perfor-mance by reducing prevalence and severity of lung lesions. However, vaccination is more often used in earlier phases and many animals may be already vacci-nated once they reach GF phase. As far as the frequen-cy of antibiotics treatment is concern, 61.3% of the
farms treated three or more times the animals with some kind of antibiotic while 37.8% treated less than three times. Over half of the farms (51.3%) combined the use of feed, water and injection to administer anti-biotics. This high use of antibiotics by different methods could be justified by the ban of the use of antibiotic growth promoter in the EU since 2006 causing an increase in both preventive and curative uses of antibio-tics (Wierup, 2001).
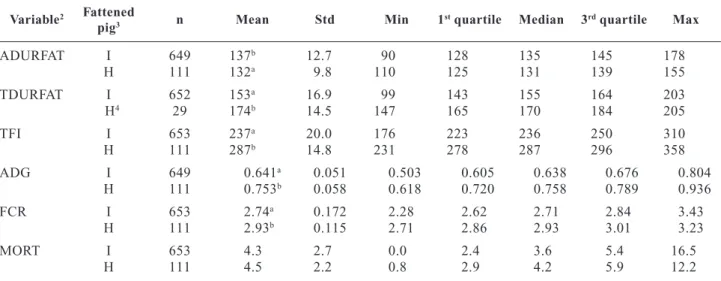
Results for continuous variables describing produc-tive performance were 19.0 ± 2.56 kg and 108.0 ± 6.20 kg for IBW and FBW, respectively, 136 ± 12 and 154 ± 17 days for ADURFAT and TDURFAT, respecti-vely, 1.4 ± 1.23% (range 0.0 to 8.0 %) for CR, 99.7 ± 1.36% for BO, 244 ± 26.1 kg and 0.657 ± 0.0650 kg for TFI and ADG, 2.77 ± 0.178 for FCR and 4.3 ± 2.64% (range 0.0 to 16.5%) for MORT. This results were similar to those published by the Observatori del Porcí (2012) assessing the main performance parameters in around 12,475,503 GF pigs from Spain during 2011 with average values of: 18.3 and 105.0 kg for IBW and FBW, respectively, 131.5 days for ADURFAT, 229.17 kg for TFI, 0.662 kg for ADG, 2.66 for FCR and finally 3.7% for MORT. Table 3 shows the values of these riables for both industrial and heavy pig farms. All va-lues were different between both types of pigs except for mortality. Heavy pigs had a 3.6% shorter ADURFAT
Table 3.Comparison of the main continuous variables registered between “industrial” (I) and “heavy” (H) fattening pigs through univariate statistical analysis1
Variable2 Fattened n Mean Std Min 1stquartile Median 3rdquartile Max
pig3
ADURFAT I 649 137b 12.7 90 128 135 145 178
H 111 132a 9.8 110 125 131 139 155
TDURFAT I 652 153a 16.9 99 143 155 164 203
H4 29 174b 14.5 147 165 170 184 205
TFI I 653 237a 20.0 176 223 236 250 310
H 111 287b 14.8 231 278 287 296 358
ADG I 649 0.641a 0.051 0.503 0.605 0.638 0.676 0.804
H 111 0.753b 0.058 0.618 0.720 0.758 0.789 0.936
FCR I 653 2.74a 0.172 2.28 2.62 2.71 2.84 3.43
H 111 2.93b 0.115 2.71 2.86 2.93 3.01 3.23
MORT I 653 4.3 2.7 0.0 2.4 3.6 5.4 16.5
H 111 4.5 2.2 0.8 2.9 4.2 5.9 12.2
1Means in the same column and variable superscripted with different letters were significant (p< 0.001). 2I (final body weight
ranged from 95 to 110 kg); H (final body weight higher than 110 kg). 3Variables: ADURFAT (average duration fattening period,
days); TDURFAT (total duration fattening period, days); TFI (total feed intake, kg pig–1); ADG (average daily gain, kg pig–1); FCR
(feed conversion ratio, kg kg–1); MORT (mortality rate, %). 4Missing values were due to a company which did not provide
and a 12% longer TDURFAT, and had higher TFI (17.4%), ADG (14.9%), and FCR (6.5%) than “indus-trial” pigs. Because of these differences between in-dustrial and heavy pigs, bivariate descriptive analysis results are presented in Tables 4 and 5 only for indus-trial pigs in order to avoid confounder effects.
Correlation analysis between continuous variables (Table 4) showed strong correlations (absolute values
≥0.60 and p< 0.01) among IBW-ADURFAT (–0.60), FBW-TFI (0.71), ADURFAT-ADG (–0.77), TDURFAT-ADG (–0.60) and TFI-FCR (0.70). Most of these corre-lations may be expected, such as the correlation bet-ween feed intake and the duration of the GF period or the fact that IBW, and not FBW, is correlated to ADURFAT. In the other hand, the weakest correlations (absolute values ≤0.05 and p< 0.05) were observed between IBW-MORT (0.01), FBW-TDURFAT (0.01), FBW-MORT (–0.03), BO-TFI (0.02), BO-ADG (–0.05) and TFI-ADG (0.01). These low correlations are mostly due to a narrow distribution of variables as FBW or BO. For IBW-MORT the result may be not expected since the initial weight of the animals ente-ring the GF unit does suppose a health challenge for the pigs (Larriestra et al., 2005).
Table 5 shows descriptive bivariate analysis of TFI, ADG, TDURFAT, FCR and MORT depending on classification factors. Pigs that grew during summer period (placed between April and June) presented (p< 0.01) lower values of TFI, ADG, FCR and MORT compared to those which grew in the winter period (placed between October and December). These results agree with the study published by Oliveira et al.(2009)
in Spain and Maes et al. (2004) in Belgium. Both studies obtained lower mortality rates in batches housed between May and August. According to Maes et al.(2004), barn windows are usually closed in cold periods in order to keep temperature leading to an accumulation of gases that can be harmful for the ani-mals due to poor ventilation. Furthermore, pigs may reduce feed intake in warm periods in order to reduce body heat production depending mainly on environ-mental conditions inside the barns and diet composi-tion. In our study, diet composition was not adjusted to environmental conditions and it may explain the TFI reduction. Concerning farm size, batches with less than 800 pigs presented (p< 0.01) higher ADG and lower TDURFAT and MORT with no changes in TFI. Maes et al.(2004) also found a lower mortality in batches containing less number of pigs (with farms ranging from 65 to 1288 pigs) and Oliveira et al.(2007) found better ADG in small batches (≤400 pigs vs.< 400 pigs) but Oliveira et al.(2009) registered no effect on MORT (< 400 pigs; 400-600 pigs; < 600 pigs). Small herds may allow performing an easier all in/all out manage-ment with animals from one origin improving health status.
As discussed above, split-sex pens, gender and breed of the sire pigs were only found as factors in particular combinations because they are not selected in an inde-pendent way. Thus, these three variables were combi-ned and presented as a single variable in Table 5 in order to avoid a confounding effect. Combinations “barrow and female + mixed-sex + White breeds” and “barrow and female + mixed-sex + Duroc breed” showed Table 4.Pearson correlation coefficients for all production performance recorded in batches from “industrial” growing-fi-nishing pigs1
Variables2 IBW FBW ADURFAT TDURFAT CR BO TFI ADG FCR MORT
IBW 1 — — — — — — — — —
FBW –0.06 1 — — — — — — — —
ADURFAT –0.60*** 0.27*** 1 — — — — — — —
TDURFAT –0.24*** 0.01 0.57*** 1 — — — — — — CR –0.11* –0.07 0.24*** 0.32*** 1 — — — — — BO –0.13*** 0.14*** 0.17*** –0.11*** –0.27*** 1 — — — — TFI –0.24*** 0.71*** 0.45*** 0.27*** 0.20*** 0.02 1 — — — ADG 0.30*** 0.33*** –0.77*** –0.60*** –0.30*** –0.05 0.01 1 — — FCR 0.21*** 0.14*** 0.12*** 0.28*** 0.34*** –0.16*** 0.70*** 0.14*** 1 — MORT 0.01 –0.03 0.13*** 0.41*** 0.39*** –0.16*** 0.29*** –0.18*** 0.53*** 1
1*** p< 0.01, ** p< 0.05. 2Variables: IBW (initial body weight, kg pig–1); FBW (final body weight, kg pig–1); ADURFAT
(ave-rage duration fattening period, days); TDURFAT (total duration fattening period, days); CR (culling rate, %); BO (barn occupa-tion, %); TFI (total feed intake, kg pig–1); ADG (average daily gain, kg pig–1); FCR (feed conversion ratio, kg kg–1); MORT
Table 5.Associations between predictor variables (production factors) and the main outcome variables (productive perfor-mance, mean ± SE) in batches from “industrial” growing-finishing pigs. Company was included as random effect and cate-gorical variables which were not significant (p< 0.10) for any variable are not shown1
Variable level n TFI ADG TDURFAT FCR MORT
Trimester of placement *** *** ** *** ***
Jan-Feb-Mar 109 233 ± 3.7b 0.634 ± 0.012b 152 ± 6.2a 2.75 ± 0.039ab 4.8 ± 0.57a
Apr-May-Jun 185 226 ± 3.6c 0.626 ± 0.011b 149 ± 6.1ab 2.70 ± 0.038b 3.5 ± 0.56b
Jul-Aug-Sep 111 243 ± 3.8a 0.659 ± 0.012a 151 ± 6.2ab 2.75 ± 0.039ab 4.4 ± 0.58a
Oct-Nov-Dec 248 240 ± 3.6a 0.660 ± 0.011a 148 ± 6.1b 2.78 ± 0.038a 4.8 ± 0.56a
Number of pigs placed *** *** ***
< 800 pigs 146 234 ± 3.5 0.656 ± 0.011a 141 ± 6.3c 2.73 ± 0.039 3.9 ± 0.56b
800-2,000 pigs 348 235 ± 3.3 0.643 ± 0.011b 152 ± 6.2b 2.75 ± 0.038 4.5 ± 0.54a
< 2,000 pigs 159 238 ± 3.5 0.636 ± 0.011b 156 ± 6.3a 2.77 ± 0.039 4.8 ± 0.56a
Gender/Split-sex/Breed2 *** *** ***
M, F, B + SS + P 100 246 ± 6.9ab 0.591 ± 0.027c 155 ± 20.9 2.70 ± 0.073bc 2.8 ± 1.44
M, F + SS + P 243 226 ± 4.9c 0.655 ± 0.020abc 154 ± 14.8 2.65 ± 0.052c 4.0 ± 1.02
M, F + MS + P 180 229 ± 3.4c 0.644 ± 0.013bc 149 ± 9.4 2.74 ± 0.035bc 4.6 ± 0.68
M, F + MS + W 24 241 ± 4.8b 0.664 ± 0.016ab 146 ± 9.8 2.87 ± 0.045ab 5.2 ± 0.83
B, F + MS + W 53 253 ± 4.1a 0.678 ± 0.014a 147 ± 9.6 2.92 ± 0.040a 4.8 ± 0.75
B, F + MS + D 24 242 ± 4.8b 0.674 ± 0.016a 143 ± 9.8 2.88 ± 0.046a 4.1 ± 0.83
Number of pigs per pen ***
≤12 pigs 76 236 ± 4.2 0.655 ± 0.012 145 ± 6.2 2.73 ± 0.043 3.9 ± 0.60 13-20 pigs 549 235 ± 3.4 0.644 ± 0.011 150 ± 5.9 2.75 ± 0.038 4.4 ± 0.51
Age of the building * *** *** *
< 10 years 84 233 ± 4.2b 0.640 ± 0.013b 150 ± 6.5a 2.73 ± 0.043 4.1 ± 0.63
10-30 years 298 235 ± 3.9ab 0.641 ± 0.012b 150 ± 6.4a 2.76 ± 0.040 4.6 ± 0.59
< 30 years 61 242 ± 4.5a 0.665 ± 0.013a 142 ± 6.6b 2.77 ± 0.045 4.0 ± 0.66
Floor *
< 50% slatted 220 237 ± 3.5 0.649 ± 0.011 149 ± 5.8 2.75 ± 0.038 4.4 ± 0.54
≥50% slatted 413 234 ± 3.5 0.641 ± 0.011 150 ± 5.8 2.74 ± 0.038 4.4 ± 0.54
Ventilation ** ** *
Manual 235 239 ± 3.4 0.641 ± 0.012 149 ± 5.9 2.78 ± 0.036 4.7 ± 0.53 Automatic 408 233 ± 3.2 0.648 ± 0.012 150 ± 5.9 2.72 ± 0.035 4.1 ± 0.50
Number of animal origins *** ** ***
One origin 386 234 ± 3.3 0.647 ± 0.011 148 ± 5.9 2.74 ± 0.034 4.0 ± 0.47 Two or more origins 267 237 ± 3.4 0.641 ± 0.012 153 ± 6.0 2.77 ± 0.035 5.1 ± 0.49
Circovirus vaccine *** *** *** ***
No 481 238 ± 3.8 0.649 ± 0.012 148 ± 6.5 2.76 ± 0.043 4.5 ± 0.67 Yes 157 219 ± 4.2 0.645 ± 0.013 143 ± 6.6 2.65 ± 0.046 2.3 ± 0.71
Frequency of antibiotics use *
Until twice 234 233 ± 4.1 0.643 ± 0.013 148 ± 6.1 2.72 ± 0.045 3.8 ± 0.56 Three or more times 410 238 ± 4.0 0.644 ± 0.012 150 ± 6.0 2.77 ± 0.044 4.9 ± 0.55
Pathways of antibiotic use * *** **
Feed 170 239 ± 4.9 0.658 ± 0.019 135 ± 6.9b 2.76 ± 0.051 3.3 ± 0.64b
Water + feed 123 235 ± 5.2 0.640 ± 0.019 146 ± 7.0a 2.73 ± 0.053 3.9 ± 0.68ab
Water + feed + injection 325 236 ± 5.5 0.632 ± 0.022 164 ± 7.9a 2.79 ± 0.058 5.7 ± 0.72a
Water source *** ***
Well 106 234 ± 4.4 0.645 ± 0.015 149 ± 6.1a 2.71 ± 0.045 3.5 ± 0.39b
River 109 235 ± 4.2 0.649 ± 0.015 147 ± 6.0a 2.73 ± 0.045 4.5 ± 0.37a
Public water 258 233 ± 3.7 0.652 ± 0.014 143 ± 5.9b 2.72 ± 0.042 3.7 ± 0.29b
Others 59 233 ± 4.5 0.662 ± 0.015 139 ± 6.1b 2.72 ± 0.046 3.4 ± 0.41b
1* p< 0.1; ** p< 0.05; *** p< 0.01. Levels from the variables that contained less than 10 batches were excluded of this table.
Me-ans in the same column and variable superscripted with different letters were significant (p≤0.05). 2Gender: M, F, B (male,
the highest TFI, ADG showing also the worst FCR. According to Wiseet al.(1996) productive efficiency depends on gender, age and body weight of pigs being barrows generally considered less efficient than fema-les which are fema-less efficient than entire mafema-les. Sex se-gregation in pens is also considered as a good method to improve eff iciency (Niemi et al.,2010). Finally Edwards et al.(2006) found that Duroc-sired pigs had a higher body weight, ADG and backfat thickness than Pietrain pigs, and it is known that Pietrain-sired pigs are more efficient than other breeds by expressing a higher lean tissue growth (Gispert et al., 1997). Thus combinations including mixed barrows and females with no Pietrain genetics were expected to be the least efficient ones.
Concerning facilities, pigs allocated in small pens (< 12 pigs) presented (p< 0.01) lower TDURFAT than those in pens containing between 13 and 20 pigs. Pu-blished studies relating the number of pigs per pen over performance considered a small pen with at most 20 pigs and a big pen with at least 50 pigs (Turner et al., 2000). These authors found higher body weight gain in small pens compared to big pens. Both categories used for pen size in the present study, pens with less than 13 pigs and those containing between 13 and 20 pigs, were considered “small” by those authors and maybe the lack of differences is just a lack of data range. A higher TFI (p= 0.06) and ADG (p< 0.01) and a lower TDURFAT (p< 0.01) was observed in older than in newer barns despite the large number of missing values registered for this variable (38.5%). Older barns used to be smaller and were associated to a greater degree of precariousness in building conditions and characte-ristics of facilities. However, improvements applied to facilities were not considered in the current studies. A better assessment of the age of facilities and its status should be included in future studies.
Pigs placed in pens with < 50% of slated floor tended to have a higher ADG (p= 0.08) compared to those containing ≥50%. Oliveira et al.(2009) and Averós et al.(2010) neither found any influence of the percentage of slated floor on TFI or MORT. Percentage of slated floor is related to health problems caused mainly by the ammonia concentration. Ye et al.(2009) observed lower ammonia concentration and better air quality in partial slat pens than those with total slat and Aarnink et al. (1997) stated that decreasing the percentage of slated floor from 50 to 25% reduced the ammonia level by 11%. Partial slat may also help pigs to better define specific areas for resting allowing them
to rest in a dry, solid floor (Hacker et al.,1994). A lower TFI (p= 0.02), FCR (p< 0.01) and MORT (p= 0.07) with no change in ADG or TDURFAT was observed in pigs placed in barns equipped with an automatic ventilation system compared to those with manual system. Results emphasize the importance of the ventilation system in pig’s thermal sensation, as improving thermal comfort increases performance (Choi et al., 2010). Moreover, according to Wathes (1994), ventilation system is the most efficient method to reduce the concentration of inside barn air pollutants.
were used more for curative purposes (Miller et al., 2003). In any case, these results show that batches treated more times with antibiotics are related to poorer health status. Antibiotic treatment could be used as a moni-toring parameter, and those farms using antibiotics three or more times in different consecutive batches may be worth to explore for possible alternatives strategies. Finally, batches belonging to farms that obtained the drinking water from “public water supply” and “other” sources presented lower TDURFAT (p< 0.01) and those that obtained it from a river had higher MORT (p< 0.01) in comparison to other ones. Patience (1989) stated that poor water quality can impair health, reduce productivity and cause death in severe cases, leading to poor pig welfare and economic losses for the producer. Vico et al.(2011) observed that pig farms supplied with water sources that were not derived from “public supply” had higher level of contamination by Samonella in GF pigs, although the authors did not assess effects on productive performance. These differences can be justified by the chloride treatment that normally is performed to public water before its consumption.
In conclusion, the results showed that many of the production factors studied did affect performance, although some others which were not taken into account in the current study may also do so. The influence of some production factors were highly significant (e.g. trimester of placement, ventilation system and circo-virus vaccination) and data can help to quantify their effects. However, other parameters (e.g.type of feeder or drinker, frequency of antibiotic use and fraction of slated floor) did not show significant effects over pro-ductive performance. Furthermore, some not expected results were found, as the effect of the number of pigs placed, favouring small farms, over both the total du-ration of the fattening period (differences up to two weeks) and the mortality rate (differences up to 19%) or the number of animal origins affecting almost exclu-sively the mortality rate (about 22% of difference bet-ween the levels). These data contribute to better des-cribe the current situation of the Spanish GF pig production and will be a useful tool for future analysis and studies.
Acknowledgments
The authors express gratitude to the follow pig com-panies: Cincaporc S.A., Cooperativa de Artesa, Coope-rativa Ganadera de Caspe, Copiso Sociedad
Coopera-tiva, Cooperativa de Ivars, Corporación Agroalimen-taria Guissona, Piensos del Segre S.A., Progatecsa and Vall Companys, for allowing to use their data and to FEDNA (Fundación Española para el Desarrollo de la Nutrición Animal) for helping to involve the companies with the project. This research was supported by the Spanish Ministerio de Ciencia e Innovación (project AGL2011-29960). We also thank the Agencia Española de Cooperación Internacional para el Desarrollo (MAEC-AECID) for research fellowships.
References
Aarnink AJA, Wagemans MJM, Van den Berg AJ, 1997. Housing for growing pigs, meeting the needs for animal, stockman and environment. In: Livestock environment 5, Vol 2. Proc 5thInternational Symposium, Bloomington,
MN (USA), May 29-31. pp: 86-92.
Averós X, Brossard L, Dourmad JI, De Greef KH, Edge HL, Edwards SA, Meunier-Salaun MC, 2010. A meta-analysis of the combined effect of housing and environmental enrichment characteristics on the behaviour and perfor-mance of pigs. Appl Anim Behav Sci 127: 73-85. BOE, 1995. Royal Decree 245/1995, of 17 February,
esta-blishing the coordinated program to control and eradi-cation of Aujeszky’s disease. Boletín Oficial del Estado No. 60, 11/3/1995.
Choi HL, Song JI, Lee JH, Albright LD, 2010. Comparison of natural and forced ventilation systems in nursery pig houses. Appl Eng Agr 26: 1023-1033.
Edwards DB, Tempelman RJ, Bates RO, 2006. Evaluation of Duroc- vs.Pietrain-sired pigs for growth and composition. J Anim Sci 84: 266-275.
Eurostat, 2010. Pig farming in the EU, a changing sector. Available in http://epp.eurostat.ec.europa.eu/cache/ ITY_OFFPUB/KS-SF-10-008/EN/KS-SF-10-008-EN.PDF. [16 October 2012].
Faostat, 2010. Production quantities by country. Available in http://faostat3.fao.org/home/index.html#VISUALIZE. [16 October 2012].
FEDNA, 2006. Necesidades nutricionales para ganado porcino (De Blas C, Gasa J, Mateos GG, eds). Fundación Española para el Desarrollo de la Nutrición Animal, Madrid. Available in http://www.fundacionfedna.org/ sites/default/files/NORMAS_PORCINO_2006.pdf. [12 Jan 2012]. [In Spanish].
Gispert M, Valero A, Oliver MA, Diestre A, 1997. Problemas asociados a la falta de grasa en canales porcinas. Euro-carne 61: 27-32. [In Spanish].
Gispert M, Font i Furnols M, Gil M, Velarde A, Diestre A, Carrión D, Sosnicki AA, Plastow GS, 2007. Relationships between carcass quality parameters and genetic types. Meat Sci 77: 397-404.
Jacela JY, Dritz SS, DeRouchey JM, Tokach MD, Goodband RD, Nelssen JL, 2011. Field evaluation of the effects of a porcine circovirus type 2 vaccine on finishing pig growth performance, carcass characteristics, and mortality rate in a herd with a history of porcine circovirus-associated disease. J Swine Health Prod 19(1): 10-18.
Larriestra AJ, Maes DG, Deen J, Morrison RB, 2005. Mixed models applied to the study of variation of grower-finisher mortality and culling rates of a large swine production system. Can J Vet Res 69: 26-31.
Losinger WC, 1998. Feed-conversion ratio of finisher pigs in the USA. Prev Vet Med 36: 287-305.
Maes D, Deluyker H, Verdonck M, Castryck F, Miry C, Vrijens B, De Kruif A, 2000. Herd factors associated with the seroprevalences of four major respiratory pathogens in slaughter pigs from farrow-to finish pig herds. Vet Res 31: 313-327.
Maes D, Duchateau L, Larriestra AJ, Deen J, Morrison RB, 2004. Risk factors for mortality in grow-finishing pigs in Belgium. J Vet Med Series B Infect Dis Vet Public Health 51: 321-326.
MAGRAMA, 2011. El sector de la carne de cerdo en cifras-Principales indicadores económicos en 2010. Ministerio de Medio Ambiente, y Medio Rural y Marino, Madrid. [In Spanish].
MAGRAMA, 2012. El sector de la carne de cerdo en cifras-Principales indicadores económicos en 2011. Ministerio de Medio Ambiente, y Medio Rural y Marino, Madrid. [In Spanish].
Martínez J, Peris B, Gómez EA, Corpa JM, 2009.The rela-tionship between infectious and non infectious herd fac-tors with pneumonia at slaughter and productive parame-ters in fattening pigs. Vet J 179: 240-246.
Miller GY, Algozin KA, McNamara P, Bush EJ, 2003. Productivity and economic impacts of feed grade antibio-tic use in pork production. J Agr Appl Econ 35: 467-482. Niemi JK, Sevón-Aimonen ML, Pietola K, Stalder KJ, 2010. The value of precision feeding technologies for grow-finish swine. Liv Prod Sci 129: 13-23.
Nyachoti CM, Patience JF, Seddon IR, 2005. Effect of water source (ground versussurface) and treatment on nursery pig performance. Can J Anim Sci 85: 405-407.
Observatori del Porcí, 2012. Informe del sector porcino. Ejercicio 2011. Departamento de Agricultura, Ganadería, Pesca, Alimentación y Medio Natural, Barcelona. [In Spanish].
Oliveira J, Guitián J, Yus E, 2007. Effect of introducing pig-lets from farrow-to-finish breeding farms into in all-out fattening batches in Spain on productive parameters and economic profit. Prev Vet Med 80: 243-256. Oliveira J, Yusa E, Guitián FJ, 2009. Effects of management,
environmental and temporal factors on mortality and feed consumption in integrated swine fattening farms. Liv Prod Sci 123: 221-229.
Patience JF, 1989.Water quality and quantity: importance in animal and poultry production. In: Biotechnology in the feed industry (Lyons TP, ed). Alltech Techn Publ, Nicho-lasville (USA). pp: 121-138.
Penny PC, 2000.Effect of modification to pen design forma-tion on the performance of weaned pigs housed in large group systems. J Anim Sci 78(Suppl 1): 1003 (Abstr). Resano H, Sanjuan AI, Albisu LM, 2007. Consumer’s
accep-tability of cured ham in Spain and the influence of infor-mation. Food Qual Prefer 18: 1064-1076.
Segales J, Urniza A, Alegre A, Bru T, Crisci E, Nofrarıas M, López-Soria S, Balasch M, Sibila M, Xu Z et al., 2009. A genetically engineered chimeric vaccine against porcine circovirus type 2 (PCV2) improves clinical, pathological and virological outcomes in postweaning multisystemic wasting syndrome affected farms. Vaccine 27: 7313-7321. Sibila M, Calsamiglia M, Segalés J, Blanchard P, Badiella L, Le Dimna M, Jestin A, Domingo M, 2004. Use of a polymerase chain reaction assay and an ELISA to monitor porcine circovirus type 2 infection in pigs from farms with and without postweaning multisystemic wasting syndro-me. Am J Vet Res 65: 88-92.
SIP Consultors, 2011. Coste de producción del cerdo en enero 2011. Available in http://www.sipconsultors.com/ images/stories/articles/01-11/precio-coste1-11.pdf. [Nov. 07, 2011]. [In Spanish].
Thacker E, 2006. Mycoplasmal diseases. In: Diseases of swine, 9th ed. (Straw BE, Zimmerman JJ, D’Allaire
S, Taylor DJ, eds). Blacwell Publ Ltd, Oxford (UK). pp: 701-717.
Turner SP, Ewena M, Rookea JA, Edwards SA, 2000. The effect of space allowance on performance, aggression and immune competence of growing pigs housed on straw deep litter at different group sizes. Liv Prod Sci 66: 47-55. Vico JP, Rol I, Garrido V, San Román B, Grilló MJ,
Mainar-Jaime RC, 2011. Salmonellosis in finishing pigs in Spain: prevalence, antimicrobial agent susceptibilities, and risk factor analysis. J Food Prot 74(7): 1070-1078.
Wathes CM, 1994. Air and surface hygiene. In: Livestock housing (Wathes CM, Charles DR, eds). CAB Int, Walling-ford (USA). pp: 123-148.
Wierup M, 2001. The Swedish experience of the 1986 year ban of antimicrobial growth promoters, with special refe-rence to animal health, disease prevention, productivity, and usage of antimicrobials. Microb Drug Resist 7: 183-190.
Wise T, Klindt J, Lunstra DD, Buonomo FC, Yen JT, 1996. Thymic, gonadal, and endocrine relationships in gilts and boars administered porcine somatotropin. J Anim Sci 74: 2992-3000.