Is age still valid for segmenting e-shoppers?
Conference Paper · June 2015
READS
43
3 authors, including:
Angel F. Agudo-Peregrina
Universidad Politécnica de Madrid 25PUBLICATIONS 77CITATIONS
SEE PROFILE
Ángel Hernández-García
Universidad Politécnica de Madrid 54PUBLICATIONS 164CITATIONS
Is age still valid for segmenting e-shoppers?
Completed Research Paper
Agudo-Peregrina, Ángel F.
Universidad Politécnica de Madrid [email protected]
Hernández-García, Ángel.
Universidad Politécnica de Madrid [email protected]
Acquila-Natale, Emiliano
Universidad Politécnica de Madrid [email protected]
Abstract
This study examines the differences in the acceptance and use of electronic commerce by end consumers, segmented in three groups according to their age. The UTAUT2 provides the theoretical framework, with the addition of three constructs from e-commerce literature: perceived risk, product risk, and perceived trust. Responses to an online survey by 817 Spanish Internet shoppers validate the research model. An omnibus test of group differences precedes the assessment of four multigroup analysis methods. Results show that gaps caused by age differences in e-shoppers are narrowing. This paper also identifies the strengths and weaknesses of the different multigroup approaches.
Keywords: Electronic commerce, acceptance, segmentation, age, multigroup comparison
1. Introduction
The use of Partial Least Squares (PLS) to empirically validate relationships in general theoretical models is common in the disciplines of e-business, marketing, and consumer behavior (Henseler et al. 2009). Most of the studies using PLS validate their models from one sample only and assume that this sample is homogeneous. Segmentation is an essential tool for marketing, but it requires analyzing differences between consumers (Kotler & Armstrong, 2012). Therefore, a homogeneous sample approach is not valid for segmentation. Multigroup analysis allows assessment of these differences across groups in PLS analysis. Some studies use these multigroup methods to analyze different segments and identify significant differences in path estimates (e.g. Agudo-Peregrina et al., 2014.). However, there are still few examples of empirical multigroup analysis, and these examples present two important shortcomings.
First, studies including multigroup analysis limit the empirical validation to the use of only one or at most two methods. Furthermore, studies incorporating two different methods do not perform any comparison between the results from both methods (Henseler et al., 2009). Second, existing PLS multigroup research rarely considers more than two groups in the analysis (e.g. Acedo & Jones, 2007). In addition, approaches to multigroup analysis with more than two groups focus on pairwise group comparisons, increasing the familywise error rate (Mooi & Sarstedt, 2011).
PLS for empirical validation. The unified theory of acceptance and use of technology (UTAUT) (Venkatesh et al., 2003) is a synthesis of eight previous acceptance models. UTAUT includes moderating variables such as gender, age or experience. In UTAUT and its latter evolution, UTAUT2 (Venkatesh et al., 2012), moderators are dichotomous variables (e.g., male and female users, young and old users, experienced and non-experienced users). However, modeling some moderators—such as age—as dichotomous variables is a too simplistic representation of reality, especially for the study of consumer behavior.
In the case of electronic commerce this oversimplification is particularly relevant, as the use of electronic commerce increases and new consumers from the upper and lower age segments are starting to make online purchases. For example, the number of Internet users in Spain has spiked from 23.5% in 2000 to 73.1% of the population (ONTSI, 2014). Meanwhile, online purchasers have increased from 12.7% in 2000 to 60.6% in 2013, with online transactions between consumers and online vendors doubling in less than four years, totaling 14.6 billion euros in 2013 (ONTSI, 2014). In parallel, the characteristics of online consumers have changed and evolved in the last decade. The number of older e-shoppers—more than 49 years old—was 15.2% of the total in 2007, but has raised to 21.7% in 2013 due to the incorporation of new customers and the aging of those that started using electronic commerce in their forties a decade ago. On the other hand, consumers younger than 25 years old are digital natives that have already been born after the emergence of Internet.
This study thereby focuses on the analysis of the impact of consumers’ age in the acceptance and use of electronic commerce, and compares the result of applying different multigroup methods with segmentation purposes. The study begins with a review of the e-commerce acceptance literature and the influence of age in e-e-commerce acceptance in Section 2. Section 3 describes the characteristics of the method. Section 4 shows the data analysis and the results. The final section contains the conclusions and limitations of the study, as well as avenues of future research on this topic.
2. Literature Review
2.1. Electronic commerce acceptance
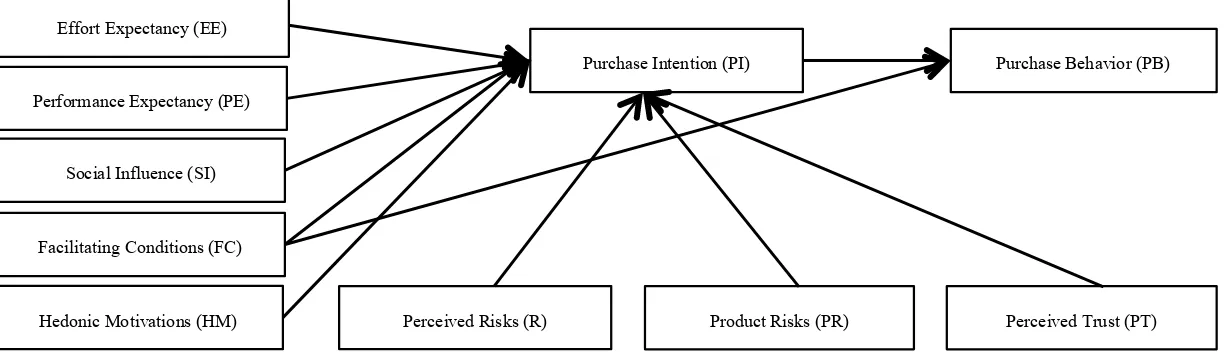
Despite the absence of prior studies using the UTAUT2 to study the acceptance of electronic commerce, earlier literature confirms the influence of UTAUT factors in purchase intention and purchase behavior (e.g. Pavlou, 2003; Van Slyke et al., 2002). However, among the new predicting variables from UTAUT2, only hedonic motivation is applicable to electronic commerce (Ha & Stoel, 2009; Morosan & Jeong, 2008). Consumers do not have to pay a particular fee to purchase online, apart from the Internet connection rate, and therefore price is not relevant. Habit is not a fitting predictor variable either because it has a moderating role instead (Limayem et al., 2007). In addition, literature in e-commerce research proposes two specific factors influencing online purchase intention: perceived risk (Lin et al., 2010; Pavlou, 2003) and perceived trust (Chang, 2010; Chen & Dhillon, 2003). Bhatnagar and Ghose (2004) further differentiate between two types of perceived risks in online shopping: product risks and system risks.
2.2. Age as a moderator variable
Age is a useful segmentation variable in marketing, not only because it is very easy to gather this information from consumers, but also because there are certain socio-cognitive differences between individuals of different ages (Morris & Venkatesh, 2000). E-commerce literature posits that there are differences in the acceptance and use of online stores contingent on consumers’ age. The main results show that younger users have a greater interest on using e-commerce and buy more often (Doolin et al., 2005: Ha & Stoel, 2009; Joines et al., 2003), and also that the purpose of using e-commerce is different across age groups (Burke, 2002).
H1. The effect of effort expectancy on purchase intention is higher for older e-consumers. H2. The effect of performance expectancy on purchase intention is higher for younger
e-consumers.
H3. The effect of social influence on purchase intention is higher for older e-consumers. H4. The effect of facilitating conditions on purchase intention is higher for older e-consumers. H5. The effect of hedonic motivation on purchase intention is higher for younger
e-consumers.
H6. The effect of perceived trust on purchase intention is higher for older e-consumers. H7. The effect of system risks on purchase intention is higher for older e-consumers. H8. The effect of product risks on purchase intention is higher for younger e-consumers. H9. The effect of facilitating conditions on purchase behavior is higher for older e-consumers.
3. Method
According to electronic commerce acceptance literature review, the final research model comprises all factors from UTAUT2 excluding price value and habit, and incorporates three specific factors of electronic commerce: perceived risk (i.e., system risks), product risks and perceived trust. Figure 1 shows the research model.
Figure 1: Research model.
3.1. Participants
The empirical validation consisted of an online survey that obtained 1,521 total responses from April to October 2013. Most likely because of the questionnaire length (46 items), 704 responses were incomplete and excluded from the final sample, that comprised 817 valid answers. Respondents of the online survey came from announcements to volunteering students at Universidad Politécnica de Madrid, online shoppers from an internal database, posts with links to the questionnaire published in the social networking website LinkedIn, and personal contacts of respondents: a raffle encouraged participants to answer the questionnaire —the prize was a tablet—and also to redistribute the survey in their networks—there was a special prize for the participant that got most referral responses from his or her links.
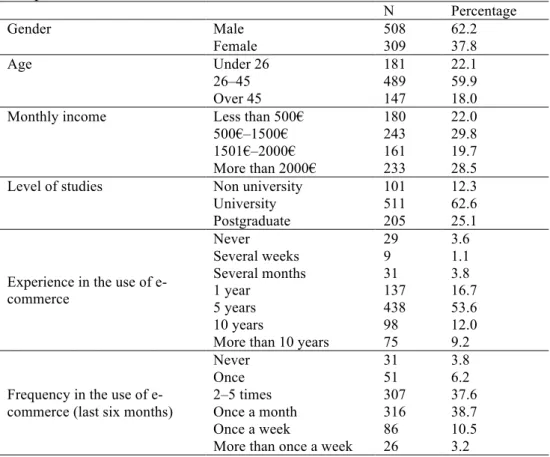
As shown in Table 1, age divides the sample into three groups. The division of the sample in these three groups responds to historical reasons of the Spanish Internet Access evolution. The senior group —older than 45—, includes those who were at least 30 in 1998, when only one million of Spaniards had Internet connection (Sanz, 2007). Its members were already adult when they used Internet for their first time. Consistently, Spanish statistics show that e-shoppers older than 49 represent only 21.7% of the total population of online buyers, while
Effort Expectancy (EE)
Purchase Intention (PI) Purchase Behavior (PB)
Product Risks (PR) Perceived Risks (R)
Hedonic Motivations (HM) Facilitating Conditions (FC) Social Influence (SI) Performance Expectancy (PE)
those between 35 and 49 signify 36.4% (ONTSI, 2014). On the other hand, the junior group contains the e-shoppers younger than 26, that’s it, those that where 10 years old at the most in 1998. All three groups are large enough to consider small effect size and high statistical power (Cohen, 1998). According to sample characteristics, experience and frequency in the use of e-commerce of the majority of respondents are very high, with almost no valid participants without experience in online shopping. Table 1 shows the sample characteristics.
Table 1: Sample characteristics
N Percentage
Gender Male 508 62.2
Female 309 37.8
Age Under 26 181 22.1
26–45 489 59.9
Over 45 147 18.0
Monthly income Less than 500€ 180 22.0 500€–1500€ 243 29.8 1501€–2000€ 161 19.7 More than 2000€ 233 28.5 Level of studies Non university 101 12.3
University 511 62.6
Postgraduate 205 25.1
Experience in the use of e-commerce
Never 29 3.6
Several weeks 9 1.1 Several months 31 3.8
1 year 137 16.7
5 years 438 53.6
10 years 98 12.0
More than 10 years 75 9.2
Frequency in the use of e-commerce (last six months)
Never 31 3.8
Once 51 6.2
2–5 times 307 37.6
Once a month 316 38.7
Once a week 86 10.5
More than once a week 26 3.2
3.2. Measures
The final survey included 46 items adapted from UTAUT, UTAUT2, and other e-commerce adoption studies: effort expectancy (4 items), performance expectancy (5 items), social influence (2 items), facilitating conditions (7 items), hedonic motivations (3 items), product risk (5 items), perceived risk (7 items), perceived trust (9 items), purchase intention (2 items), and actual purchase behavior (2 items).
The formulation of the questionnaire items took place in three steps: (1) translation into Spanish; (2) validation by a group of technology management researchers and professors from Universidad Politécnica de Madrid; and (3) item rewording proposal, followed by a face-to-face interview with a random group of 10 students who completed the questionnaire and gave feedback on items to ensure that the questions were clear and understandable. The scale for all items was a Likert-type seven-point scale, ranging from 1 (completely disagree) to 7 (completely agree). The online questionnaire consisted of 46 items in 3 sets: demographic items, non-product-related items, and product-related items. For each respondent, items within each set appeared in a random order to avoid potential response sets.
Considering that no prior studies combine factors from UTAUT and UTAUT2 to study online shopping behavior, and there are both formative (purchase behavior) and reflective constructs (the rest of latent variables), the exploratory aim of the research leads to a traditional partial least squares structural equation modeling (PLS-SEM). PLS-SEM is suitable for analyzing complex models with predictive purposes (Chin, 1998). The statistical analysis tools were XLStat-PLSPM and SmartPLS 3.0 (Ringle et al., 2014).
The analysis of age’s moderating effect first validates every model and then develops a multigroup analysis (Sarstedt et al., 2011) with age as a categorical variable (Henseler & Fassott, 2010) to split the sample in three subsamples. The multigroup analysis included five methods: (1) omnibus test of group differences (OTG) (Sarstedt et al., 2011); (2) a parametric approach assuming equal variances (Chin, 2000); (3) a parametric approach assuming unequal variances (Sarstedt et al., 2011); (4) a non-parametric approach based on permutations (Chin & Dibbern, 2010); and (5) Henseler et al.’s (2009) PLS multigroup analysis.
4. Results
4.1. Measurement model and structural model
Measurement model analysis has to ensure validity and reliability requirements for each subsample (e.g. Chin, 1998; Henseler et al., 2009; Hair et al., 2012; Roldan & Sánchez-Franco, 2012). Item reliability demands removing items with factorial loadings lower than 0.5 in all three models to guarantee configuration invariance for multigroup analysis (Steenkamp & Hofstede, 2002). The analysis reveals four invalid items: three indicators from facilitating conditions––FC1 (“I have control over the whole Internet shopping process”); FC6 (“When I shop on the Internet, there is someone who can help me if I experience trouble using the system”); and FC7 (“There is a support line available in the Internet shopping process”)––and one item from perceived risks––R7 (“When I shop on the Internet, I risk not finding the lowest prices”). Factorial loadings of most of the remaining items are higher than 0.707. Cronbach’s alphas and composite reliabilities are higher than 0.8 for all constructs (Fornell & Larcker, 1981). The analyses also discarded multicollinearity in the case of the formative construct (PB), with variance inflation factor (VIF) values lower than 5 (Kleinbaum, Kupper & Muller, 1988).
Convergent validity analysis shows that average variance extracted (AVE) is higher than 0.5 for all constructs, and both Fornell and Larcker (1981) criterion and cross-loadings (Chin, 1998) confirm discriminant validity in all cases. The HTMT criterion (Henseler et al., 2015) shows that values are always lower than 0.85 except between performance expectancy and effort expectancy, with values of 0.91; 0.90; and 0.82 for the Under 25, 26-45, and Over 45 groups, respectively, which slightly violates the HTMT90 criteria in the first two groups.
Table 3 shows the results of the structural model analysis. A bootstrapping procedure with 1000 resamples confirms the structural model’s reliability. The bootstrapping procedure with a number of resamples high enough (1000) serves to calculate standard errors and values of the t-statistic for a one-tailed distribution, t (999) (Chin, 1998).
Table 2: Results of the Structural Model
Path coefficients for each age segment
Relation Under 25 26-45 Over 45
Performance expectancy!Purchase intention 0.092 0.143** 0.274** Social influence!Purchase intention 0.022 0.044 0.065 Facilitating conditions!Purchase intention 0.249*** 0.138** 0.401*** Hedonic motivation!Purchase intention 0.059 0.103** 0.026 Perceived trust!Purchase intention 0.247** 0.171*** -0.040 Perceived risks!Purchase intention -0.218** -0.191*** -0.247** Product risks!Purchase intention 0.119 -0.006 0.062 Facilitating conditions!Purchase behavior 0.042 0.098** 0.048 Purchase intention!Purchase behavior 0.686*** 0.728*** 0.750*** R2
Purchase intention 0.371 0.425 0.438 Purchase behavior 0.497 0.595 0.603 Q2
Purchase intention 0.287 0.374 0.334 Purchase behavior 0.369 0.464 0.447 GoF
0.545 0.610 0.626 SRMR
0.064 0.050 0,073 *p < 0.05; **p < 0.01; ***p < 0.001; ns: not significant (based on t(999), one-tailed test) t(0.05; 999) = 1.646; t(0.01; 999) = 2.330; t(0.001; 999) = 3.098
Four out of ten relationships are significant in younger and older groups. In the range between 26 and 45 years old, eight out of ten relationships are significant. R2 is higher than 0.1 in all cases (Hair et al., 2012), with a minimum value of 0.371. Stone-Geisser’s Q2 confirms the predictive relevance of the relations in all models. Assuming the limitations (Henseler et al., 2009) of the goodness-of-fit index (GoF) (Tenenhaus et al., 2005), GoF values are higher than 0.5 in all models. The composite model SRMR analysis (Henseler et al., 2014) shows that all groups values are lower than the most conservative threshold of 0.08 (Hu and Bentler, 1999).
Facilitating conditions is the main predictor of purchase intention for both the younger and older groups. Perceived risks also have a significant effect on purchase intention, followed by perceived trust for younger consumers, and performance expectancy for older consumers. Perceived risks are the main predictor of purchase intention in the case of the middle-aged adults, followed by perceived trust, performance expectancy, effort expectancy, facilitating conditions and hedonic motivations, all of them exerting a significant effect. Purchase intention is a good predictor of purchase behavior for all groups, with paths higher than 0.65.
4.2. Results of the multigroup analysis
Prior to multigroup analysis, two tests ensure both model and metric invariance of the construct measures. First, all measurement models comprise exactly the same items (42), after removing items with loadings lower than 0.5. All items remaining in the models have loadings higher than 0.5, and most of them are higher than 0.7. Second, loadings for every construct should be the same, assuming metric invariance between groups (Chin & Dibbern, 2010). A permutation-based procedure for multi-group analysis shows that only 6 (under 25 years old vs. 26-45 years old), none (under 25 years old vs. over 45 years old), and 1 (26-45 vs. over 45 years old) of the 42 items are significantly different, representing 14.3%, 0%, and 2.4% of the total, respectively.
comparisons. OTG (Sarstedt et al., 2011) assesses whether the null hypothesis that path coefficients are equal across the three groups can be rejected. FR values in Table 4 confirm at
least one significant difference between segments for every relationship of the model.
Table 3: Results of the OTG analysis
Relation FR
Effort expectancy!Purchase intention 974.84 Performance expectancy!Purchase intention 1537.51 Social influence!Purchase intention 10939.12 Facilitating conditions!Purchase intention 129.54 Hedonic motivation!Purchase intention 1833.85 Perceived trust!Purchase intention 3939.54 Perceived risks!Purchase intention 5049.00 Product risks!Purchase intention 14339.77 Facilitating conditions!Purchase behavior 700.70 Purchase intention!Purchase behavior 425.22
Pairwise group comparisons indicate which groups are significantly different from others for every relationship. Multigroup analysis contains two parametric methods and two non-parametric methods (see section 3.3). Table 5 shows the results of the comparisons of the four methods between younger and middle-aged e-shoppers. Path differences are higher or equal to 0.1 only in effort expectancy–purchase intention, facilitating conditions–purchase intention and product risks–purchase intention relationships. Three of the four methods—permutations being the exception—consider that there is a significant difference in the relationship between product risks and purchase intention, and only two of the four methods—parametric non-equivalent variances and Henseler—indicate that there is significant difference in the relationship between facilitating conditions and purchase intention.
Table 4: Results of the multi-group analysis (between under 25 years old and 26-45 years old)
Relation Diff tpar-eq tpar-non_eq pperm pHen Effort expectancy!Purchase intention -0,100 1,109 -1,402 0,424 0,941 Performance expectancy!Purchase intention -0,051 0,645 -0,829 0,675 0,797 Social influence!Purchase intention -0,022 0,457 -0,557 0,758 0,746 Facilitating conditions!Purchase intention 0,111 1,585 2,063* 0,287 0,018*** Hedonic motivation!Purchase intention -0,044 0,883 -1,055 0,530 0,870 Perceived trust!Purchase intention 0,076 1,088 1,313 0,454 0,094 Perceived risks!Purchase intention -0,027 0,428 -0,524 0,770 0,703 Product risks!Purchase intention 0,125 2,109* 2,489** 0,144 0,000*** Facilitating conditions!Purchase behavior -0,056 0,312 -0,383 0,820 0,657 Purchase intention!Purchase behavior -0,042 1,012 -1,253 0,478 0,891 *p < 0.05; **p < 0.01; ***p < 0.001
Table 6 summarizes the results of an analogous multigroup analysis for the comparisons between younger and older e-shoppers (under 25 years old vs. over 45 years old), and between middle-aged and older e-shoppers (26-45 years old vs. over 45 years old). Table 6 shows the differences between path estimates and a letter indicating the number of methods that showed significant differences.
Table 5: Results of the multigroup analysis and hypotheses testing
Effort expectancy!Purchase intention -0.1e 0.01e 0.11d H1 No Performance expectancy!Purchase intention -0.051e -0.182b -0.131c H2 No Social influence!Purchase intention -0.022e -0.043e -0.021e H3 No Facilitating conditions!Purchase intention 0.111c -0.152b -0.263a H4 Partially Hedonic motivation!Purchase intention -0.044e 0.033e 0.077c H5 No Perceived trust!Purchase intention 0.076e 0.287a 0.211b H6 No Perceived risks!Purchase intention -0.027e 0.029e 0.056e H7 No Product risks!Purchase intention 0.125b 0.057e -0.068d H8 No Facilitating conditions!Purchase behavior -0.056e -0.006e -0.05e H9 No Purchase intention!Purchase behavior -0.042e -0.064e -0.022e
Significant differences in: a Four methods; b Three methods; c Two methods; d One method; e None.
From the results, the four methods consider that the differences are significant only for facilitating conditions–purchase intention and perceived trust–purchase intention relations. In all cases marked as b, permutations is the method for which the difference is not significant.
Similarly, by observing the cases noted as c, the most restrictive methods are permutations and the parametric approach assuming equivalent variances. Nonetheless, the p-values of the latter are just slightly above 0.05. Henseler et al.'s (2009) procedure is the least restrictive because it is the only method that finds significant differences in the cases noted as d.
From Table 6, hypotheses 1,3,5, 7 and 9 are not supported because there are no significant differences across groups. Hypothesis 2 is not supported either because performance expectancy is higher for older e-shoppers. Hypothesis 4 is only partially supported because, even though all differences are significant, the effect of facilitating conditions on purchase behavior is higher for younger e-shoppers than for middle-aged e-shoppers. Hypothesis 6 is not supported because the influence of perceived trust is higher for younger consumers. Lastly, hypothesis 8 is not supported because none of the paths are significant for any group.
5. Conclusions
This study analyzes the differences in the acceptance and use of e-commerce between segments of electronic consumers belonging to groups of different ages. The multigroup analyses comprise five methods that report different results. Surprisingly, none of the hypotheses are fully supported, and only one is partially supported.
The study contributes to theory by validating UTAUT2 in an e-commerce context. The findings from the empirical analysis suggest that age may not be moderating the relation between predictors and e-shopping behavior. This might invalidate its relevance as segmentation variable for online shopping. It appears that, once the older e-shoppers overcome the barriers to online shopping, the differences with younger consumers disappear. Nevertheless, online retailers can take advantage of the findings from this study, by adapting their marketing strategies according to the differences in the factors that predict purchase intention in every segment. Furthermore, regardless of consumers’ age, retailers should lower risk perceptions and avoid interferences in the purchasing process so that consumers do not perceive that they are not in control of the process. This recommendation is particularly important in the case of older shoppers. On the other side, increasing the perception of trust (e.g. using social networks to keep a direct contact with customers) might be consistent with young consumers' needs.
more than two groups to confirm the results from this study. The analyses also find that apparently both parametric approaches behave similarly, but non-parametric methods in general show opposite results, with permutations being very restrictive and Henseler et al.'s (2009) method being very permissive.
While most of the respondents have previous experience with online shopping, this research lacks perspective from non-shoppers. This limitation of the sample might affect generalization of results about the moderating effect of age from this study. A broader study should consider completing the sample with non-experienced (or at least with limited e-shopping experience) participants. Finally, future research should further explore the well-established measures for effort expectancy and performance expectancy, based on the results of the HTMT method––note that the original study only used the traditional discriminant validity assessment methods available in previous PLS-SEM analysis software packages.
6. References
AbuShanab, E., & Pearson, J. M. (2007). Internet banking in Jordan. The Unified theory of acceptance and use of technology (UTAUT) perspective. Journal of Systems and Information Technology, 9(1), 78–97.
Acedo, F. J., & Jones, M. V. (2007). Speed of internationalization and entrepreneurial cognition: Insights and a comparison between international new ventures, exporters and domestic firms. Journal of World Business, 42(3), 236-252.
Agudo-Peregrina, Á. F., Pascual-Miguel, F. J., & Chaparro-Peláez, J. (2014). It’s never the same: the role of homogeneity in online services. Service Business, 8(3), 453–464. Ajzen, I. (1991). The theory of planned behavior. Organizational Behavior and Human
Decision Processes, 50(2), 179–211.
Bhatnagar, A., & Ghose, S. (2004). Segmenting consumers based on the benefits and risks of Internet shopping. Journal of Business Research, 57(12), 1352–1360.
Bhatnagar, A., Misra, S., & Rao, H. R. (2000). On Risk, Convenience , and Internet Shopping Behavior. Communications of the ACM, 43(11), 98-105.
Burke, R. R. (2002). Technology and the Customer Interface: What Consumers Want in the Physical and Virtual Store. Journal of the Academy of Marketing Science, 30(4), 411– 432.
Chang, H. H. (2010). Task-technology fit and user acceptance of online auction. International Journal of Human-Computer Studies, 68(1-2), 69–89.
Chen, S. C., & Dhillon, G. S. (2003). Interpreting dimensions of consumer trust in
e-commerce. Information Technology and Management, 4(2–3), 303–318.
Chin, W. W. (1998). The partial least squares approach to structural equation modelling. In G. A. Marcoulides (Ed.), Modern methods for business research. (Vol. 8, pp. 295–336). Mahwah, NJ: Lawrence Erlbaum Associates, Inc.
Chin, W. W. (2000). Frequently Asked Questions – Partial Least Squares & PLS-Graph.
Home Page. [On-line]. Retrieved from Available:
http://disc-nt.cba.uh.edu/chin/plsfaq.htm
Psychology. University of New York, Ed.). New York: Routledge.
Davis, F. D. (1989). Perceived usefulness, perceived ease of use, and user acceptance of information technology. MIS Quarterly, 13(3), 319–340.
Davis, F. D, Bagozzi, R. P., & Warshaw, P. R. (1992). Extrinsic and intrinsic motivation to use computers in the workplace. Journal of Applied Social Psychology, 22(14), 1111– 1132.
Doolin, B., Dillon, S., Thompson, F., & Corner, J. L. (2005). Perceived risk, the Internet shopping experience and online purchasing behavior: A New Zealand perspective.
Journal of Global Information Management, 13(2), 66–88.
Fishbein, M., & Ajzen, I. (1975). Belief, attitude, intention, and behavior: An introduction to theory and research. MA: Addison-Wesley.
Fornell, C., & Larcker, D. F. (1981). Structural equation models with unobservable variables and measurement error: Algebra and statistics. Journal of marketing research, 18,
382-388.
Ha, S., & Stoel, L. (2009). Consumer e-shopping acceptance: Antecedents in a technology acceptance model. Journal of Business Research, 62(5), 565–571.
Hair, J. F., Sarstedt, M., Ringle, C. M., & Mena, J. A. (2012). An assessment of the use of partial least squares structural equation modeling in marketing research. Journal of the Academy of Marketing Science, 40(3), 414-433.
Henseler, J. (2011) Recent Advances in PLS Path Modeling. Analyzing Interaction Effects and Multiple Groups, University of Seville, October 28, 2011.
Henseler, J., Dijkstra, T. K., Sarstedt, M., Ringle, C. M., Diamantopoulos, A., Straub, D. W., Ketchen, D. J., Hair, J. F., Hult, G. T. M., and Calantone, R. J. 2014. Common Beliefs and Reality about Partial Least Squares: Comments on Rönkkö & Evermann (2013),
Organizational Research Methods 17(2): 182-209.
Henseler, J. & Fassott, G. (2010) Testing Moderating Effects in PLS Path Models: An Illustration of Available Procedures, In Handbook of Partial Least Squares, Esposito Vinzi, V., Chin, W. W., Henseler, J., & Wang,H. Eds. (pp. 713-735). Springer Berlin Heidelberg.
Henseler, J., Ringle, C. M., & Sarstedt, M. (2015). A new criterion for assessing discriminant validity in variance-based structural equation modeling. Journal of the Academy of Marketing Science, 43(1), 115-135.
Henseler, J., Ringle, C. M., & Sinkovics, R. R. (2009). The use of partial least squares path modeling in international marketing. Advances in International Marketing, 20, 277– 320.
Hu, L.-t., and Bentler, P. M. 1998. Fit Indices in Covariance Structure Modeling: Sensitivity to Underparameterized Model Misspecification, Psychological Methods 3(4): 424-453.
Joines, J. L., Scherer, C. W., & Scheufele, D. A. (2003). Exploring motivations for consumer Web use and their implications for e-commerce. Journal of Consumer Marketing,
20(2), 90–108.
Kleinbaum, D.G., Kupper, L.L. & Muller, K.E. (1988) Applied Regression Analysis and other Multivariate Analysis Methods. Boston, PWS-Kent Publishing Company.
Kotler, P., & Armstrong, G. (2012). Principles of Marketing. 14th Edition (pp. 1–740). Liebermann, Y., & Stashevsky, S. (2002). Perceived risks as barriers to Internet and
e-commerce usage. Qualitative Market Research: An International Journal, 5(4), 291– 300.
Lin, W. B., Wang, M. K., & Hwang, K. P. (2010). The combined model of influencing on-line consumer behavior. Expert Systems with Applications, 37(4), 3236–3247.
of intentions: The case of IS continuance. MIS Quarterly, 31(4), 705-737.
Mapeshoane, T. J., & Pather, S. (2012). Adoption of e-commerce in typical developing country context: Lesotho tourism industry. Proceedings of the 14th Annual Conference on World Wide Web Applications Durban, (pp. 7-9).
Morosan, C., & Jeong, M. (2008). Users’ perceptions of two types of hotel reservation web sites. International Journal of Hospitality Management, 27(2), 284–292.
Morris, M. G., & Venkatesh, V. (2000). Age differences in technology adoption decisions: implications for a changing work force. Personnel Psychology, 53(2), 375–403.
Mooi, E. A., & Sarstedt, M. (2011). A concise guide to market research: The process, data, and methods using IBM SPSS statistics. Berlin: Springer.
ONTSI. (2014). Study of the B2C Electronic Commerce 2013. Edition 2014. Madrid: ONTSI. Pavlou, P. A. (2003). Consumer acceptance of electronic commerce: Integrating trust and risk with the technology acceptance model. International Journal of Electronic Commerce, 7(3), 101–134.
Porter, C. E., & Donthu, N. (2006). Using the technology acceptance model to explain how attitudes determine Internet usage: The role of perceived access barriers and demographics. Journal of Business Research, 59(9), 999–1007.
Sanz, M.A. (2007). Fundamentos históricos de la Internet en Europa y en España. Boletín de Red IRIS, 44, 22-36.
Ringle, C.M., Wende, S., & Will, A. (2014). SmartPLS 3.0. Germany: University of Hamburg.
Roldán, J. L., & Sánchez-Franco, M. J. (2012). Variance-Based Structural Equation Modeling: Guidelines for Using Partial Least Squares in Information Systems Research. En M. Mora, O. Gelman, A. Steenkamp, & M. Raisinghani (eds), Research Methodologies, Innovations and Philosophies in Software Systems Engineering and Information Systems, pp. 193-221. Hershey PA: Information Science Reference. Rogers, E. M. (1962). Diffusion of Innovations (1st Edition). The Free Press.
Sarstedt, M., Henseler, J., & Ringle, C. M. (2011). Multigroup Analysis in Partial Least Squares (PLS) Path Modeling: Alternative Methods and Empirical Results. In
Measurement and Research Methods in International Marketing (Advances in International Marketing, Volume 22) (Vol. 22, pp. 195–218). Bingley: Emerald Group Publishing Limited.
Steenkamp, J. B. E., & Hofstede, F. T. (2002). International market segmentation: issues and perspectives. International Journal of Research in Marketing, 19(3), 185-213.
Tenenhaus, M., Esposito Vinzi, V., Chatelin, Y.M., & Lauro, C. (2005). PLS path modeling.
Computational Statistics & Data Analysis, 48 (1), 159–205.
Teo, T. S., & Liu, J. (2007). Consumer trust in e-commerce in the United States, Singapore and China. Omega, 35(1), 22–38.
Tsai, C. H., Zhu, D. S., & Jang, Y. M. (2013). A study on the consumer adoption behaviors of Internet Bank. In 2013 IEEE/ACIS 12th International Conference on Computer and Information Science (ICIS) (pp. 263–268).
Van Slyke, C., Comunale, C. L., & Belanger, F. (2002). Gender differences in perceptions of web-based shopping. Communications of the ACM, 45(8), 82–86.
Venkatesh, V., Morris, M. G., Davis, G. B., & Davis, F. D. (2003). User acceptance of information technology: Toward a unified view. MIS Quarterly, 27(3), 425–478. Venkatesh, V., Thong, J. Y. L., & Xu, X. (2012). Consumer acceptance and use of
information technology: Extending the unified theory of acceptance and use of technology. MIS Quarterly, 36(1), 157–178.