Economic and financial analysis and comparison between two companies in the pharmaceutical industry, Pharma Mar S A and Grifols S A
58
0
0
Texto completo
(2) 2.
(3) Economic and financial analysis and comparison between two companies in the pharmaceutical industry, Pharma Mar S.A. and Grifols S.A.. 3.
(4) Abstract In the present work, a comparison of the financial economic structure of two companies in the pharmaceutical industry (Spanish) will be carried out, in particular, Pharma Mar S.A. and Grifols S.A. For this analysis, the annual accounts of each company will be used to do this, which are considered reliable since they have obtained a favorable evaluation by the auditors. In this analysis we will analyze the financial structure of each company, the profitability, the maturity period of each company and some ratio (according to its structure and liquidity). Finally, the conclusion reached is detailed through the results obtained in each of the parts calculated in the body of the work.. 4.
(5) Index 1. Introducion……………………………………………………………………………………………………………….9 2. Global Vision of the Pharmaceutical Sector……………………………………………………………...11 3. The Pharmaceutical Sector in Spain…………………………………………………………………………..14 4. History of the Companies under analysis…………………………………………………………….…….17 . Pharma Mar S.A………………………………………………………………………………………..….17. . Grifols S.A……………………………………………………………………………………………..……..19. 5. Patrimonial Analysis………………………………………………………………………………………………....22 . Vertical Index……………………………………………………………………………………………….23. . Horizontal Index………………………………………………………………………………………..….27. 6. Analysis of the “Fondo de Maniobra” and operational financing needs………………..….29 7. Profitability Analysis……………………………………………………………………………………….…………31 . Economic Profitability………………………………………………………………………....……….31. . Financial Profitability………………………………………………………………………...…………34. . Threshold of Profitability…………………………………………………………….……..………..36. 8. Period of maduration…………………………………………………………………………….……….……….38 . Economic……………………………………………………………………………………….……………38. . Financial…………………………………………………………………………………………....………..38. 9. Analysis of the financial structure using ratios……………………………………………....…………41 . Indebtedness…………………………………………………………………………………..……..……41. . Solvency………………………………………………………………………………………….…..………44. 10. Analysis by means of liquidity ratios……………………………………………………………..…..……..45 . Current Ratio………………………………………………………………………….……………..…….45. . Acid Test…………………………………………………………………………………….………..………47. 11. Conclusion……………………………………………………………………………………………..…..…………….50 12. References……………………………………………………………………………………………..….…………….53 13. Apendix……………………………………………………………………………………………………..…………….54. 5.
(6) Index of figures Figure 1: Evolution of drug production costs…………………………………………………………………………………12 Figure 2: Volume of sales of the pharmaceutical industry in different areas of the world between 2011 and 2020 (thousands of dollars)……………………………………………………………………………………….…………13 Figure 3: General characteristics of the pharmaceutical industry (Pharmaindustry) …………………………14 Figure 4: Evolution of I+D expenses 2009-2016 in Spain………………………………………………………………..15 Figure 5: National Institute of Statistics. Innovation in companies……………………………………….…………15 Figure 6: Investment in Research and Development depending on the Autonomous Community (Spain)…16 Figure 7: Subsidiaries of the company Pharma Mar S.A………………………………………………………………...18 Figure 8: Vertical analysis of Pharma Mar assets………………………………………………………………………….24 Figure 9: Vertical analysis of Pharma Mar liabilities and equity …………………………………………….………..25 Figure 10: Vertical analysis of Grifols assets………………………………………………………………………………...26 Figure 11: Vertical analysis of Grifols liabilities and equity……………………………………………………………..27 Figure 12: Horizontal analysis Pharma Mar…………………………………………………………………………………..28 Figure 13: Horizontal analysis Grifols……………………………………………………………………………………………28 Figure 14: Analysis of maneuvering fund of Pharma Mar…................................................................29 Figure 15: Analysis of operating needs of Pharma Mar………………………………………………………………….29 Figure 16: Analysis of maneuvering fund of Grifols……………………………………………………………………….30 Figure 17: Analysis of operating needs of Grifols………………………………………………………………………….30 Figure 18: Economic profitability formula…………………………………………………………………………………….31 Figure 19: Economic profitability of Pharma Mar……………………………………………………………………….…31 Figure 20: Economic profitability of Grifols…………………………………………………………….…………………….32 Figure 21: Verification of economic profitability……………………………………………………………………………33. 6.
(7) Figure 22: Annual variation of economic profitability. ………………………………………………………………33 Figure 23: Financial profitability formula. ……………………………………………………………………………….34 Figure 24: Comparation between economic and financial profitability formula. ………………………….34 Figure 25: Financial profitability of Pharma Mar. ……………………………………………………………………..35 Figure 26: Financial profitability of Grifols. ……………………………………………………………………………..36 Figure 27: threshold of profitability formula. …………………………………………………………………………..37 Figure 28: Analysis of threshold of profitability. ………………………………………………………………………37 Figure 29: outline of the maturation period. ……………………………………………………………………………38 Figure 30: Maduration period of Pharma Mar. …………………………………………………………………………39 Figure 31: Maduration period of Grifols. ………………………………………………………………………………….40 Figure 32: Debt ratio formula. ………………………………………………………………………………………….........42 Figure 33: Analisys debt ratio of Pharma Mar. …………………………………………………………………………..42 Figure 34: Analysis between short and long term in the debt of Pharma Mar. ……………………………..43 Figure 35: Analisys debt ratio of Grifols. …………………………………………………………………………………..43 Figure 36: Analysis between short and long term in the debt of Grifols. ………………………………………44 Figure 37: Solvency ratio formula. ……………………………………………………………………………………………44 Figure 38: Analisys between solvency in Pharma Mar and Grifols. ………………………………………………45 Figure 39: Liquidity ratio formula. …………………………………………………………………………………………….45 Figure 40: Analisys the liquidity ratio in Pharma Mar………………………………………………………………….46 Figure 41: Analisys the liquidity ratio in Grifols. ………………………………………………………………………...47 Figure 42: Acid test ratio formula. …………………………………………………………………………………………...47 Figure 43: Analisys the acid test in Pharma Mar. ……………………………………………………………………….48 Figure 44: Analisys the acid test in Grifols…………………………………………………………………………………………48. 7.
(8) 8.
(9) Introduction The present work has the purpose of making an economic-financial comparison between two Spanish companies that belong to the pharmaceutical industry (CNAE 2120), more specifically we will focus on Pharma Mar S.A. and Grifols S.A. To carry out this comparison, we have the annual accounts of each company and the period to be evaluated is from 2016 to 2018. According to Azofra (1995), the economic-financial analysis of a company is the process that tries to interpret the accounting, financial and economic information expressed in the annual accounts of the company, in comparison with a group of companies, with the purpose of: issue an adequate opinion or a diagnosis about the past evolution, the current situation in which it is located and the future hopes of the company. The choice of the company Pharma Mar, SA has been taken for the great contribution it has in the pharmaceutical industry and, especially, for the innovative way in which it has been investigated in the search for new medicines, since it uses organisms of marine origin to try to find a cure for the 21st century disease, cancer. On the other hand, the choice of the company Grifols is mainly due to its good position in the current market and the expected profitability offered by the company. In addition, this company was a pioneer in blood transfusions from a distance and in opening the doors of the first private blood and plasma bank in Spain. The financial information of the companies has been extracted from the official pages of the companies, in which the audited annual accounts of the companies can be found. The annual accounts are for the years 2018 and 2017, where 2016 is included. In this economic analysis we can differentiate two parts: In the first part, it is a brief analysis of the general characteristics of the pharmaceutical industry around the world and the general characteristics of the industry in Spain, to put the companies in context and for the results detailed in the second step. In addition, a brief description has been made of each of the companies, as well as where they come from and the steps they have taken to get where they are. In the second part, the annual accounts of each company will be analyzed. The study of the composition of assets, liabilities, assets and the profit and loss account, the 9.
(10) economic and financial profitability of the company, the financial structure they follow, the liquidity and solvency and the probability of bankruptcy of the company. And to finish the work, we will detail a series of conclusions that have been reached through all the characteristics of the industry and, more specifically, analyzing the characteristics of each company.. 10.
(11) Global vision of the pharmaceutical sector The medicine is one of the most valuable assets for society, helps relieve pain, cure diseases, increase life expectancy and improve the quality of this. Behind all this great work are the big companies of the pharmaceutical sector, a great power of the economy and a great source of qualified employment. The pharmaceutical industry is one of the most relevant sectors worldwide, it is responsible for monitoring, developing and marketing all the medicines we use today, not only for humans but also for animals (veterinary sector). It is an oligopoly, in which 25 companies control 50% of the industry. Within this sector we can distinguish between pharmaceutical laboratories, para-pharmacies, pharmacies and the national health and safety agency. The main characteristic of this sector is the research and development of new products with which health professionals can work (doctors, nurses, etc.). The way in which companies in the pharmaceutical industry obtain benefits is partly due to the commercialization of their products and, on the other hand, through the patent system. Globalization has had a positive effect on the benefits of pharmaceutical products, as they acquire materials in cheaper countries (developing countries) and also install new companies where costs, such as labor and taxes, are cheaper and, finally , they sell their products in developed countries that have a greater purchasing power, which translates into a higher net income. In the sector a very aggressive sales strategy is applied, it is about setting aside the small companies that can not compete with the big ones, which have a great advantage in the efforts to achieve a more advantageous policy. In addition, information on how to obtain the product can be used. Among its strategies we could highlight that in many occasions they will carry out deceptive advertising, without taking into account how harmful it can be for the consumer. They do not take into account the diseases of poor countries, they focus on the countries with more benefits, because they have higher benefits with this. With the passage of time, companies have adapted to a new technological climate and have modernized to meet the needs of the market. Professionals in this sector have also decided to train in the field of business management. The pharmaceutical 11.
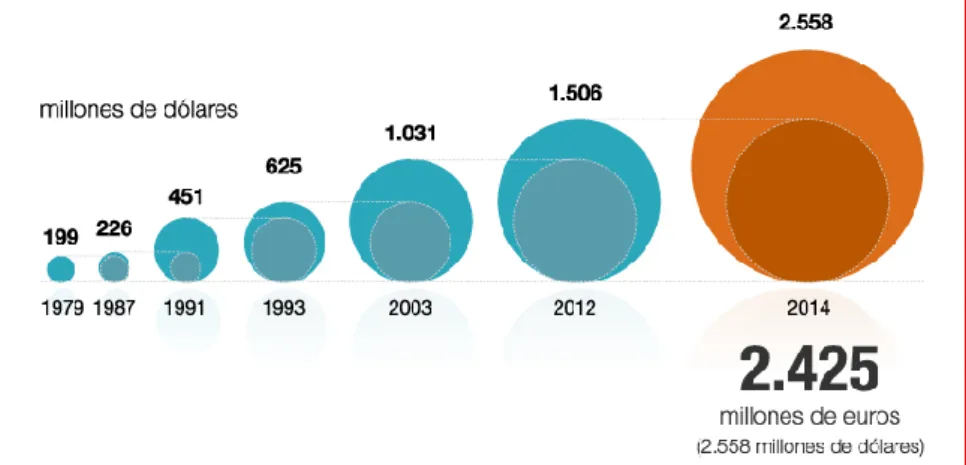
(12) companies are in charge of producing and marketing their product, therefore, apart from their knowledge in the laboratory and the analysis, they need to know the sector in which they work, the industry in which they operate, their competitors, its opportunity cost and its comparative advantages, among others, so that knowing all this is easier for them to take advantage of each situation to reach the client with the best possible offer and, therefore, improve their sales and, consequently, their benefits . In recent decades, as the years go by, the cost of the investment to develop a new drug increases compared to the previous year. In 2014, the cost of research and development of a new project was 2.558 million dollars (2.425 million euros), which in 1979 was 199 million dollars, that is, the cost multiplied by 12.12 in 35 years.. Figure 1: Evolution of drug production costs.. One of the new trends that have emerged in this sector are pharmacies or pharmacies "online", where with the emergence of social networks, users through any place and time can access the medicines they need. In this way, you can use it to market your products and increase your sales, in addition to having the ease of not having to travel to obtain the product (as long as these products do not need a recipe). "According to an article in March of this 2019 published on the Farmaindustria website, research, talent, transparency and collaboration are the keys of the sector. And of course, the technology applied to this sector must possess these qualities. " In a global vision of the sale of pharmaceutical products, the United States and Japan stand out, which increase significantly over time, above all, we must highlight the great 12.
(13) evolution that Japan presents from 2011 to 2020 (Prediction), where the result is approximately four times greater.. Figure 2: Volume of sales of the pharmaceutical industry in different areas of the world between 2011 and 2020 (thousands of dollars).. 13.
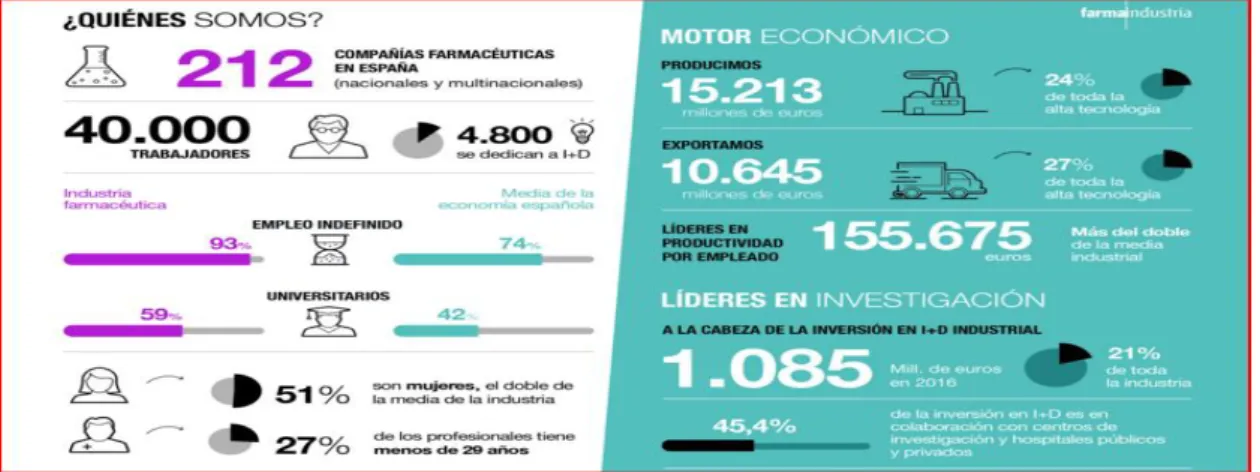
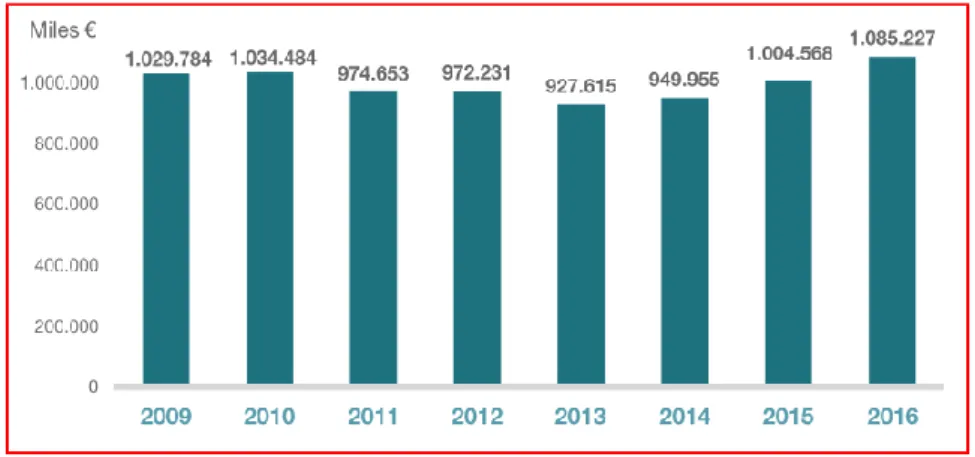
(14) The pharmaceutical sector in Spain In the Spanish economy, the pharmaceutical sector is one of the key sectors, as well as its capacity for innovation and investment in R & D projects, as well as the capacity it has to generate work. This sector has developed extraordinarily in recent years, both in Spain and in the world, with a huge volume of benefits. Every time you have the project to start manufacturing a new medicine, you must take into account that it is a very long process and that it requires a large investment, where its success is unpredictable (we do not know the degree of acceptance of the product a priori by the Consumer and if its commercialization is approved), in Spain public spending has become a project of this type by 30%, with an upward prognosis. The reality of the pharmaceutical industry in Spain is that it has more than 40,000 professionals affected by this industry, which are distributed among the 212 companies in the sector (national and Spanish multinationals), of which the majority of workers are women, and In addition, 93% of people working in this sector have an indefinite contract. With respect to the direct employment of the pharmaceutical sector, there are 200,000 people, and for each person associated with this activity there are four people who acquire the work indirectly, so that there are 800,000 people working directly or indirectly in the pharmaceutical industry.. Figure 3: General characteristics of the pharmaceutical industry (Pharmaindustry).. In addition, it is the leading sector in I + D research in Spain and a leader in productivity per employee, which is more than twice the industrial average. With 1,085 million euros invested in research centers and hospitals, it is one of the most demanding economies in our country. 14.
(15) The investment in I + D has represented in the pharmaceutical industry, which will position itself as a leader in this discipline. This investment has always been very high, although the years in which the financial crisis lasted (2008-2014) decreased with respect to previous years, until 2016 reached the maximum investment figure cited above (1,085 million).. Figure 4: Evolution of I+D expenses 2009-2016 in Spain.. In 2017, Spain reached 1,147 million euros in investment in research and development of the pharmaceutical industry, 5.7% more than the previous year according to "Farmaindustria". These data support the idea of an upward trend in companies in the pharmaceutical industry. It represents 20% of the total Spanish investment in I+D, and is the leading sector in investment in research and development according to the INE (National Institute of Statistics).. Figure 5: National Institute of Statistics. Innovation in companies.. The investment in research and development of the pharmaceutical companies is very different according to the autonomous community to which it is destined. The 15.
(16) communities of Madrid and Catalonia stand out, receiving more than one hundred million euros each, while, however, in La Rioja they do not reach one million euros and in 11 of the communities they do not exceed 10 million euros. The Valencian community receives only 31.5 million euros and is the fourth community that receives the largest investment.. Figure 6: Investment in Research and Development depending on the Autonomous Community (Spain).. 16.
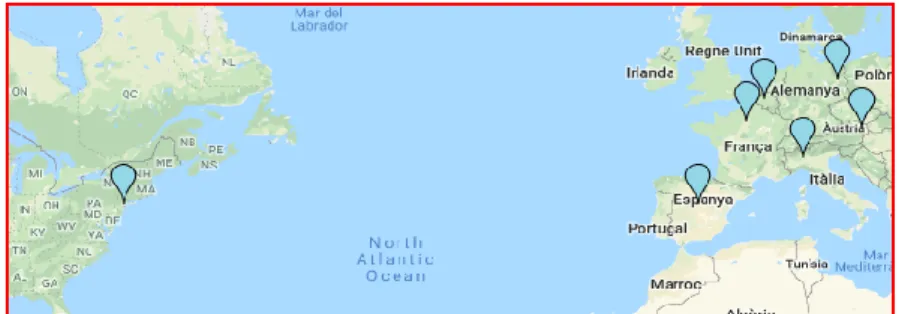
(17) PHARMA MAR S.A. In 1939 the company Zeltia was founded, a company dedicated to the research and development of medicines of animal origin and local medicinal plants. In 1963 it goes public and is sold in the Spanish market, and in 1998 it starts trading on the continuous market. In 1964, three new companies were founded: Zeltia Agraria (agricultural industry), ICI Farma (pharmaceutical industry) and Cooper Zeltia (chemical and veterinary industry). In 1986 Pharma Mar was founded. Pharma Mar S.A. is a company of the Spanish pharmaceutical industry (Art. 8 LIS), incorporated on April 30, 1986 as a public limited company, whose fiscal domicile corresponds to Madrid. The company's main activity is research, development and commercialization of bioactive principles, especially of marine origin, for its application in human medicine and especially in antitumor, antiviral, immunodulatory and tropical diseases areas, as well as management, support and promotion of its investees, mainly in the chemical and biopharmaceutical sectors. In 2007, the company received the acceptance of the European Commission to market its first compound, as a pioneer in marine medicines with Yondelis, indications of cancer, specifically for the ovary and soft tissues. This report has spread across the globe in more than 80 countries. The majority of the planet (70%) is composed of water (seas, oceans, rivers, lagoons ...), and most of the living beings live in this habitat (80%). Since the beginning of evolution, marine organisms have developed new forms of survival, attack, communication and, above all, defense, that is why this society focuses on the research of marine organisms for their new drugs. On October 30, 2015, the inverse merger between Zeltia and Pharma Mar was carried out, that is, since then the company of Zeltia has ceased to exist and Pharma Mar has become the parent company of the group. To carry out this takeover, the shareholders of Zeltia received an action from the new parent company for each share they had previously in the old company. Once the company is absorbed, Pharma Mar will be quoted on the stock exchange and will give its name to the group's price. Currently, it has six subsidiaries within the European Union (Spain, France, Germany, Italy, Belgium and Austria), and with a center of activity in the United States, number of 17.
(18) countries that it hopes to increase with internationalization, in order to : Being able to take care of the medical needs of each country inspired by the sea.. Figure 7: Subsidiaries of the company Pharma Mar S.A.. 18.
(19) GRIFOLS, S.A. In 1940 in Barcelona, Dr. Josep Antoni Grifols i Roig founded together with his children some laboratories (Grifols), whose main activity was clinical analysis, manufacture of vaccines and blood transfusions. In 1909 he founded his first laboratory of analysis, also located in Barcelona, precursor of the Grifols Laboratory. Its mission is to improve the well-being and health of all people in the world, through plasma-derived. medicines,. as well. as. providing. hospitals,. pharmacies. and. professionals with the necessary tools. With the difficulty of being able to maintain sterility in the samples, in 1916 Grifols i Roig has different models of the same analysis instrument (Vacuum flébula), which serves to obtain the asepsis condition when extracting the samples. A root of the First World War, in 1928, after the doctor's research into international blood transfusions, which patents the first instrument to perform blood transfusions remotely, transfleche flébula. In 1945, the first private blood and plasma bank in Spain, the Hemobanco of the Grifols Laboratories, for the interest of finding a better technique for plasma conservation. And in 1951, for the first time in the world, a new method was obtained to obtain plasma, the plasmaferesis technique in humans. In 1960 the first American partners joined the company. These new partners will be in charge of managing the blood banks in the United States, and after with the agreement of Dade Reagents, they decide to market their products in Spain under the name of Dade-Grifols. In 1987 there was an internal organizational organization, after the generational change of the company. This new transformation, the company becomes the Grifols Group, where there are productive companies of clinical diagnosis, production of plasma-derived products, parental solutions and the company involved in marketing the products. A year later, the company begins to expand outside Spain and opens its first subsidiary in Portugal. In 2002, the company acquired the SeraCare company and its 43 plasma donation centers in the United States. The following year, in Los Angeles, it acquires the assets of Alpha Therapeutic Corporation-Mitsubishi, with its plasma fractionation plant.. 19.
(20) Grifols starts trading on the continuous English market starting in 2006, and already in 2008 it is included in the IBEX35 listing, and in 2011, after acquiring a new American company, it starts trading on the NASDAQ.. 20.
(21) 21.
(22) Financial and Economic Analysis In this second part of the work, an economic and financial analysis will be carried out of the companies that have been selected to carry out this work, Pharma Mar S.A. and Grifols S.A. To carry out this analysis, the individual annual accounts (Balance Sheet, Profit and Loss Account, State of Changes in Equity, Statement of Cash Flows and Memorandum) of each of the companies selected have been used, during the period from 2016 to 2018. These official accounts have been obtained through the official websites of each of the companies, where all the necessary financial information is provided. The annual accounts of the two companies have been prepared in accordance with the regulations of the Account General Plan, since they are individual accounts, in the case of this accounts quote in the stock market, the must have to present the annual accounts according to international accounting regulations, NIFF-UE. In addition, the annual accounts of both companies have been audited by audit companies that are part of the "Big Four", Pharma Mar has been audited by PwC (Price Water house Coopers), and Grifols has been audited by KPMG. The opinion issued by the auditors is favorable for the two companies in the period of time studied, for this the financial information is reliable to perform the analysis and its respective comparison between two companies. For two companies to be comparable, they must use the same accounting standards, and this is true, the difference between the two is that Pharma Mar is expressed in thousands of Euros while Grifols is expressed in Euros. In order to be perfectly comparable, the annual accounts of Pharma Mar in Euros have been expressed, as has Grifols. PATRIMONIAL ANALYSIS According Archel, Lizarraga, Sánchez y Cano (2015) The purpose of the patrimonial analysis is to study the composition, evolution, tendency and balance between the different patrimonial masses of the balance.. 22.
(23) Within Balance three blocks are differentiated according to PGC (2015): 1. Assets: property, rights and other resources economically controlled by the company, as a result of past events, the expectation of the company is had benefits of economic returns in the future of these. 2.. Liabilities: current obligations arising as a result of past events, for whose extinction the company expects to divest itself of resources that may produce profits or economic returns in the future. For these purposes, provisions are understood to be included.. 3. Net Equity: Included the residual part of the assets once all liabilities have been deducted. It includes the contributions made, either at the time of their constitution or subsequent ones, by their partners or owners, who do not take into account the liabilities, as well as the accumulated results or other variations that affect them. The first step is to perform the vertical and horizontal analysis of the parts in the balance sheet. According to G. Goméz (2001), the vertical analysis consists in determining the percentage of each item of the balance sheet with respect to the total, that is, the calculation of the asset items and in what percentage they make up the total assets, and in what percentage the items of the liability and net equity make up the total of the sum of this. It is a static analysis, since it focuses on a single period. Vertical indexes of PharmaMar S.A. they would be conformed according to the following figure.. 23.
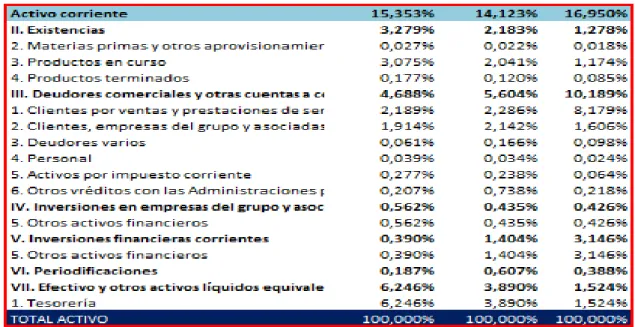
(24) Figure 8: Vertical analysis of Pharma Mar assets. As can be seen, the no current asset hold most of the total Assets with 84.65% in 2018, and within this the greatest patrimonial mass fixed by intangible immaterial, especially development, which forms 48.44% in 2018. These results match the general characteristics that the industry shows, because these companies need a lot of inversion that for the development of new products. On the other hand, the current assets in 2018 are 15.35% over the total Assets, they are distributed mainly between Cash and other equivalent assets (6.25% in 2018), Trade debtors and other accounts receivable (4, 69% in 2018) and existencies (3.28% in 2018).. 24.
(25) Figure 9: Vertical analysis of Pharma Mar liabilities and equity.. In this second Block of the Balance, Net Equity and Liability, is formed more or less by half of each one, being the net patrimony a 54.66% in 2018 of the total, where the own funds are almost the total of this percentage (53.79% in 2018), Non-current liabilities is 22.14% in 2018, current liabilities is 23.19% in 2018, formed by creditors and other accounts payable (10.54% in 2018) and current debt ( 9.81% in 2018). The vertical indexes of Grifols S.A. they would be conformed according to the following image.. 25.
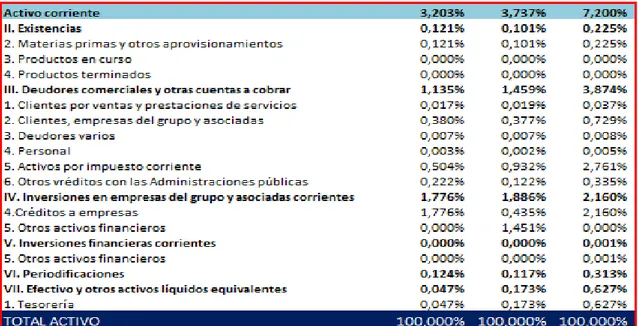
(26) Figure 10: Vertical analysis of Grifols assets.. In this case, the non-current asset comprises almost the entire asset value (96.79% in 2018) and this is formed in most of the group's investments and non-current associated (94.69% in 2018), while current assets only cover 3.2% of total assets, made up mostly of commercial debtors and other accounts receivable (1.13% in 2018) and investments in group companies and associated current (1.77% in 2018).. 26.
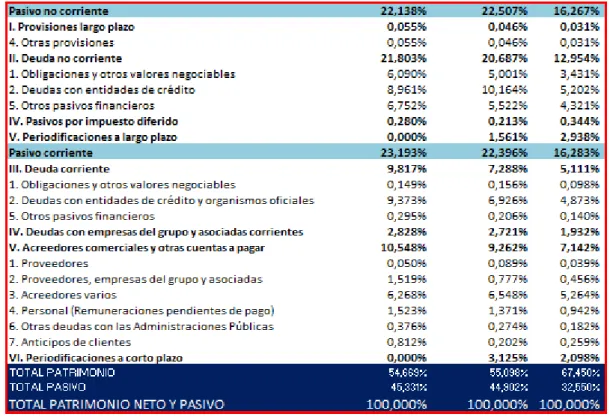
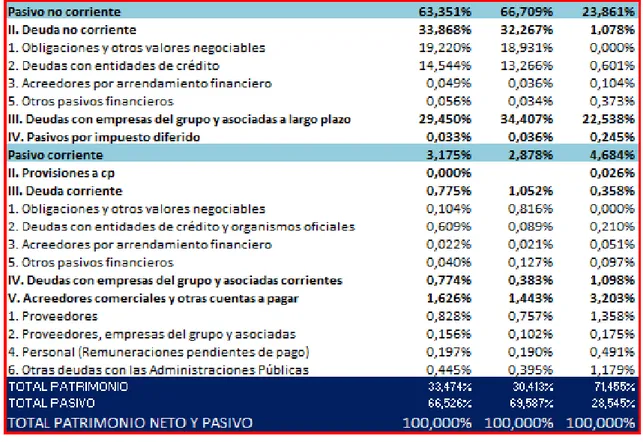
(27) Figure 11: Vertical analysis of Grifols liabilities and equity.. Within the second block of the Balance Sheet, Net equity and Liabilities, the Net Equity forms 33.47% in 2018 over the total, and within it are the own funds that make up almost the total of this. The no current liability is more or less the half of the total, being 63.35% in 2018 over the total, and the current liabilities represent 3.17% in 2018 of the total, composed mainly of non-current debt (33.86% in 2018) and debt whit group business and associates in long term (29,45 in 2018), fundamental compound by commercial Creditors and Other accounts receivable (1.62% in 2018). According to G. Gomez, the horizontal analysis consists of comparing the parts of the balance sheet in two or more consecutive periods, and comparing the increases and decreases that have occurred in the analyzed years. It is a dynamic analysis and is related to changes in time periods. Analyzing the horizontal index of the company of Pharma Mar S.A. you get the data from the following figure.. 27.
(28) Figure 12: Horizontal analysis Pharma Mar.. All horizontal indices have a negative sign, which means that they have decreased compared to the previous year. In H2017, the accounting data is compared with the 2016 data, as can be seen the largest decline in this company occurs in 2017 in net worth, which decreases by 43.96% over the previous year, and the non-current assets that decrease by 42.83% with respect to the previous year (2016). In H2018, however, except the no current assets that decreases by 9.91%, the other parts decrease by more than 10% with respect to the previous year (2017), and that decreases the noncurrent assets in a greater proportion by 18, 49%. Analyzing the horizontal index of the company of Grifols S.A. you get the data from the following figure.. Figure 13: Horizontal analysis Grifols.. In this company, you can see that in 2017 there is a positive effect with respect to 2016, since all of its items increase, highlighting mainly the increase in liabilities by 618% compared to 2016. As can be seen in the Appendix, this increase is due to an “descomunal” increase in debts. And in 2018, most of the parts were reduced, although not in an exorbitant way, highlighting the decrease of the current assets by 14.81%.. 28.
(29) ANALYSIS OF MANEUVER FUND AND OPERATING NEEDS OF FINANCING. According to D. Lorenzana (2012), the maneuver fund is the difference between current assets and current liabilities, that is, the differences that exist between shortterm collection rights and short-term payment obligations. The normal and recommended is that the working capital is positive. On the other hand, the operational financing needs are the net investments that the company needs to carry out its current operations once the financing generated by the operation itself has been deducted, according to B. Oliete (2012). Pharma Mar S.A.. Figure 14: Maneuvering fund of Pharma Mar.. In the company PharmaMar S.A., in 2016 the company presents a positive working capital, which is an efficient result for the company, since it can face its short-term obligations with the rights it has in the short term. In 2017, the situation worsens to a great extent, since positive funds in the previous year obtain a negative fund, because its short-term rights decrease by half. Finally, in 2018 a negative maneuver fund was also obtained, although better than that obtained in the previous year, due to its shortterm payment obligations have decreased.. Figure 15: Analysis of operating needs of Pharma Mar.. 29.
(30) In 2018 and 2017, the company present a negative maneuver fund and the need to count on the help to continue with the usual operations of the company, and in 2016, although a priori it will present a favorable result for having a positive result, also they need financing operational.. Grifols S.A.. Figure 16: Analysis of maneuvering fund of Grifols.. The company Grifols SA, presents in the three periods analyzed in the maneuver fund a positive result, in the first instance it can be said that the company is in a good economic situation, that it can face its short-term obligations with its short-term rights. In addition, this is increasing in the length of the analyzed periods; therefore a better result is obtained with the passage of time.. Figure 17: Analysis of operating needs of Grifols.. In the company Grifols S.A. in all the periods analyzed, the financing operations needs are lower than the maneuver fund, so the company must not resort to outside financing to continue with its normal operations of the company, it is in a good financial situation in which can cope with the situation by itself.. 30.
(31) ANALYSIS OF RENTABILITY According to J.P. Ballesta (2002), the economic profitability (ROA) of a company or the profitability of the investment is a measure, referenced at a specific time, where the performance of the assets of a company is independent of how they have been financed. Specifically, it is the ability of the company's assets to generate value independently of its financing. Economic profitability is defined as Earnings before Interest and Taxes divided whit total Assets.. Figure 18: Economic profitability formula.. The Benefit before Interest and Taxes is the result that generate all the investments, that is, all the operating expenses and income and the financial expenses and income. Within Balance is under the heading of Profit and Loss that is denominated equal. The denominator refers to the media of the total assets in the years in which it is analyzed. Regarding economic profitability, the higher the ratio that represents a better situation will be found. This must be quite large because a part of it wills retribution to the debt and to the shareholders. On the other hand, if this is zero or negative, it has a harmful effect for the company, since it would mean that the company does not manage to obtain the expected return through its assets through its main activity.. ROA PHARMA MAR S.A. 0,000000% 1. 2. -10,000000% ROA -20,000000% -30,000000% -40,000000% Figure 19: Economic profitability of Pharma Mar.. 31.
(32) The company of PharmaMar S.A. it presents a negative economic return in the periods of 2018 (Point 1) being exactly -9.18%, and 2017 (Point 2) being -33.07%. Therefore, the performance of the company has a nefarious performance, although the situation has improved from one year to the next.. ROA GRIFOLS S.A. 15,000000% 10,000000%. ROA. 5,000000% 0,000000% 1. 2. Figure 20: Economic profitability of Grifols.. The company of Grifols S.A. it presents a positive economic return in the two periods, in 2018 it presents a 9.07% (Point 1), and in 2017 it presents a 12.37% (Point2). To which the company's returns are favorable for the economic situation of the company, although from 2017 to 2018 it has reduced its profitability, a factor that it must take into account to take into account the operational activities in the future. As can be seen, the company of Grifols SA presents a better economic situation in relation to the company Pharma Mar SA that its returns are much higher, and in addition, a difference of Pharma Mar, its returns are positive, the necessary condition for the profit os the company through its main activity. Although this is the most normal way to calculate the ROA, we can verify by other procedures that this has been calculated correctly, which is the case of the multiplication of the margin by rotation. The margin can be calculated as a result before of interest and taxes, used to also to calculate the ROA, divided by the net amount of the billing. While the rotation can be calculated as, the net amount of the turnover, between the total assets means (also used in the calculation of the ROA). In this way we verify that the calculated ROA of both forms is the same:. 32.
(33) Figure 21: Verification of economic profitability.. Once these data have been calculated, the interannual variation of the ROA is analyzed. This part shows how the factors that affect the economic profitability of the company have varied between the years analyzed.. Figure 22: Annual variation of economic profitability.. The economic profitability in the company PHARMA MAR S.A. has increased by 23.90% from 2017 to 2018. This is because the company's margin has increased by 120.33% and turnover by 9.33%. Therefore, although we must take into account that they have a negative profitability, the company has improved significantly from one year to the next, so it is a positive aspect. Economic profitability has been reduced over time, because both the rotation and the margin have also been reduced too (-3.87% and -3.07% respectively). Therefore, although the company has a good economic return in the two periods, this account has been reduced over time, and this is a negative aspect. The fear that it will decrease even more in the future. The interannual variation of the ROA can be made through the margin effect, the rotation effect and the joint effect. The margin effect is the rotation of the previous year multiplied by the margin variation of that year. The rotation effect is the multiplication of the margin of the previous year by the variation of this year's rotation, and the joint 33.
(34) effect is the multiplication of the variation of the margin by the variation of the rotation. These three calculated items are added and the ROA variation check is obtained, which must be the same as the one calculated previously to make sure that it has been calculated correctly. On the other hand, the financial return (ROE) or the return on equity is a measure within a specific period of time, the yield obtained from the property rights of the company with the independence of the results. This profitability is what the shareholders and owners of the company perceive, which the managers try to maximize it for the interest of the owners. A poor financial return limits the accessibility to new funds for the company. On the one hand, investors will not be attracted to invest in the company if it does not have a good financial return and another part, it is indicative that the funds are generated internally, According J.P. Ballesta (2002). The financial profitability of a company is calculated by the coefficient between Benefits before Taxes divided by total net equity of the company.. Figure 23: Financial profitability formula.. The financial profitability can be expressed in another way to analyze it more closely as:. Figure 24: Comparation between economic and financial profitability formula.. The ROE can be broken down as the sum of the economic return, plus the differentiation between the financial return of the company and the fixed costs, multiplied by the company's liability between the net equity. The liability between equity is the effect of financial leverage, that is, the amount of debt with which they are financing. Related to this, we must take into account financial flexibility, that is, the point where the company can be financed by debt without the company having problems to face it. The sign of this factor will depend on whether the fixed costs of the company are superior to the economic profitability it has.. 34.
(35) A company that is not indebted, its economic profitability will coincide with the financial profitability. Pharma Mar S.A.. Figure 25: Financial profitability of Pharma Mar.. The company of Pharma Mar S.A. It presents a negative financial return because the result of the company is also negative, and therefore when applying the equation the result obtained is negative. A negative result reflects that shareholders are not receiving the return expected to be investing in the company, and also produces new investors feel rejected by it by not offering a good financial return. In 2017 a financial return of -54.56% is obtained and in 2018 of -18.96%, so although in both years it presents a negative situation with respect to financial profitability, at least it has managed to improve and in a large measure. The company has a large debt, that is, it is very leveraged, since in 2017 this factor represents 60.20% and in 2018 it even increases further reaching 82.14%. The margin of leverage is negative, because the ROA (previously calculated is negative), therefore if it is a negative factor you subtract something negative, even make it more negative. Therefore, since financial profitability is lower than economic profitability, it means that the average cost of the company's debts to finance its assets exceeds economic profitability.. 35.
(36) Grifols S.A.. Figure 26: Financial profitability of Grifols.. The company of Grifols S.A. It presents a positive financial return, so that the shareholders of the company are obtaining profitability by having their funds invested in this company. In 2017 a financial return of 22.53% is obtained, and in 2018 it is reduced to 19.97%, so although the profitability is positive in both years, the shareholders of the company will see reduced profitability obtained and take action on this. As can be seen, the company is very leveraged, meaning that a large part of its investments are being financed with debt, in 2017 it represents 138.60%, while in 2018 it increases by a large amount, representing 213.15% . In this case, the economic profitability of the company is positive and greater than the average financial cost of the liability, with which the margin of both years is positive, and therefore the financial profitability of the company is higher than the economic profitability of the company. Therefore, since financial profitability is greater than economic profitability, it means that the average cost of the company's debts is lower than the economic profitability that is obtained. As the company is financing part of its assets with outside resources (debt) the company has increased its financial profitability. According to E. Zamora (2017), the Threshold of Profitability represents the level of sales in which the revenues and the costs of the company coincide, that is to say, the level of sales with which a null result is obtained, "0", Therefore, it is also known as the balance point of the company.. 36.
(37) To calculate this parameter, it will be the quotient of the fixed expenses between one minus the variable expenses between the operating revenues of the company.. Figure 27: threshold of profitability formula.. Figure 28: Analysis of threshold of profitability.. The company of Grifols S.A. although up to now analyzed is the company that is in a better economic and financial situation, it needs a higher level of sales compared to Pharma Mar S.A to get breakeven (Threshold of profitability). From this point of sales, the company starts to have profits; below this company has losses, therefore, the company of Pharma Mar S.A. from the level of sales 171,693,970.15 € the company starts to have profits, on the other hand, the Grifols S.A. from the level of sales of € 263,736,026.72 the company starts to obtain benefits. But in this point, it can be seen, when comparing this data with the operational income of each company, the threshold of profitability of Pharma Mar is higher than his operating income. On the other hand, the threshold of profitability of Grifols is lower than its operating income and, therefore, it will be easier to reach that level of sales (Grifols).. 37.
(38) MATURITY PERIOD OF THE COMPANY According to S.A. Javier, the average period of maturation of a company is the average time that elapses between charging customers for the sale of products (include the time of enter the products in the warehose) and payment to suppliers of the company for the purchase of a producer to be able to face the operational activity of the company. Within the average period of maturation of the company, two aspects are distinguished: . Period of economic maturity. Referred to the time that lasts the cycle of exploitation of the company, that is to say, from the moment in which the entry of merchandise in the store of the company takes place until the invoices issued to the clients are charged.. . Period of financial maturity. Referred to the time in which the company takes to recover the capital invested in its production process.. Figure 29: Outline of the maturation period.. The average period of economic maturity is composed of the period of storage of the products plus the term of collection to customers. The storage term refers to the time that elapses since the raw materials arrive to the company until they are sold and they manage to leave the warehouse. On the other hand, the collection period is the time that elapses from when the merchandise of the company is sold to the clients until they are charged. The average period of financial maturity is the difference between the average period of economic maturity minus the payment period by the providers. The payment term. 38.
(39) refers to the time that elapses since the goods are purchased until they are paid to the suppliers. Pharma Mar S.A.. Figure 30: Maduration period of Pharma Mar.. Existences rotation is calculated as the quotient between the company's supplies between the average existences balance, and the storage term is 365 days (corresponding to the calendar year) between the existences rotation. In 2017, 445 days pass from the storage of the raw materials in the warehouse until the products are sold. In 2018 the situation worsens, since they take longer to leave the products, 504 days. Customer rotation is the quotient between the net amounts of the turnover plus the VAT (IVA) of the sale between the average balance of customers, and the term of collection of customers is 365 days between the rotations of customers. In 2017 it took around 104 days to collect the invoices that were issued to customers, in 2018 this situation improves significantly since only 41 days pass. The average term of economic maturity is the sum of both parameters, in 2017 it is 549 days, and in 2018 it is 545 days. The rotation of suppliers is the quotient between purchases plus the VAT (IVA) borne by them among the average balance of suppliers of the company. The payment term is the quotient between 365 days between the rotations of suppliers. In 2017, the average 39.
(40) term of payment to suppliers is 121 days, and in 2018, the situation improves as the payment term increases to 142 days. The period of financial maturity is the subtraction between the average period of economic maturity and the term of payment to suppliers, which in 2017 is 428 days and in 2018 is 404 days. The period of financial maturity is positive, so the period that elapses since the materials enter the warehouse until it is collected is product is greater than the collection period. Therefore, the company will need financing to continue with its natural production. Grifols S.A.. Figure 31: Maduration period of Grifols.. Existences rotation is calculated as the quotient between the company's supplies between the average existences balance, and the storage term is 365 days (corresponding to the calendar year) between the existences rotation. In 2017, 756 days pass from the storage of the raw materials in the warehouse until the products are sold. In 2018 the situation worsens, since they take longer to leave the products, 799 days. Customer rotation is the quotient between the net amounts of the turnover plus the VAT (IVA) of the sale between the average balance of customers, and the term of collection of customers is 365 days between the rotations of customers. In 2017 it took 40.
(41) around 9 days to collect the bills that were issued to customers, in 2018 this situation gets worse as 10 days pass, that is, one more day compared to the previous year. The average term of economic maturity is the sum of both parameters, in 2017 it is 766 days, and in 2018 it is 808 days. The rotation of suppliers is the quotient between purchases plus the VAT (IVA) borne by them among the average balance of suppliers of the company. The payment term is the quotient between 365 days between the rotations of suppliers. In 2017, the average payment period to suppliers is 3783 days, and in 2018, the situation improves as the payment term increases to 3967 days. The period of financial maturity is the subtraction between the average period of economic maturity and the term of payment to suppliers, which in 2017 is -3017 days and in 2018 is -3159 days. Therefore, as the maturation cycle is shorter than the payment term, the company enjoys an excess of assets to meet the payments of the debts. According to Holded (2018), financial ratios are tools that are used to analyze the financial situation of the company, to know if the company is being managed well / badly. In this analysis you will see different financial ratios, depending on the financial structure of the company and depending on the liquidity of this. “VERY IMPORTANT”. In the figures that will be analyzed next, point 1 corresponds to 2016, 2 to 2017 and 3 to 2018.. ANALYSIS OF THE FINANCIAL STRUCTURE THROUGH RATIOS The debt ratio is a fundamental tool to know the quantity and quality of a company's debt, as well as to find out if it is obtaining enough profit to support such a financial burden. This ratio is calculated through the quotient between the Company's Liabilities and the Net Equity. If you want to calculate the short-term debt, you would use the current liabilities, and in the long term, the non-current liabilities. D. Espinosa (2011).. 41.
(42) Figure 32: Debt ratio formula.. The lower this ratio, the more autonomy the company has. The interval that is considered optimal for companies is between 0.7 and 1.5. Pharma Mar S.A.. Pharma Mar S.A. ENDEUDAMIENTO 82,92%. 81,50% 48,26%. 1. 2. 3. Figure 33: Debt ratio of Pharma Mar.. The indebtedness has been increasing in the company of Pharma Mar with the passage of time. In 2016, it has a ratio of indebtedness less to the optimal interval, but given that the less this ratio is, the less complications the company has to face its debts, they are facing a good situation, because the company will have decided to finance itself differently from the debt. In the years 2017 and 2018, the debt increases slightly, and in these two years the company is within the optimum range of indebtedness, so the company is being financed largely by its debts, but without reaching a extreme level that can not stand. This is a good situation, because the company increases his profitability whit the debt.. 42.
(43) Título del eje. Pharma Mar S.A. 50,00% ENDEUDAMIENTO A CORTO PLAZO ENDEUDAMIENTO A LARGO PLAZO. 0,00% 1. 2. 3 1. 2. 3. ENDEUDAMIENTO A LARGO PLAZO. 24,12%. 40,85%. 40,49%. ENDEUDAMIENTO A CORTO PLAZO. 24,14%. 40,65%. 42,42%. Figure 34: Analysis between short and long term in the debt of Pharma Mar.. Within the debt, we have short-term debt and long-term indebtedness, which are distributed almost identical in both cases in this company. The short-term debt should be less long-term debt, as they are debts that have to cope in a short time. And this is produced in this case, for this the company not has problems to face the debt. Grifols S.A.. Grifols S.A. ENDEUDAMIENTO 228,81%. 198,74%. 39,95% 1. 2. 3. Figure 35: Debt ratio of Grifols.. The company of Grifols, presents a drastic change in its indebtedness. In 2016, it has a much lower indebtedness than the optimal interval, which, as has been said before, is a good result since the company is financing itself in a majority way that is not debt. But in the two subsequent years this increases in an exorbitant way, the company is too indebted and this directly affects the company.. 43.
(44) To see how you have to face this debt, you have to analyze what is short term and long term.. Título del eje. Grifols S.A. 500,00% ENDEUDAMIENTO A CORTO PLAZO. 0,00% 1. ENDEUDAMIENTO A LARGO PLAZO 2. 3 1. 2. 3. ENDEUDAMIENTO A LARGO PLAZO. 33,39%. 219,34%. 189,25%. ENDEUDAMIENTO A CORTO PLAZO. 6,56%. 9,46%. 9,49%. Figure 36: Analysis between short and long term in the debt of Grifols.. In 2016, the company is not heavily indebted, and short-term debt is insignificant, so the company will have no problems reconciling with it. Once the debt is analyzed more closely, we can see that in the short term the debt is small, and that the enormous amount that had grown is due to the long-term indebtedness, so the company in the short term will not have problems to deal with debts, but must take into account the amount of indebtedness that has the long term for the future. Although it should be noted that in 2018 the company has a better situation compared to the previous year. The Solvency ratio measures the ability of a company to meet its payment obligations. This can be calculated as Total Assets divided by Total Liabilities.. Figure 37: Solvency ratio formula.. The optimal value range in this ratio ranges between 1.5 and 2.5. Between these two points the company is in a correct situation to be able to face all its debts, both short and long term. If the value is higher than 2.5, it is a situation of attention, since they are offering too much guarantee to their creditors. This situation can be resolved by borrowing more with external financing. If the ratio is less than 1.5 and greater than 1, it is in a situation of caution, since in the face of a bad situation, it could not face its 44.
(45) debts. And finally, if this ratio is less than 1, the company is in technical bankruptcy. (E.Escrig (2018)).. Título del eje. Solvencia 400,00% 200,00% SOLVENCIA GRIFOLS S.A.. 0,00%. SOLVENCIA PHARMA MAR S.A.. 1. 2. 3 1. 2. 3. SOLVENCIA PHARMA MAR S.A.. 307,22%. 222,71%. 220,60%. SOLVENCIA GRIFOLS S.A.. 350,32%. 142,68%. 150,32%. Figure 38: Analisys between solvency in Pharma Mar and Grifols.. Both companies are considered solvent. In 2016, Grifols is more solvent than Pharma Mar, but both companies are facing a situation of attention, since they are even too solvent, and could increase their profitability by borrowing with outside financing. In 2017, Pharma Mar is within the optimum solvency range, however Grifols is below this range, and therefore this situation is dangerous and not knowing how to cope with it could lead to a technical bankruptcy. And in 2018, Pharma Mar is still within the optimum range even though it has reduced its solvency to a small extent, and therefore is in a good situation, and Grifols has managed to improve its situation with respect to the previous year and at that time is within the optimal range, so the company is in a good solvency situation. RATIOS BASED ON LIQUIDITY The liquidity ratio or current ratio is a tool used to see the ability of the company to meet its short-term payments. To calculate it, it is the quotient between current assets among current liabilities.. Figure 39: Liquidity ratio formula.. 45.
(46) This ratio must be greater than 1,5. If it is within the range of 1.5 and 2, the company is in the optimum liquidity condition. If it is higher than 2, the company has an excess of current assets, and could improve its situation if part of it used it correctly. If it is between 1.5 and 1, the company could end up in suspension of payments. And in the situation that is less than 1, the company would be in suspension of theoretical or technical payments. Gonzalo (2018). Pharma Mar S.A.. Pharma Mar S.A. RATIO CORRIENTE. 104,10%. 66,20%. 63,06%. 1. 2. 3. Figure 40: Liquidity ratio in Pharma Mar. In 2016, the company is above the ideal percentage of liquidity, so in this period the company is able to deal with its short-term debts. But in 2017, the company reduces its liquidity by 40%, so it is far below being in the optimal range. As has been well said, at this point the company would be in a situation of theoretical or technical suspension of payments. And in 2018, although it increases slightly, it would be in the same situation as the previous year.. 46.
(47) Grifols S.A.. Grifols S.A. RATIO CORRIENTE. 153,71% 128,92% 100,87%. 1. 2. 3. Figure 41: Liquidity ratio in Grifols.. The company has been decreasing its liquidity over the years studied, but at all times it is in a good position, so it does not pose any problem for short-term debts and could be addressed at all times. The problem of this situation is the future hope, since it has a decreasing tendency, in 2018 it is already at the edge of the good situation, and if it is expected to follow this trend, in the future it could have complications to face its payments short term. The Treasury ratio or the acid test is the relationship between the liquid assets and the realizable assets of a company with its current liabilities. Therefore, this ratio measures the ability of the company to generate sufficient liquidity with the assets available and realizable assets to pay the short-term debts. A. Peiro (2010).. Figure 42: Acid test ratio formula.. The optimal time interval is between 0.75 and 1, this is where the correct situation for the company would be found. If the ratio is greater than 1, the company has excess of available and is obtaining a less profitability than if it used it adequately. And if the ratio is less than 0.75, the company has difficulty coping with short-term debts.. 47.
(48) Pharma Mar S.A.. Pharma Mar S.A. TEST ÁCIDO 96,25%. 1. 53,32%. 52,06%. 2. 3. Figure 43: Acid test in Pharma Mar.. In accordance with the current ratio, in 2016 the company is in the right situation to be able to meet its short-term payment obligations. But in 2017, it greatly diminishes and the company, both in 2017 and 2018, faces a difficult situation in order to be able to face its short-term debts. Grifols S.A.. Grifols S.A. TEST ÁCIDO 148,91% 125,44% 97,05%. 1. 2. 3. Figure 44: Acid test in Grifols.. As with the current ratio, in 2016 the company has an excess of assets, which by allocating it to other activities could increase the profitability of the company, it is. 48.
(49) sufficiently capable of facing all its short-term debts. As it happens with 2016, in 2017 it has an excess of assets (although it has decreased slightly) and should act in the same way. And finally in 2018, the company is within the optimum range of the company, and therefore is in the best possible situation within this ratio, since it can deal with all the short-term debts of the company, and the excesses are destined to other operations with which to improve the profitability of the company.. 49.
(50) Conlusion In the present work, an economic and financial analysis of two companies of the pharmaceutical sector was carried out, in particular the company Pharma Mar SA and Grifols SA, in the period from 2016 to 2018. For this purpose, the annual accounts have been used of the companies. First, an analysis of the patrimonial structure has been carried out through vertical indexes and horizontal indexes. From this analysis, it is deduced that the in total Assets of the companies, the more part of these are of Non-Current Asset, that is, that the greater part of their assets and rights are destined to a lasting form in the company. In the case of the equity and Liabilities, in the company Pharma Mar this section is divided more or less in the same percentage, and in the company of Grifols, the majority corresponding to the non-current liabilities, that is to say the obligations are superior to the year, being the obligations less than a year no significant. In addition, it should be noted that the company Pharma Mar has seen all its global parts reduced as the years passed, On the other hand, Grifols' business in 2017 increased all of its items to a large extent, since the assets and the equity and liabilities are increased by more than 150%, and in 2018 they fell slightly, not exceeding a decrease in 2%. All these patrimonial movements are reflected in the maneuver fund (“Fondo de Maniobra”) and also in the operational financing needs. Pharma Mar in 2016 has a positive FM but not enough and for that it needs operational financing needs, but due to the decrease in the following years, a negative result is obtained, and operational financing is also needed. However, Grifols presents in every year analysis of the positive maneuver fund, related to the increase of the patrimonial masses that favor, although in 2016 it has a positive result, it would not be sufficient and it would need operational financing. As for the profitability of each company, this analysis is divided into economic profitability, financial profitability and the threshold of profitability. The economic profitability and financial profitability are completely opposite in both companies. In Pharma Mar, both returns are negative both in 2017 and 2018, but in 2018 they improved slightly compared to the previous year. In Grifols they are positive in the two years, decreasing slightly in 2018. The threshold of profitability is the level of sales that the company needs to start having benefits. The company Grifols needs a higher level of sales compared to the company of Pharma Mar to begin to have benefits, but we must bear in mind that when comparing this data with the operational income of each 50.
Figure

+7

Documento similar
In summary, in this study, the RBV is applied to explain why some companies manage eco-innovation better than others through the analysis of internal financial resources as engines
Conclusões: A partir dos dados obtidos, conclui-se que a Atividade Física acarreta diversos benefícios para os pacientes com Doença de Alzheimer, tanto física
In the preparation of this report, the Venice Commission has relied on the comments of its rapporteurs; its recently adopted Report on Respect for Democracy, Human Rights and the Rule
The purpose of the research project presented below is to analyze the financial management of a small municipality in the province of Teruel. The data under study has
In Figure 18 we present the ratio of the dust luminosity (L dust ) derived from the UV/optical SED fitting to the observed IR luminosity against the current specific SFR.. Objects
5 Putnam (1975, p. By saying this, I am not committing myself to the claim that 'water' is a.n indexica.l term, that is, tha.t 'water' behaves like indexicals in every
In other words, the severity of current, financial problems correspond with the numerous economic, political and social problems that originated between 2007-2010
Scarcity: The resources available Albani, are not very difficult to achieve, since with regard to human resources, with a good selection and training of its employees
