Coupled CO2 and O 2 driven compromises to marine life in summer along the Chilean sector of the Humboldt Current System
12
0
0
Texto completo
(2) 1184. E. Mayol et al.: Coupled CO2 and O2 -driven compromises. Orr et al., 2005), with aragonite saturation being more sensitive to ocean acidification than that for calcite. Indeed, calcification processes are already affected at aragonite values <2 (Hauri et al., 2009; Hendriks et al., 2010), although these thresholds are species-specific. Ocean acidification has received considerable attention as the main direct impact of increased ocean CO2 , but other potential impacts of increased CO2 have been overlooked. Indeed, increased CO2 and lowered pH also affect respiratory processes by driving reduced binding affinity for oxygen in blood (Pörtner et al., 2004) and a direct ventilatory sensitivity to CO2 (Burleson and Smatresk, 2000; McKendry et al., 2001). Hence, increased CO2 also poses challenges to aerobic respiration, threatening marine life, an impact observed long ago on marine fishes in controlled laboratory conditions (Powers, 1922), and recently addressed by Brewer and Peltzer (2009) in a study of the changing ocean conditions. Indeed, the efficiency of aerobic respiratory processes depends on the partial pressures of both CO2 and O2 , which are tightly coupled through the metabolic activity of marine organisms. Brewer and Peltzer (2009) indicated that the efficiency of aerobic respiratory processes is dependent on the ratio of the partial pressures of O2 and CO2 , which defines the range of conditions compatible with aerobic marine life. Hence, present concerns on the threat posed by on-going declines of marine oxygen in the ocean (Dı́az and Rosenberg, 2008; Vaquer-Sunyer and Duarte, 2008; Gilbert et al., 2010) are further aggravated by the parallel increase in CO2 (Brewer and Peltzer, 2009). Yet, the impacts of hypoxia on marine biota have been traditionally studied in isolation from the effects of increased CO2 . Brewer and Peltzer (2009) highlight the importance of studying the coupled effects of changes in both CO2 and O2 on aerobic marine life, based on the notion that elevated dissolved CO2 concentrations may impose physiological strain and less available energy on marine animals. This results from the fact that hemoglobin has an optimum pH to carry oxygen (Powers, 1922). Hence, these authors use the basic oxic respiration equation (Corg + O2 → CO2 ) associated with the free-energy relation (1G = 1G◦ −RT·ln[f CO2 ]/[Corg ][f O2 ]) to derive a Respiration Index (RI), which is used to parametrise the combined effect of O2 and CO2 on the efficiency of aerobic respiration. The RI is a simple numerical constraint that is linearly related to available energy, given by the expression: RI ≡ log10. pO2 pCO2. (1). where RI ≤ 0 corresponds to the thermodynamic aerobic limit, a formal dead zone; at RI = 0 to 0.4 aerobic respiration does not occur; the range RI = 0.4 to 0.7 represents the practical limit for aerobic respiration, and the range RI = 0.7 to 1.0 delimits the aerobic stress zone. Thus, increased CO2 aggravates the impacts of hypoxia (Brewer and Peltzer, 2009). Elevated CO2 acts as a hinge, connecting two otherwise independent threats to marine life, acidification and hypoxia. Biogeosciences, 9, 1183–1194, 2012. This connection has been poorly studied to date. The areas of the world ocean most sensitive to both these threats are upwelling regions, as they are typically low in oxygen (Grantham et al., 2004) and corrosive to carbonate structures due to high CO2 levels (Feely et al., 2008). A particularly vulnerable area is the Humboldt Current System along the Chilean coast, the largest naturally hypoxic area and an important upwelling center (Thiel et al., 2007; Ulloa and Pantoja, 2009), where CO2 , O2 and pH levels across the water column result from natural variation. In this study we examine the Chilean sector of the Humboldt Current System using data from one single summer cruise, when upwelling is typically strongest and habitat stresses greatest. Whereas the pCO2 and carbon chemistry in this region has been extensively studied in the past (Torres et al., 2002; Torres et al., 2011), the link between increased CO2 and hitherto considered independent threats to marine life, ocean acidification and hypoxia has not yet been addressed. Here we provide a first perspective of the latitudinal changes in CO2 -driven compromises to marine life over a distance of 1700 km along a very complex system. We demonstrate how RI and can be used to delineate the water masses where aerobic and calcifying organisms are stressed. Our main objective is to examine, in a predominantly along-shore transect, the connection, through increased CO2 , between challenges to respiration arising from the combination of reduced oxygen values and high pCO2 levels and challenges to calcification derived from reduced pH levels with high pCO2 levels. Increased awareness of the connection between compromises to marine biota derived from these two effects of increased CO2 , will hopefully lead to further studies on the seasonal, interannual and long-term trends of the CO2 , O2 and pH levels.. 2 2.1. Materials and methods Study site. The study was conducted along the Humboldt 2009 cruise on board the R/V Hespérides from 5 to 16 March 2009. The cruise track followed the Chilean coast, starting in the Patagonia channels (54.9◦ S) proceeding North along the Humboldt Current System until Antofagasta (Chile, 23.6◦ S, Fig. 1). The Humboldt Current System is one of the largest naturally hypoxic areas of the world’s oceans (Levin, 2002; Thiel et al., 2007; Ulloa and Pantoja, 2009), characterized by upwelling of cold, oxygen-poor waters supersaturated in CO2 (Torres et al., 2002). The Humboldt Current System is a quite complex dynamic region, characterized by the presence of a system of along-slope currents that brings waters of both tropical and subpolar origin. The dominant current is the far-offshore equatorward Humboldt Current but near shore a system of poleward and equatorward currents is found, the former formed by the Peru-Chile Counter Current and www.biogeosciences.net/9/1183/2012/.
(3) Running head: Coupled CO2 and O2 compromises to marine life E. Mayol et al.: Coupled CO2 and O2 -driven compromises. 1185. warm ENSO events, the Oxygen Minimum Layer (OML) deepens and higher oxygen concentrations in the top 100 m layer are found (Morales et al., 1999). The Humboldt Current System is controlled, to a large extent, by the coastal equatorward winds linked to the Pacific Subtropical Anticyclone. These winds drive all year long coastal upwelling along northern and central Chile, extending to southern Chile in summer. The maximum upwelling-favorable winds occur in summer, the winter-summer difference increasing with latitude. In southern Chile, beyond about 35◦ S, upwelling only occurs in summer while in winter the polar front provides downwelling-favorable winds (Thiel et al., 2007). As a result of changes in upwelling most variability occurs in the upper 150 m, therefore, affecting STW and SAAW and, to a lesser degree, ESSW (Blanco et al., 2001; Antezana, 1978); deeper waters, such as AAIW, experience much more moderate seasonal changes, in any case, not directly linked to coastal upwelling. During summer, therefore, we expect there will major near-surface coastal changes associated to the onshore and upward transport of the oxygendeficient (the Oxygen Minimum Layer, OML) and strongly CO2 supersaturated tropical and equatorial waters (in surface to reach 100 % near 23◦ S and 200 % near 30◦ S) (Torres et al., 2002). The high primary production (PP) values in the upwelling region, particularly intense near several geomorphological coastal features (Strub et al., 1998), strengthens the oxygen-minimum zone and results in CO2 supersaturated reaching near-surface waters. 2.2. A series of 15 stations spaced along the meridional cruise track were sampled. Hydrographic properties were profiled down to 1400 m depth using a Seabird 9 CTD probe. Water samples were collected at different depths (5, 15, 30, 50, 100, 200, 300, 600, 1000, 1400 m) using 12 L Niskin bottles fitted on a Rosette sampler system. Water samples were analyzed for pCO2 , O2 , and pH immediately after sampling.. 603 Fig.604 1. Cruise track (red Figure 1 line) and sampling stations (blue circles) along the Humboldt Current System (54.9◦ to 23.6◦ S).. 605. Sampling. 2.3. CO2 measurements. Cruise track (red line) and sampling stations (blue circles) alongofthe Current The partial pressure COHumboldt (pCO2 ) was mea2 in the water. System (54.9°Undercurrent to 23.6° S).and the latter by the the606 near-slope Poleward Peru-Chile Coastal Current (Strub et al., 1998; Silva et al., 607 The poleward currents are responsible for bringing 2009). Subtropical Waters (STW) and Equatorial Subsurface Waters608 (ESSW) while the equatorward flow brings Subantarctic Waters (SAAW) and Antarctic Intermediate Waters (AAIW). Each of these water masses is characterized by distinct properties, including the levels of CO2 and O2 . The Humboldt Current System, and therefore the associated CO2 and O2 levels, has substantial interannual and sea- 24 sonal cycles. Much of the variability in the biogeochemical cycles north of 35◦ S is directly driven by the interannual ENSO cycle (Halpin et al., 2004). As a result of www.biogeosciences.net/9/1183/2012/. sured using a non dispersive infrared gas analyzer (EGM4, PP systems) that measures pCO2 with a precision of ±1 ppm. For pCO2 , near surface water (about 1 m depth) was collected and passed through a gas exchange column (Mini-Module Membrane Contactor) and pCO2 measured, details of this methodology have been described elsewhere (Calleja et al., 2005; Silva et al., 2008). 2.4. O2 measurements. Oxygen concentration was analysed using high-precision Winkler titration, using a potentiometric electrode and automated endpoint detection (Mettler Toledo, DL28 titrator) (Carpenter, 1965). Biogeosciences, 9, 1183–1194, 2012.
(4) 1186. E. Mayol et al.: Coupled CO2 and O2 -driven compromises. 609 Fig. 2. Contour610 plots showing Figure the 2 variation in pCO2 , O2 and pH levels along the studied transect. The black points represent the location of the samples within the water column. 611 Contour plots showing the variation in pCO2, O2 and pH levels along the studied transect.. 2.5. 612. The black points represent the location of the samples within the water column.. pH, RI and aragonite saturation () measurements. 3. Results. 613. All seawater samples for pH, collected immediately after 3.1 Description of water masses and its associated 614 sampling the Niskin bottles for oxygen determinations, were pCO2 , O2 and pH levels siphoned into 500 mL glass bottles, allowed to overflow and 615 The ship’s meridional transect encompassed waters of equaimmediately stopped. After temperature stabilization on a ◦ torial and Antarctic origin, displaying substantial changes in water bath at 616 25 C, the pH samples were carefully transpCO2 and O2 . The surface waters, down to 100–150 m, corferred to 10 cm path-length optical glass cells (fitted with a ◦ respond to STW and SAAW, characterized by pCO2 and O2 jacket that circulates water at 25 C) to carry out the double617 concentrations close to atmospheric equilibrium and by the wavelength spectrophotometric measurements (Clayton and 618 highest pH values found in the water column (Fig. 2). ImByrne, 1993). Oxygen concentrations were converted into mediately below were the hypoxic ESSW, their thickness inpO2 and RI were calculated following Brewer and Peltzer (2009). values for aragonite saturation were calculated 25 creasing towards the Equator, where they extend from 100 m to about 300 m depth (Fig. 2). Below this layer and down from pH, pressure, temperature, salinity and alkalinity usto about 1000 m we found AAIW, characterized by much ing CO2 SYS (Pierrot et al., 2006). Because the pH-pCO2 higher oxygen concentrations (Fig. 2). The hypoxic ESSW paired couple is not a good predictor of alkalinity, total alkawere also characterized by elevated pCO2 and pH values linity was obtained from the CDIAC data base (Lamb et al., (> 1000 µatm pCO2 and <7.8 pH units, Fig. 2), while the 2001). AAIW were characterized by comparatively low pCO2 and intermediate pH values (Fig. 2). Further below we find the moderately oxygen-depleted Pacific Deep Waters (PDW). We also present three temperature-salinity diagrams with colour-coded values of the oxygen concentration (Fig. 3a), pCO2 (Fig. 3b), and pH (Fig. 3c). The oxygen-coded diagram shows interleaving between oxygen-rich AAIW and Biogeosciences, 9, 1183–1194, 2012. www.biogeosciences.net/9/1183/2012/.
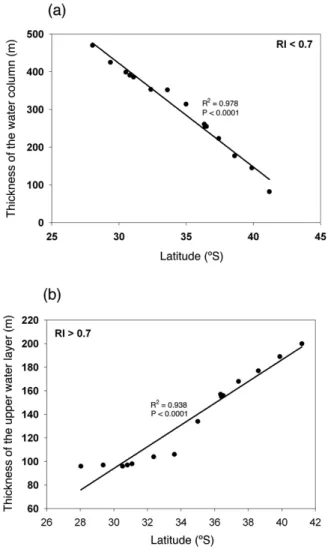
(5) Running head: Coupled CO2 and O2 compromises to marine life. E. Mayol et al.: Coupled CO2 and O2 -driven compromises. 1187. 619 Fig. 3. Temperature-salinity 620 Figure 3 diagram colour-coded for oxygen (a), pCO2 (b), and pH (c) with potential-density isolines superposed. The dashed lines in (a) illustrate the location of intermediate waters (points denser than defined by line A-A’) and their partitioning between waters of Equatorial (points above line B-B’diagram and lightercolour-coded than 27.0) andfor those of Antarctic origin2 (points to the of line 621originTemperature-salinity oxygen (a), pCO (b), and pHleft(c) withB-B’). Deep-water points are found to the right of line B-B’ and with densities higher than 27.0. Oxygen values in (a) were derived from the CTD-mounted 622 calibrated potential-density superposed. Thewhile dashed in pH (a) (c) illustrate thetolocation oxygen sensor with Winklerisolines analyses from bottle casts, pCO2lines (b) and correspond the valuesofmeasured from the bottle casts. 623 intermediate waters (points denser than defined by line A-A’) and their partitioning. 624 between waters of Equatorial origin (points above line B-B’ and lighter than 27.0) and ESSW, with the latter overlaying the former (Fig. 3a). The the RI values of the water column below 100 m by as much 625 those of Antarctic origin (points to the left of line B-B’). Deep-water points are found to the STW and SAAW surface waters have relatively large oxygen as 0.59 RI units at the oxygen minimum zone. Indeed, the concentrations, values the than thickness of the water with RI values below the 0.7 626 with rightmaximum of line B-B’ andcorresponding with densitiestohigher 27.0. Oxygen valuescolumn in (a) were derived high-latitude relatively cold SAAW (Fig. 3a). The oxygenthreshold increases greatly towards the Equator, encompass627 from the CTD-mounted oxygen sensor calibrated with Winkler analyses from bottle casts,◦ depleted equatorial subsurface waters were also charactering 1/3 of the studied water column at 28 S (Fig. 7a). It 628 while (c) correspond the values measuredtofrom the bottle ized by elevated pCO2pCO (>1000 µatmpHpCO and is important emphasize thatcasts. the pattern described also in2 (b) and 2 ; Fig. 3b) to acidic (pH <8.0) waters (Fig. 3c). Indeed, our study volves a reduction toward the Equator in the thickness of the area was 629 characterized by a strong negative relationship upper water layer that presents conditions suitable for aerobetweenpCO2 and oxygen levels, and between pCO2 and bic life (RI>0.7), declining by half between 42◦ S and 28◦ S 630 pH levels, while an opposite relationship was found between (Fig. 7b). oxygen concentrations and pH values (Fig. 4). 631 3.3 pH and saturation of aragonite levels as a threat to calcification processes 3.2 Respiration index and threatened aerobic life 632 In addition to reducing the RI values, the increased pCO2 in The respiration 633 index, which describes the adequacy of the intermediate waters also lowers pH and, therefore, the satgaseous composition of the water to maintain aerobic life, uration limit for aragonite (Fig. 8a). The aragonite saturareached a634 minimum at about 200 m depth, with the mintion levels may compromise calcification processes ( < 2) imum RI values generally decreasing towards the Equator everywhere in the top 1400 m of the water column except in (Fig. 5). These minimum RI values were below the 0.7 the uppermost 75 to 125 m, with the thickness of this surface threshold value across most of the region (Fig. 5). The 0.4 layer increasing from 42◦ S to 28◦ S, respectively (Fig. 8b). and 0.7 RI thresholds were associated with higher CO2 and 26 This pattern is opposite to that observed in RI due to the lower O2 values (O2 < 70 µmol kg−1 ; Fig. 4a). We examincrease in pCO2 in the oxygen minimum zone toward the ined the contribution of changes in pCO2 to the observed Equator, and the parallel warming of the waters that result variability in RI by holding pCO2 constant at atmospheric in increased saturation levels, by as much as 50 % across the equilibrium (Fig. 6a), and calculating the difference between 3 ◦ C meridional gradient encompassed by surface waters. the observed RI and that calculated if pCO2 was constant (Fig. 6b). This exercise showed that the increased pCO2 levels in the hypoxic water layer (observed in Fig. 5b) enhance the thickness of the water column that has RI values below the 0.7 threshold, as can be observed in Fig. 6b, and reduces www.biogeosciences.net/9/1183/2012/. Biogeosciences, 9, 1183–1194, 2012.
(6) 1188. E. Mayol et al.: Coupled CO2 and O2 -driven compromises. 635 636 Figure 4 variables: (a) O2 and pCO2 ; (b) H+ molar concentration (left axis), pH (right axis) and pCO2 ; and (c) H+ Fig. 4. Relationships between molar concentration (left axis), pH (right axis) and O2 . The linear regression equations, R 2 and P values are shown. 637. Relationships between variables: (a) O2 and pCO2; (b) H+ molar concentration (left axis),. 638 pH (right axis) and pCO2; and (c) H+ molar concentration (left axis), pH (right axis) and 2 Combined waters that flow South through both the Peru-Chile Counter 639 Othreats 2. The linear regression equations, R and P values are shown. Current and the Poleward Undercurrent. Compromises are The aragonite saturation levels ( < 2) were also observed particularly acute for aerobic organisms, as hypoxia rises 640 in most of the water column, except in the upper waters and close to the sea surface (O2 concentrations <8 µmol kg−1 in small 641 scattered water parcels below 600 m. In the northat 100 m depth in 30.51◦ S) towards the north of the study ern end of the cruise track the water depths between about area. pCO2 levels were also very high (up to 1460 ppm) in 200 and642 400 m, corresponding to ESSW, were also associassociation with the hypoxic layer. The negative relationship ated with RI values (RI < 0.7) that may compromise aerobic between CO2 and O2 levels is enhanced due to upwelling respiration (Fig. 9). The thickness of this layer reduced toin this area. The pH values decline in this area, as a typiwards the south and almost disappeared in the southern limit cal chemical response to rising CO2 levels. Therefore, the of the cruise track. In these waters the aragonite saturation positive relationship between O2 and pH is a consequence of levels were always such that they may also compromise calthe inverse relation with CO2 (Fig. 4), which is linked to O2 cification processes ( < 2) (Fig. 9). through metabolic processes and to pH through its role in the 27 seawater carbon buffer system. Indeed, the close relationship between O2 and pH allows the scaling of two threats, thus far 4 Discussion mostly treated as independent, to rising CO2 levels. 3.4. The bulk of the water column (0–1400 m) along the Chilean sector of the Humboldt Current System, where summer winds are usually favorable to upwelling events, is strongly acidic or has low RI values which compromise habitat. These waters are associated with the subsurface hypoxic Equatorial Biogeosciences, 9, 1183–1194, 2012. Llanillo et al. (2011) have recently examined the distribution of water masses along the cruise track, in particular the relation between oxygen concentration and the presence of ESSW. These authors found that ESSW are characterized by relatively high salinity and nutrient concentrations, and very www.biogeosciences.net/9/1183/2012/.
(7) E. Mayol et al.: Coupled CO2 and O2 -driven compromises Running head: Coupled CO2 and O2 compromises to marine life. 643 644 645 646 647 648 649 650 651 652 653. Figure 5. Fig. 5. (a) Vertical profile of RI for five representative stations along (a) Vertical profile of RI for five representative stations meridional ◦ the meridional transect (black: station 41.2◦ S;along red: the station 37.4transect S; (black: station 41.2° S; red: S; green: station blue: station 30.8 ° S green: station 33.6◦ S;station blue:37.4° station 30.8 ◦ S33.6° andS;light-blue: staand light-blue: station The limits by indicated graycorrespond lines correspond to the tion 28.03◦ S). The28.03° limitsS).indicated gray by lines to the different thresholds proposed by Brewer and Peltzer (2009): RI ≤ 0 corresponds different thresholds proposed by Brewer and Peltzer (2009): RI to≤the aerobic limit, a formal dead zone;aerobic RI = 0 tolimit, 0.4 aerobic respiration is not 0thermodynamic corresponds to the thermodynamic a formal dead observed; 0.7 aerobic practical limit for aerobicis respiration and RI = 0.7 zone; RIRI==00.4toto0.4 respiration not observed; RI to= 1.0 0.4aerobic to stresspractical zone. (b) Contour plotaerobic showing the variability inand RI along studied transect. 0.7 limit for respiration RI =the0.7 to 1.0 aerobic stress zone. (b) Contour plot showing the variability in RI along the studied transect.. 654 655 656 657 658. low oxygen values, leading to an extensive subsurface oxygen minimum zone as reported by previous studies (Fuenzalida et al., 2009; Silva et al., 2009). Llanillo et al. (2011) found that the ESSW, centered at 200–250 m depths, flow poleward progressively loosing their identity through mixing with the overlying SAAW and the underlying AAIW until they are no longer recognizable28at 41.6◦ S. The additional stress to biota in the hypoxic water mass of the Humboldt Current System arising from the high pCO2 levels has not been discussed earlier. Our results showed that a significant fraction of the water column along the Chilean sector of the Humboldt Current System suffers from CO2 – driven compromises to biota, including corrosive waters to calcifying organisms, stress to aerobic organisms or both. Only those waters shallower than 100 m (STW and SAAW) present conditions free of stress to aerobic organisms (Fig. 9). The threshold imposing challenges to aerobic organisms, as indicated by the RI values and particularly by RI < 0.7, was associated with O2 values below 70 µmol kg−1 . This value is slightly higher than the typical threshold for hypoxia (Gray et al., 2002), but is consistent with experimental evidence that yields a median lethal oxygen concentration among studied taxa start at 60 µmol L−1 , while the hypoxic threshold for the most resistant organisms is 25 µmol L−1 (Vaquer-Sunyer and Duarte, 2008; Keeling et al., 2010). This challenge is highly increased by consideration of the increased pCO2 levels, which lowered the RI value by up to 0.59 RI units and increased the thickness of the water column with RI < 0.7. Hence, our results concur with those of Brewer and Peltzer (2009) to suggest that increased pCO2 levels aggravate the www.biogeosciences.net/9/1183/2012/. 1189 challenges to aerobic organisms in oxygen deficient waters, such as those in the Humboldt Current System. Whereas our study represents a quasi-synoptic assessment of the extent of challenges derived from pCO2 , and associated pH levels, and O2 in the water column of the Humboldt Current System, these were expected to be highly dynamic. The oxygen minimum of the Humboldt Current System shows seasonal and interannual variability, driven by upwelling events and large-scale perturbations in regional circulation, such as those accompanying El Niño events. The oxygen content in the top 100 m layer is higher in the region during El Niño events (Morales et al., 1999; Ulloa et al., 2001). In addition to seasonal and interannual oscillations, the CO2 -driven challenges to biota reported here are expected to increase in the future. AtmosphericpCO2 levels are expected to reach 700 to 1000 ppm by the end of the 21st Century (Meehl et al., 2007), with an increase inpCO2 at depth more than 1000 µatm in the Pacific (Brewer and Peltzer, 2009), resulting in a spread of the respiratory challenges to aerobic organisms. The corresponding pH levels are expected to continue to decline, being reduced by 0.3 units below present values by the end of the 21st Century and by up to 0.7 units by 2300 (Caldeira and Wickett, 2003; Doney et al., 2009). In addition, oxygen concentrations are declining in many areas of the ocean (Stramma et al., 2008; Keeling et al., 2010), further affecting the RI ratio. The area where biocalcification processes may be close to being compromised can be delineated from the water column with saturation levels, for aragonite <2 (cf. Orr et al., 2005; Yates and Halley, 2006; Guinotte and Fabry, 2008; Hauri et al., 2009, Hendriks et al., 2010), which encompasses most of the water column except for the upper layer (above 70 m). The thickness of the water column where biocalcification processes may be impacted is largest at mid-latitudes (between about 30 and 37◦ S) and decreases slowly towards high latitudes and rapidly towards the Equator. This swift change in the equatorial region is opposite to what happens to the layer where aerobic respiration is compromised. The preindustrial conditions (CO2 level of around 260–270 ppmv (Wigley, 1983), and ocean temperatures approximately 1 ◦ C lower than at present (Hughes, 2000)) suggest that for aragonite in the surface of the ocean could have been 0.2 units higher than present (calculations not shown). Reduced aragonite saturation levels and RI, are driven by pCO2 , each includes a second, independent, driver: temperature in the case of biocalcification and oxygen concentration in the case of aerobic respiration. pCO2 acts, therefore, as a hinge connecting respiratory and calcification challenges. In summary, ocean acidification affects most waters below 150 m, while respiratory compromises are located within the 200 to 400 m layer (Fig. 9). These two challenges show similar trends at mid and high latitudes but have opposite trends within equatorial waters. The whole cruise track carried out in summer was influenced by upwelling, but yet the temperature displayed a significant latitudinal gradient at all depths. Biogeosciences, 9, 1183–1194, 2012.
(8) 1190. E. Mayol et al.: Coupled CO2 and O2 -driven compromises. 659 Fig. 6. Contour showing6the distribution of (a) the calculated RI assuming a constant pCO2 in atmospheric equilibrium (385 µatm) and 660 plotFigure (b) the difference between the calculated RI and that observed along the studied transect.. 661. Contour plot showing the distribution of (a) the calculated RI assuming a constant pCO2 in. 662 atmospheric µatm) in and difference between theare calculated RI major and fisheries, with These upwelling centers the site for This clearly must have affectedequilibrium the chemical(385 processes the(b) the catches that represent 40 % of the annual landings of the water column, for observed example the O2the solubility, which in663 as that along studied transect. creases with lower temperatures (Keeling et al., 2010). In Humboldt Current System (Thiel et al., 2007). Along the 664 Humboldt Current System about 40 important commercial general, the subsurface depth layer is affected by biocalcifispecies of fishes, crustaceans, molluscs, echinoderms and cation and hypoxia, its thickness being maximum at low latseaweeds are found (Montecino and Lange, 2009). Our itudes (200665 to 400 m) and decreasing to nearly zero at high study showed that the extent of the threats toward the surlatitudes (Fig. 9), which is consistent with the increase of the 666 face layer is presumably larger towards the coast when deep ESSW thickness towards the Equator and in summer (Blanco et al., 2001). The habitat free of CO -driven stresses was reupwelling events, reaching ESSW layers, are most intense. 2 667 These events could lead to RI and values closer to the stricted to the upper mixed layer and to small water parcels threshold values that compromise marine life, therefore posat about 1000 m depth (Fig. 9). Increased pCO in the future 2 668 sibly affecting the large fisheries supported at these sites. may increase the thickness of the water column with both Additionally, events associated with changes in temperature RI and aragonite saturation reaching values under the thresh669 old that compromises marine life, therefore, compressing the and O2 levels, such as El Niño, have been extremely adverse 670 of the stress-free habitat. on anchovy and positive on sardine populations (Alheit and vertical extent Bernal, 1993). It is likely that these events are also assoProbably, both the aragonite saturation threshold for bio671and the threshold RI affecting respiration vary ciated with concurrent changes in CO2 levels, leading to a calcification compression of the habitat suitable for aerobic organisms. across taxa (cf. Hendriks et al., 2010 and Vaquer-Sunyer and 672 Duarte, 2008, respectively), depending on their metabolic caPörtner and Langenbuch (2005) have described mechapacities. Indeed, whereas most metazoans are excluded from nisms of short and long-term sensitivity to CO2 in fish and 673 the oxygen minimum zone of the Humboldt Current System, have shown how elevated CO2 levels, particularly when comspecialized674 crustacean communities, including copepods and bined with other factors, may become a life risk for different euphasids, have been reported to enter this hypoxic layer (Esorganisms. The trends towards increased pCO2 and reduced cribano et 675 al., 2009). The temperature also is a factor that O2 concentrations in the future may compress the water colmay lead to a differentiated biological resistance to the RI umn available for aerobic organisms and expand the minithreshold. Higher temperatures are mostly associated with mum oxygen zone until zones where fisheries species, such higher metabolic rates and respiration (Doney et al., 2012). as the Humboldt squid and fish species, are located. Therefore, organisms affected by the same RI value could be 29 more stressed in the North of Chile. Use of the RI value as a predictive tool to evaluate and project the impact of increased 5 Conclusions pCO2 on aerobic organisms in this region requires, therefore, experimental evidence of the RI thresholds for aerobic respiIn this study we presented the risk for aerobic and calcifyration of the main taxa in the ecosystem. ing marine organisms associated to high pCO2 and low O2 The most intense upwelling in Chile takes place near levels. The study was centered in an area naturally low in oxygen and with high pCO2 levels, potentially corrosive to small capes and bays, where subsurface waters are excarbonate structures. The main point of this manuscript is to ported offshore by ∼125 km (Fonseca and Farias, 1987).. Biogeosciences, 9, 1183–1194, 2012. www.biogeosciences.net/9/1183/2012/.
(9) Running head: Coupled CO2 and O2 compromises to marine life. E. Mayol et al.: Coupled CO2 and O2 -driven compromises. 1191. 680 676 677 678 679. Fig.8 8. (a) Contour plot showing the distribution of aragonite saturaFigure tion index (), where the limits indicated by gray lines correspond Fig. 7. Relationships between the thickness of the water column 682 (a) Contour plot showing the distribution of aragonite saturation (Ω), where the to the thresholds of aragonite saturation ( = 1 and 2). (b)index ThickFigure and7 latitude: (a) RI <0.7 in the top 1400 m; (b) RI > 0.7 in the top ness of the water column with < 2 along the studied transect. 683 indicated by gray lines correspond to the thresholds of aragonite saturation (Ω = 1 an 200 m. 681. Relationships between the thickness of the water column and latitude: (a) RI < 0.7 in the top 1,400 m; (b) RI > 0.7 in the top 200 m.. 684. 685 examine the co-variation between30pCO2 and O2 to explore how ocean acidification and hypoxia trends are not indepen686 dent threats, but are connected to one another through the effect of CO2 on both respiratory activity and calcification rates. With this purpose we extended the thermodynamic model of Brewer and Peltzer (2009) on joint effects of pCO2 and O2 on respiration to also address the effects of pCO2 , pH and calcification. With the definition of the RI index (respiration index) and saturation states of aragonite, we have attempted to delineate water masses in the Humboldt Current System where respiration and calcification may be compromised. This study can be used as a predictive model of the future situation that oceans are likely to exhibit, when considering the expected trends in the evolution of both O2 and pCO2 levels. Relating pCO2 and O2 values by means of the respiration index is key in understanding the dimension of the threat that aerobic organisms are faced with. The distribution. www.biogeosciences.net/9/1183/2012/. (b) Thickness of the water column with Ω < 2 along the studied transect.. of this index indeed shows that high pCO2 contributes to exacerbate the challenges to respiration in Humboldt Current System. As well as this respiratory threat, it is also necessary to take into account the stress inflicted upon calcifying processes, associated with increased pCO2 levels, resulting 31 in decreased pH levels and low saturation levels for aragonite, where calcification may be compromised. The RI and the saturation state of aragonite have been used in this work as predictive tools to evaluate and project the impact of increased pCO2 on aerobic and calcifying organisms, showing that along the Chilean sector of the Humboldt Current System the habitat free of CO2 -driven stresses was restricted to the upper mixed layer and to small water parcels at about 1000 m depth.. Biogeosciences, 9, 1183–1194, 2012.
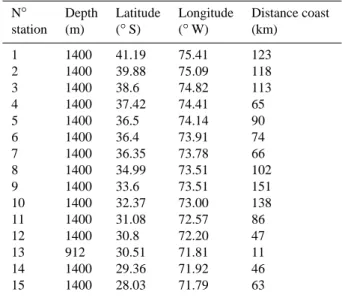
(10) 1192. Running head: Coupled CO2 and O2 compromises to marine life. E. Mayol et al.: Coupled CO2 and O2 -driven compromises Hespérides for help during the cruise. We thank E. T. Peltzer, F. Millero and P. Llanillo for assistance with calculations. E. M. was supported by a JAE fellowship from CSIC. Edited by: K. Suzuki. References. 687 688 689 690 691 692 693 694 695. Figure 9. Fig. 9. Distribution of compromises (biocalcification Distribution of compromises (biocalcification compromised, Ω < 2; compromised, aerobic respiration compromised, < 2; aerobic compromised, < 0.7) to marine RI <respiration 0.7) to marine life along the RI studied transect. +/+ = life both along the studied transect. +/+ = +/both biocalcification and respibiocalcification and respiration compromised; = only biocalcification compromised; -/ration compromised; +/-combination = only biocalcification compromised; = no compromises. The missing (-/+ = only respiration compromised) was-/not =observed. no compromises. The missing combination (-/+ = only respiraNote that the 28º station had data only at 200 and 600 m depths, therefore the tion compromised) was not observed. Note that the 28◦ station had region with compromises to both biocalcification and respiration was likely missed by the data only at 200 and 600 m depths, therefore, the region with comdata; this region is hatched with vertical lines. promises to both biocalcification and respiration was likely missed by the data; this region is hatched with vertical lines.. Table 1. Depth, position and distance to the coast for each station. N◦ station. Depth (m). Latitude (◦ S). 1 2 3 4 5 6 7 8 9 10 11 12 13 14 15. 1400 1400 1400 1400 1400 1400 1400 1400 1400 1400 1400 1400 912 1400 1400. 41.19 39.88 38.6 37.42 36.5 36.4 36.35 34.99 33.6 32.37 31.08 30.8 30.51 29.36 28.03. 32Longitude. (◦ W). Distance coast (km). 75.41 75.09 74.82 74.41 74.14 73.91 73.78 73.51 73.51 73.00 72.57 72.20 71.81 71.92 71.79. 123 118 113 65 90 74 66 102 151 138 86 47 11 46 63. Acknowledgements. This is a contribution to the Humboldt-2009 project, funded by the Spanish Ministry of Science and Innovation (ref. CTM2009-02497-E/MA) and was also supported by funding from the LINCGlobal (PUC-CSIC). We thank the cruise participants, UTM technicians, crew and commander of R/V. Biogeosciences, 9, 1183–1194, 2012. Alheit, J. and Bernal, P.: Effects of physical and biological changes on the biomass yield of the Humboldt current system, Large Marine Ecosystems, Am. Assoc. Adv. Sci. Press, Washington DC, 53–68, 1993. Antezana, T.: Distribution of Euphasiids in the Chile-Peru current with particular reference to the endemic Euphausia mucronata and oxygen minima layer, Ph.D. Thesis, University of California, 1978. Berner, R. A.: Examination of hypotheses for the Permo-Triassic boundary extinction by carbon cycle modeling, P. Natl. Acad. Sci. USA, 99, 4172–4177, doi:10.1073/pnas.032095199, 2002. Blanco, J. L., Thomas, A. C., Carr, M.-E., and Strub P. T.: Seasonal climatology of hydrographic conditions in the upwelling region off northern Chile, J. Geophys. Res., 106, 11451–11467, 2001. Brewer, P. G. and Peltzer, E. T.: Limits to marine life, Science, 321, 347–348, doi:10.1126/science.1170756, 2009. Broecker, W. S., Takahashi, T., and Peng, T.-H.: Reconstruction of the past atmospheric CO2 contents of the contemporary ocean: an evaluation, Technical Report, 1985. Burleson, M. L. and Smatresk, N. J.: Branchial chemoreceptors mediate ventilatory response to hypercapnic acidosis in channel catfish, Comp. Biochem. Phys. A., 125, 403–414, doi:10.1016/S1095-6433(00)00167-7, 2000. Caldeira, K. and Wickett, M. E.: Anthropogenic carbon and ocean pH, Nature, 425, 365, 2003. Calleja, M. L., Duarte, C. M., Navarro, N., and Agustı́, S.: Control of air-sea CO2 disequilibria in the subtropical NE Atlantic by planktonic metabolism under the ocean skin, Geophys. Res. Lett., 32, L08606, doi:10.1029/2004GL022120, 2005. Carpenter, J. H.: The accuracy of the Winkler method for dissolved oxygen analysis, Limnol. Oceanogr., 10, 135–140, 1965. Clayton, T. D. and Byrne, R. H.: Spectrophotometric seawater pH measurements: total hydrogen ion concentration scale calibration of m-cresol purple and at-sea results, Deep-Sea Res. Pt. I., 40, 2115–2129, doi:10.1016/0967-0637(93)90048-8, 1993. Diaz, R. J. and Rosenberg, R.: Spreading dead zones and consequences for marine ecosystems, Science, 321, 926–929, doi:10.1126/science.1156401, 2008. Doney, S. C., Fabry, V. J., Feely, R. A., and Kleypas, J. A.: Ocean acidification: the other CO2 problem, Annu. Rev. Mar. Sci., 1, 169–192, doi:10.1146/annurev.marine.010908.163834, 2009. Doney, S. C., Ruckelshaus, M., Duffy, J. E., Barry, J. P., Chan, F., English, C. A., Galindo, H. M., Grebmeier, J. M., Hollowed, A. B., Knowlton, N., Polovina. J., Rabalais, N. N., Sydeman, W. J., and Talley, L. D.: Climate change impacts on marine ecosystems, Annu. Rev. Mar. Sci., 4, 4.1–4.27, doi:10.1146/annurev-marine041911-111611, 2012. Dudley, R.: Atmospheric oxygen, giant paleozoic insects and the evolution of aerial locomotor performance, J. Exp. Biol., 201, 1043–1050, 1998.. www.biogeosciences.net/9/1183/2012/.
(11) E. Mayol et al.: Coupled CO2 and O2 -driven compromises Escribano, R., Hidalgo, P., and Krautz, C.: Zooplankton associated with the oxygen minimum zone system in the northern upwelling region of Chile during march 2000, Deep-Sea Res. Pt. II, 56, 1083–1094, doi:10.1016/j.dsr2.2008.09.009, 2009. Feely, R. A., Sabine, C. L., Lee, K., Berelson, W., Kleypas, J., Fabry, V. J., and Millero, F. J.: Impact of anthropogenic CO2 on the CaCO3 system in the oceans, Science, 305, 362–366, doi:10.1126/science.1097329, 2004. Feely, R. A., Sabine, C. L., Hernandez-Ayon, J. M., Ianson, D., and Hales, B.: Evidence for upwelling of corrosive “acidified” water onto the continental shelf, Science, 320, 1490–1492, doi:10.1126/science.1155676, 2008. Fonseca, T. and Farı́as, M.: Estudio del proceso de surgencia en la costa chilena utilizando percepción remota, Investigación Pesquera (Chile), 34, 33–46, 1987. Fuenzalida, R., Schneider, W., Garcés-Vargas, J., Bravo, L., and Lange, C.: Vertical and horizontal extension of the oxygen minimum zone in the eastern South Pacific Ocean, Deep-Sea Res. Pt. II, 56, 992–1003, doi:10.1016/j.dsr2.2008.11.001, 2009. Gilbert, D., Rabalais, N. N., Dı́az, R. J., and Zhang, J.: Evidence for greater oxygen decline rates in the coastal ocean than in the open ocean, Biogeosciences, 7, 2283–2296, doi:10.5194/bg-72283-2010, 2010. Grantham, B. A., Chan, F., Nielsen, K. J., Fox, D. S., Barth, J. A., Huyer, A., Lubchenco, J., and Menge, B. A.: Upwellingdriven nearshore hypoxia signals ecosystem and oceanographic changes in the northeast Pacific, Nature, 429, 749–754, doi:10.1038/nature02605, 2004. Gray, J. S., Wu, R. S. S., and Or, Y. Y.: Effects of hypoxia and organic enrichment on the coastal marine environment, Mar. Ecol.Prog. Ser., 238, 249–79, 2002. Guinotte, J. M. and Fabry, V. J.: Ocean acidification and its potential effects on marine ecosystems, Ann. NY Acad. Sci., 1134, 320– 342, doi: 10.1196/annals.1439.013, 2008. Halpin, P. M., Strub, P. T., Peterson, W. T., and Baumgartner, T. R.: An overview of interactions among oceanography, marine ecosystems, climatic and human disruptions along the eastern margins of the Pacific Ocean, Rev. Chil. Hist. Nat., 77, 371–409, 2004. Hauri, C., Gruber, N., Plattner, G.-K., Alin, S., Feely, R. A., Hales, B., and Wheeler, P. A.: Ocean acidification in the California Current System, Oceanography, 22, 58–69, doi:10.5670/oceanog.2009.97, 2009. Hendriks, I. E., Duarte, C. M., and Álvarez, M.: Vulnerability of marine biodiversity to ocean acidification: a meta-analysis, Estuar, Coast. Shelf S., 86, 157–164, doi:10.1016/j.ecss.2009.11.022, 2010. Hughes, L.: Biological consequences of global warming: is the signal already, Trends Ecol. Evol., 15, 56–61, doi:10.1016/S01695347(99)01764-4, 2000. Keeling, R. F., Körtzinger, A., and Gruber, N.: Ocean deoxygenation in a warming world, Annual Review of Marine Science, 2, 199–229, doi:10.1146/annurev.marine.010908.163855, 2010. Lamb, M. F., Sabine, C. L., Feely, R. A., Wanninkhof, R., Key, R. M., Johnson, G. C., Millero, F. J., Lee, K., Peng, T.-H., Kozyr, A., Bullister, J. L., Greeley, D., Byrne, R. H., Chipman, D. W., Dickson, A. G., Goyet, C., Guenther, P. R., Ishii, M., Johnson, K. M., Keeling, C. D., Ono, T., Shitashima, K., Tilbrook, B., Takahashi, T., Wallace, D. W. R., Watanabe, Y. W., Winn, C., and. www.biogeosciences.net/9/1183/2012/. 1193 Wong, C. S.: Consistency and synthesis of Pacific Ocean CO2 survey data, Deep Sea Res. Pt. II, 49, 21–58, doi:10.1016/S09670645(01)00093-5, 2001. Levin, L. A.: Deep-ocean life where oxygen is scarse, Am. Sci., 90, 436–444, 2002. Llanillo, P., Pelegr, J. L., Duarte, C. M., Emelianov, M., Gasser, M., Gourrion, J., and Rodrı́guez-Santana, A.: Meridional and zonal changes in water properties along the continental slope off central and northern Chile, Cienc. Mar., 38(2B), in press, 2012. Lüthi, D., Le Floch, M., Bereiter, B., Blunier, T., Barnola, J. M., Siegenthaler, U., Raynaud, D., Jouzel, J., Fischer, H., Kawamura, K., and Stocker, T. F.: High-resolution carbon dioxide concentration record 650 000–800 000 years before present, Nature, 453, 379–382, doi:10.1038/nature06949, 2008. McKendry, J. E., Milsom, W. K., and Perry, S. F.: Branchial CO2 receptors and cardiorespiratory adjustments during hypercarbia in Pacific spiny dogfish (Squalus acanthias), J. Exp. Biol., 204, 1519–1527, 2001. Meehl, G. A., Stocker, T. F., Collins, W. D., Friedlingstein, P., Gaye, A. T., Gregory, J. M., Kitoh, A., Knutti, R., Murphy, J. M., Noda, A., Raper, S. C. B., Watterson, I. G., Weaver, A. J., and Zhao, Z.-C.: Global climate projections, in: climate change 2007: the physical science basis. Contribution of working group I to the fourth assessment report of the intergovernmental panel on climate change , edited by: Solomon, S., Qin, D., Manning, M., Chen, Z., Marquis, M., Averyt, K. B., Tignor, M., and Miller, H. L., Cambridge University Press, Cambridge, United Kingdom and New York, NY, USA, 2007. Montecino, V. and Lange, C. B.: The Humboldt Current System: Ecosystem components and processes, fisheries, and sediment studies, Prog. Oceanogr., 83, 65–79, doi:10.1016/j.pocean.2009.07.041, 2009. Morales, C. E., Hormazábal, S. E., and Blanco, J. L.: Interannual variability in the mesoscale distribution of the depth of the upper boundary of the oxygen minimum layer off northern Chile (18-24S): implications for the pelagic system and biogeochemical cycling, J. Mar. Res., 57, 909–932, 1999. Orr, J. C., Fabry, V. J., Aumont, O., Bopp, L., Doney, S. C., Feely, R. A., Gnanadesikan, A., Gruber, N., Ishida, A., Joos, F., Key, R. M., Lindsay, K., Maier-Reimer, E., Matear, R., Monfray, P., Mouchet, A., Najjar, R. G., Plattner, G.-K., Rodgers, K. B., Sabine, C. L., Sarmiento, J. L., Schlitzer, R., Slater, R. D., Totterdell, I. J., Weirig, M.-F., Yamanaka, Y., and Yool, A.: Anthropogenic ocean acidification over the twenty-first century and its impact on calcifying organisms, Nature, 437, 681–686, doi:10.1038/nature04095, 2005. Pierrot, D., Lewis, E., and Wallace, D. W. R.: MS Excel program developed for CO2 system calculations. ORNL/CDIAC-105A. Carbon dioxide information analysis center, Oak Ridge National Laboratory, U.S., Department of Energy, Oak Ridge, Tennessee, 2006. Pörtner, H. O. and Langenbuch, M.: Synergistic effects of temperature extremes, hypoxia, and increases in CO2 on marine animals: from Earth history to global change, J. Geophys. Res., 110, C09S10, doi:10.1029/2004JC002561, 2005. Pörtner, H. O., Langenbuch, M., and Reipschläger, A.: Biological impact of elevated ocean CO2 concentrations: lessons from animal physiology and Earth history, J. Oceanogr., 60, 705–718, doi: 10.1007/s10872-004-5763-0, 2004.. Biogeosciences, 9, 1183–1194, 2012.
(12) 1194 Powers, E. B.: The physiology of the respiration of fishes relation to the hydrogen ion concentration of the medium, J. Gen. Physiol., 4, 305–317, 1922. Sabine, C. L., Feely, R. A., Gruber, N., Key, R. M., Lee, K., Bullister, J. L., Wanninkhof, R., Wong, C. S., Wallace, D. W. R., Tilbrook, B., Millero, F. J., Peng, T.-H., Kozyr, A., Ono, T., and Rios, A. F.: The oceanic sink for anthropogenic CO2 , Science, 305, 367–371, doi: 10.1126/science.1097403, 2004. Silva, J., Feijóo, P., and Santos, R.: Underwater measurements of carbon dioxide evolution in marine plant communities: a new method, Estuar, Coast. Shelf S., 78, 827–830, doi:10.1016/j.ecss.2008.02.019, 2008. Silva, N., Rojas, N., and Fedele, A.: Water masses in the Humboldt Current System: properties, distribution, and the nitrate deficit as a chemical water mass tracer for Equatorial Subsurface Water off Chile, Deep-Sea Res. Pt. II, 56, 1004–1020, doi:10.1016/j.dsr2.2008.12.013, 2009. Stramma, L., Johnson, G. C., Sprintall, J., and Mohrholz, V.: Expanding oxygen-minimum zones in the Tropical Oceans, Science, 320, 655–658, doi: 10.1126/science.1153847, 2008. Strub P. T., Mesı́as, J. M., Montecino, V., Rutlant, J., and Salinas, S.: Coastal ocean circulation off western South America, The sea, 11, 273–313, 1998. Thiel, M., Macaya, E. C., Acuna, E., Arntz, W. E., Bastias, H., Brokordt, K., Camus, P. A., Castilla, J. C., Castro, L. R., Cortes, M., Dumont, C. P., Escribano, R., Fernandez, M., Gajardo, J. A., Gaymer, C. F., Gomez, I., Gonzalez, A. E., Gonzalez, H. E., Haye, P. A., Illanes, J.-E., Iriarte, J. L., Lancellotti, D. A., LunaJorquera, G., Luxoro, C., Manriquez, P. H., Marin, V., Munoz, P., Navarrete, S. A., Perez, E., Poulin, E., Sellanes, J., Hito Sepulveda, H., Stotz, W., Tala, F., Thomas, A., Vargas, C. A., Vasquez, J. A., and Vega, J. M. A.: The Humboldt Current System of northern and central Chile: oceanographic processes, ecological interactions and socioeconomic feedback, Oceanogr. Mar. Biol., 45, 195–344, 2007.. Biogeosciences, 9, 1183–1194, 2012. E. Mayol et al.: Coupled CO2 and O2 -driven compromises Torres, R., Turner, D., Rutllant, J., Sobarzo, M., Antezana, T., and Gonzalez, H. E.: CO2 outgassing off central Chile (31– 30◦ S) and northern Chile (24–23◦ S) during austral summer 1997: the effect of wind intensity on the upwelling and ventilation of CO2 - rich waters, Deep-Sea Res. Pt. I, 49, 1413–1429, doi:10.1016/S0967-0637(02)00034-1, 2002. Torres, R., Pantoja, S., Harada, N., González, H. E., Daneri, G., Frangopulos, M., Ratllant, J. A., Duarte, C. M., Rúiz-Halpern, S., Mayol, E., and Fukasawa, M.: Air-sea CO2 fluxes along the coast of Chile: From CO2 outgassing in central northern upwelling waters to CO2 uptake in southern Patagonian fjords, J. Geophys. Res., 116, C09006, doi:10.1029/2010JC006344, 2011. Ulloa, O. and Pantoja, S.: The oxygen minimum zone of the eastern South Pacific, Deep-Sea Res. Pt. II, 56, 987–991, doi:10.1016/j.dsr2.2008.12.004, 2009. Ulloa, O., Escribano, R., Hormazabal, S., Quiñones, R. A., González, R. R., and Ramos, M.: Evolution and biological effects of the 1997-98 El Niño in the upwelling ecosystem off northern Chile, Geophys. Res. Lett., 28, 1591–1594, doi:10.1029/2000GL011548, 2001. Vaquer-Sunyer, R. and Duarte, C. M.: Thresholds of hipoxia for marine biodiversity, P. Natl. Acad. Sci. USA, 105, 15452–15457, doi: 10.1073/pnas.0803833105, 2008. Wigley, T. M. L.: The pre-industrial carbon dioxide level, Climatic Change, 5, 315–320, doi:10.1007/BF02423528, 1983. Yates, K. K. and Halley, R. B.: CO2− 3 concentration and pCO2 thresholds for calcification and dissolution on the Molokai reef flat, Hawaii, Biogeosciences, 3, 357–369, doi:10.5194/bg-3-3572006, 2006.. www.biogeosciences.net/9/1183/2012/.
(13)
Figure
Documento similar
MD simulations in this and previous work has allowed us to propose a relation between the nature of the interactions at the interface and the observed properties of nanofluids:
Government policy varies between nations and this guidance sets out the need for balanced decision-making about ways of working, and the ongoing safety considerations
alteration of marine circulation patterns, the abundance, distribution, and structure of marine species, and the frequency and intensification of atmospheric processes such
1. S., III, 52, 1-3: Examinadas estas cosas por nosotros, sería apropiado a los lugares antes citados tratar lo contado en la historia sobre las Amazonas que había antiguamente
Of special concern for this work are outbreaks formed by the benthic dinoflagellate Ostreopsis (Schmidt), including several species producers of palytoxin (PLTX)-like compounds,
In the previous sections we have shown how astronomical alignments and solar hierophanies – with a common interest in the solstices − were substantiated in the
Nevertheless, the ratio of corporations using patents of introduction is higher than that obtained from the analysis of the entire patent system as a whole (around 8.5% from 1820
These data clearly reveal a complex structure for Spanish CP both in root and embedded clauses: They involve sentences with more than one instance of a complementizer heading
