Prospective and regular ELT teachers digital empowerment and self efficacy
21
0
0
Texto completo
(2) Porta Linguarum. Nº 20, junio 2013. ha hallado también una significativa correlación coeficiente para sus mentores. También se han demostrado correlaciones entre la autoeficacia y (a) la motivación, (b) la disponibilidad técnica, y competencias para el uso de tecnologías. Además, se ha hallado que los futuros profesores de ELT y los profesores regulares de ELT difieren sólo en el fortalecimiento de competencias digitales, no en la autoeficacia. La única diferencia se ha observado en la disponibilidad y el uso de tecnologías a favor de los profesores regulares (mentores). Por tanto, se ha llegado a la conclusión de que los docentes de lenguas extranjeras tienen que familiarizarse con tecnologías digitales para la enseñanza en el aula más efectiva. Por eso, se debe fomentar la motivación con actitud positiva para las tecnologías de la información, y el sentimiento competente practicando más a través de los programas de la formación anterior a la docencia, por lo menos, para desarrollar sus autoeficacias creando un ambiente positivo en el aula. Palabras clave: fortalecimiento de competencias digitales, futuros profesores, profesores regulares de ELT y autoeficacia docente.. 1. Introduction Foreign language teaching/learning has been the center of attention in our country for ages. However, there have been claims that it has not been achieved on a satisfying scale according to the complaints we receive not only from the related market but also from the parents of our learners though this education starts right from the primary school to tertiary studies. To scrutinize the issue, many attempts have been made and countless scientific studies have been conducted in our country. But, it seems that we have not obtained satisfactory responses to the questions such as Why can we not teach a foreign language (in our case English) at the desired level? Whose fault is it? The teachers? The students? The methods? The Ministery of National Education? The school administrators? The Publications/ Publisher? Who? In order to eradicate the problem, among the attempts made, the very recent development is the use of technology in foreign language teaching (FLT). Who uses them? Are they efficient in the use of technology? What is their capacity to use these digital devices such as computers, internet, e-mails, mobile phones, cameras, video plays/VCDs/DVDs, and Web 2.0 technologies such as blogs, wikipedia sites, and other social networks? It cannot be denied that those responsible people without competency in using these digital powers (empowerment) will fall short in their professional lives since they cannot cope with the second-by-second developments in FLT through technology and the difficulties they encounter when they teach in the classroom (teacher self-efficacy).. 2. Theoretical. framework. Due to the impact of structural linguistics from 1920s to 1950s behavioristic approach was made applicable to foreign language learning and teaching by the creation of such theories like imitation theory, reinforcement theory, analogical theory, and audiovisual and audiolingual methods which, in turn, pave the way for the recreation of mediation theory in 1960s. In the meantime, contrastive analysis method, comparative method, mim-mem. 78.
(3) Arif Sarýçoban. Prospective and Regular ELT Teachers’ Digital Empowerment and Self-Efficacy. method, language labs, etc. made the foreign language teaching an industry which uses mass application of language learning records, cassettes, and tape recorders. However, in 1957 the launch of sputnik satellite initiated the hub of digital age that requires the application of new technologies in foreign language learning and teaching. In fact it is this digital age that facilitated the mass usage of computers in the field of foreign language learning and teaching. 2.1. Digital Empowerment Digital empowerment (DigEm) means that one makes use of the potentials of the digital technologies to a great extent (Akkoyunlu, 2012 & Akkoyunlu, et.al., 2010, p.11). DigEm provides an effective entry route for learners, who are disengaged with the learning process, or who are unconfident with new technologies (http://www.digem.eu/). Petrou (2011) reports that «DigEm develops communication skills by using creative tools/media techniques, focused on peoples’ own lives, through story-telling, photography, music, video and narrative. DigEm places the learner at the centre of the teaching method, and draws upon personal experiences to engage them» (http://eacea.ec.europa.eu/llp/projects/public_parts/documents/ ict/2011/ict_mp_505052_digem_pub.pdf). According to him, DigEm (a) introduces basic digital competence by using word processing to create scripts, blogs, interviews, newsletters, picture image softwares, editing softwares, the internet e-mail, electronic administration, electronic sales, banking and other network services (training, hobbies) (b) delivers key competences for lifelong learning such as digital competence, learning to learn, interpersonal, intercultural and social competences and civic competence, and cultural expressions, and (c) also nurtures creative abilities through developing storytelling techniques, developing visual and media literacy, and developing drawing and graphics skills. All these peculiarities make an individual a competent person, user, learner, teacher, and so on. Makinen (2006, cited in Akkoyunlu, et.al., 2010, p.11) lays emphasis on the practicality of digital competency in developing one’s life skills and strengthening their capacities in the information society when they utilize their digital powers effectively. 2.2. Teacher Self-efficacy Teacher-self efficacy is a powerful predictor of decision making, influencing school resources, developing discipline in FLT (classroom management), getting parents to become involved in school activities and helping their kids, making his community involved in working with schools, and creating positive school climate. Bandura (1986) believes that «student teachers who visualize success scenarios when confronted with challenging instances in their teaching, also project a greater sense of optimism in their belief that they can generate plausible and effective solutions. Low self-efficacious student teachers are more likely to visualize failure scenarios and their performance is impaired by their focus on what went wrong, or will go wrong» (Cited in Gibbs, 2003) http://www.leeds.ac.uk/educol/ documents/00002390.htm. Gibbs (2003) indicates that «teacher self-efficacy is the belief that one is capable of exercising personal control over one’s behaviour, thinking, and emotions. Effective teachers. 79.
(4) Porta Linguarum. Nº 20, junio 2013. believe that they can make a difference in children’s lives, and they teach in ways that demonstrate this belief. What teachers’ believe about their capability is a strong predictor of teacher effectiveness» http://www.leeds.ac.uk/educol/documents/00002390.htm. In this article Gibbs cites Trentham, Silvern, & Brogdon (1985) who believe that people with strong selfefficacy are more satisfied with their job and demonstrate more commitment and, McDonald & Siegall (1993) that report that those people have lower absenteeism. He continues to cite Gibson & Dembo (1984) who assert that teachers who have high self-efficacy tend to persist in failure situations and use new teaching approaches, Guskey (1988) who states that they take more risks with the curriculum, Brookover et al. (1979) that report that they get better gains in children’s achievement, and lastly Midgely et al. (1989) who think that those teachers have more motivated students.. 3. Methodology 3.1. Participants The participants of this study comprise of two parties. One of which is the prospective student-teachers (n=75) in the field of English Language Teaching Department at a Turkish university in Ankara, the capital city. These participants range in age 21-23. Of these participants, 16 are males and the rest 59 are females. The study was conducted after they have taken a) Computer I (1st Year Fall Semester) and Computer II (1st Year Spring Semester), the content of which is about basic computer literacy skills, b) Instructional Technologies and Materials Design (3rd Year Spring Semester), the ultimate aim of which is to make students get acquaintance with technological aids and other teaching materials and how to use them in their foreign language teaching process through micro teachings, c) Materials Development in Foreign Language Teaching (4th Year Fall Semester), the aim of which is to guide and teach student-teachers how to prepare, adapt, and/or develop teaching materials for their students, and d) School-experience (4th Year Fall Semester), a prerequisite before they take their practicum course. In the school experience course it is aimed that students get to know the school and real classroom environment, foreign language learners, administrative body, the technologies used in those schools, the curriculum (the syllabus), the course-materials, teaching and learning procedures in its real setting, etc. In the spring semester, they are to attend their practicum studies. During this period, they are to observe how classroom instruction, management, and other activities are handled for a while. They are required to teach for some weeks in order to get ready to be observed by their university mentors and their classroom teachers on two occasions. At the end of each session they are given feedback on their teaching and classroom management skills. Of course, to construct an effective lesson they need to use the technology. Therefore, the ultimate aim of this study is to see the prospective and regular ELT teachers’ digital empowerment and their self-efficacy. The second party of the participants is the mentors of the above mentioned prospective students (n=9) that are responsible to follow these prospective student-teachers in their practicum studies and to provide those prospective teachers of English with feedback to display effective language teaching behaviors and classroom management skills. These mentors work in a public elementary school in the same city. Of the mentors, only one (1) is male and. 80.
(5) Arif Sarýçoban. Prospective and Regular ELT Teachers’ Digital Empowerment and Self-Efficacy. the rest 8 are females. As to the years of teaching experiences, one of them stated that her experience falls into 1-10 years of experience, three have said that they are in 11-20 group, whereas the rest five are in the most experienced group (21-Over). 3.2. Instruments 3.2.1. Digital Empowerment Scale The first instrument with 45 items was adopted from the scale development study conducted by Akkoyunlu et.al. (2010). The Cronbach alpha for this current study was found .913, which indicates that this scale has a very high level of reliability. This scale consists of four components: (a) Awareness (Cronbach alpha=.741), (b) Motivation (Cronbach alpha=.872), (c) Technical Avaliability and Utilization (Cronbach alpha=.730), and (d) Competency (Cronbach alpha=.901). The first component (Awareness) has 9 items, the second component (Motivation) has 10 items, the third component (Technical Avaliability and Utilization) has 10 items, and the last one (Competency) has 16 items. 3.2.2. Teacher Self-Efficacy Scale The second instrument with 30 items was adapted from Banduara’s study in 1986. The Cronbach alpha for the current study was found .94, which indicates that this scale has a very high level of reliability. This scale consists of seven components: (a) Decision Making having 2 items (Cronbach alpha=.733), (b) Influencing School Resources having only 1 item (Cronbach alpha was not calculated), (c) Instructional self-efficacy with 9 items (Cronbach alpha=.804), (d) Discipline/Classroom Management (Cronbach alpha=.737), (e) Parental Involvement (Cronbach alpha=.858), (f) Community Involvement (Cronbach alpha=.836), and (g) Creating a Positive School/Classroom Environment (Cronbach alpha=.884). 3.3. Research Questions For the ultimate purpose of the study mentioned above, the following research questions are formulated: 1) What is the level of correlation between digital empowerment and their teacher self-efficacy in general? 2) Is there a relationship between the level of prospective ELT teachers’ digital empowerment and their teacher self-efficacy beliefs? What is the level of this relationship in terms of a. Awareness of digital technologies b. Motivation c. Technical Availability and Utilization d. Competency 3) Is there a relationship between the level of regular ELT teachers’ digital empowerment and their self-efficacy beliefs? 4) Do prospective ELT teachers and regular ELT teachers differ in digital empowerment and their self-efficacy beliefs?. 81.
(6) 3.3. Research Questions For the ultimate purpose of the study mentioned above, the following research questions are formulated: 1) What is the level of correlation between digital empowerment and their teacher self-efficacy in general? 2) Is there a relationship between the level of prospective ELT teachers' digital empowerment and their teacher self-efficacy beliefs? What is the level of this relationship in terms of a. Awareness of digital technologies Motivation Porta Lb.inguarum Nº 20, junio 2013 c. Technical Availability and Utilization d. Competency 3) ata Is there a relationship between the level of regular ELT teachers' digital empowerment and their 4. D analysis and discussion self-efficacy beliefs? 4) Do prospective ELT teachers and regular ELT teachers differ in digital empowerment and their selfResearch Question 1: What is the level of correlation between digital empowerment and efficacy beliefs?. teacher self-efficacy in general?. 4. DATA ANALYSIS AND DISCUSSION. In order to see if any correlation exists between the level of digital empowerment and Research self-efficacy Question 1: What is the of correlation digital empowerment and teacher selfteacher beliefs in level general, Pearson between Product-Moment Correlational Coefficient efficacy in general? was calculated and it was found that the correlation (r=.473) was statistically significant at the 0.01 level (Table 1).exists As abetween result of can be saidand thatteacher if teachers In order to (2-tailed) see if any correlation the this levelanalysis of digital itempowerment selfefficacy beliefslevel in general, Pearson Product-Moment Correlational was calculated and it was have higher of self-efficacy they can improve theirCoefficient digital powers on a satisfactory found and that the correlation (r=.473)inwas statistically the 0.01 level (2-tailed) (Table 1). As a level utilize technology their foreign significant languageatteaching classrooms. result of this analysis it can be said that if teachers have higher level of self-efficacy they can improve their digital powers on a satisfactory level and utilize technology in their foreign language teaching classrooms.. Table 1. The level of correlation between digital empowerment and teacherdigital self-efficacy. Table 1 The level of correlation between empowerment and teacher self-efficacy. Digital Empowerment. Teacher Self-Efficay r=.473!. *P<0.01 (2-tailed) !P<0.01 (2-tailed) Research Question a relationship between the level of prospective ELT teachers' digital Research Question2: 2:Is Isthere there a relationship between the level of prospective ELT teachers’ empowerment and their teacher self-efficacy digital empowerment and their teacherbeliefs? self-efficacy beliefs? Research Question 3: Is there a relationship between the level of regular ELT teachers' digital Research Question 3: Is there a relationship between the level of regular ELT teachers’ empowerment and their self-efficacy beliefs? digital empowerment and their self-efficacy beliefs? Table 2 clearly indicates that the correlation between the level of prospective ELT teachers' digital empowerment their indicates teacher self-efficacy beliefs is statistically 0.01 level (2-tailed). Table 2 and clearly that the correlation betweensignificant the levelatoftheprospective ELT teaThe calculated is .378. Relying this finding it can bebeliefs said that prospectivesignificant teachers chers’ digital correlation empowerment and their on teacher self-efficacy is the statistically (student teachers) in their first period (infancy) in which it is quite normal for those at the 0.01 levelare (2-tailed). Theapprenticeship calculated correlation is .378. Relying on this finding it can teachers to lack how to utilize technology in teaching though they may be acquaintance/aware with these be said that the prospective teachers (student teachers) are in their first apprenticeship period digital devices. On the other hand, the utilization experience comes to the front with a clear picture in the (infancy) which it isin quite normal coefficient for those for teachers to lack how P<0.05, to utilize technology5in sense that itin was observed the correlation their mentors (r=.717, 2-tailed).. teaching though they may be acquaintance/aware with these digital devices. On the other hand, the utilization experience comes to the front with a clear picture in the sense that it was observed in the correlation coefficient for their mentors (r=.717, P<0.05, 2-tailed). Table correlation between empowerment teacherfor self-efficacy Table2.2 Level Level ofofcorrelation between digitaldigital empowerment and teacherand self-efficacy prospective for teachers and their mentors prospective teachers and their mentors. Teacher Self-Efficacy Digital Empowerment Prospective Teachers Their Mentors. r=.378!! r=.717!. !P<0.05 (2-tailed) !!P<0.01 (2-tailed) Another striking point is that the correlation obtained for the relationship between Awareness and Selfefficacy in general is not significant at r=.175 level. This agrees our interpretation above that it does not necessarily mean that if a teacher is aware the importance of digital technologies, he can effectively and efficiently use it in his teaching. However, a careful analysis of Table 3 below clearly shows that the correlation for the other three components of the digital empowerment scale is significant (r=.270, P<0.05 for motivation; r=.276, p<0.05 for technical availability and utilization; and r=.513, p<0.01 (2-tailed for all). As a result we can assert that those with self-efficacy on a satisfactory level are motivated and competent enough in the utilization of digital technologies in their classroom teaching.. 82. Table 3 Level of correlation between digital empowerment and teacher self-efficacy in terms of awareness, motivation, technical availability and utilization, and competency.
(7) 5 Table 2 Level of correlation between digital empowerment and teacher self-efficacy for prospective teachers and their mentors Table 2 Level of correlation between digital empowerment and teacher self-efficacy for prospective Teacher Self-Efficacy teachers and their mentors Digital Empowerment Arif Sarýçoban Prospective and Regular ELT Teachers’ Digital Empowerment and Self-Efficacy Prospective Teachers r=.378!! Teacher Self-Efficacy Their Mentors r=.717! Digital Empowerment Another striking point is that the correlation obtained for the relationship between Awareness Prospective Teachers r=.378!! !P<0.05 (2-tailed) in and Self-efficacy general is not significant at r=.175 level. This agrees our interpretation Their Mentors r=.717! !!P<0.01 (2-tailed) above that it does not necessarily mean that if a teacher is aware the importance of digital. technologies, he can effectively and efficiently use it in his teaching. However, a careful Another striking point is that the correlation obtained for the relationship between Awareness and Self!P<0.05 (2-tailed) analysis ofgeneral Tableis3not below clearly shows that the correlation for the other three components efficacy significant at r=.175 level. This agrees our interpretation above that it does not !!P<0.01in(2-tailed) of the digital empowerment scale is significant (r=.270, P<0.05 for motivation; r=.276, p<0.05 necessarily mean that if a teacher is aware the importance of digital technologies, he can effectively and for technical availability utilization; and r=.513, p<0.01 (2-tailed for all). shows As a and result efficiently use it in his teaching. However, a careful analysis of Table 3 below clearly thatSelfthewe Another striking point is and that the correlation obtained for the relationship between Awareness correlation thethose other components of the digital empowerment scale significant P<0.05 can assert that with self-efficacy on a satisfactory level areis motivated anditcompetent efficacy in for general is notthree significant at r=.175 level. This agrees our interpretation above (r=.270, that does not for motivation; availability and utilization; and r=.513, (2-tailed and for necessarily that if p<0.05 a teacher istechnical aware the importance digital technologies, he p<0.01 can effectively enough in mean the r=.276, utilization offor digital technologies inoftheir classroom teaching. all). As a use resultit we canteaching. assert that those with self-efficacy satisfactory are shows motivated efficiently in his However, a careful analysison of aTable 3 belowlevel clearly that and the competent the three utilization of digital in their classroom correlation enough for the in other components of technologies the digital empowerment scale teaching. is significant (r=.270, P<0.05 Table 3 Level of correlation between digital empowerment and teacher self-efficacy in for motivation; r=.276, p<0.05 for technical availability and utilization; and r=.513, p<0.01 (2-tailed for terms of awareness, motivation, technical availability and utilization, Table 3 Level of correlation between digital empowerment and teacher self-efficacy in terms of awareness, all). As a result we can assert that those with self-efficacy on a satisfactory level are motivated and technical availability and in utilization, and competency and competency. competent enough in motivation, the utilization of digital technologies their classroom teaching. Table 3 Level of correlation between digital empowerment and teacherTeacher self-efficacy in terms of awareness, Self-Efficay motivation, technical availability and utilization, and competency Digital Empowerment Components Awareness Motivation Digital Empowerment Technical AvailabilityComponents and Utilization Awareness Competency Motivation Technical Availability and Utilization *P<0.05 (2-tailed) !P<0.05 (2-tailed) Competency **P<0.01 !!P<0.01 (2-tailed) (2-tailed). r=.175 Teacher Self-Efficay r=.270! r=.276! r=.175 r=.513!! r=.270! r=.276! r=.513!!. As teachers of English (student-teachers), the correlation for the above !P<0.05 (2-tailed) As to tothe theprospective prospective teachers of English (student-teachers), the correlation formentioned the above sub-components was calculated again. It was found that a statistically significant correlation only exists !!P<0.01 (2-tailed) mentioned sub-components was calculated again. It was found that a statistically significant between the digital competency of students teachers and their teacher self-efficacy beliefs (r=.481, p<0,01; correlation existsinbetween digitalitcompetency of students andlevel theirofteacher 2-tailed) as the isonly indicated Table 4.ofthe Therefore, can be said that withteachers satisfactory selfAs to prospective teachers English (student-teachers), thethose correlation for the above mentioned self-efficacy beliefs (r=.481, p<0,01; 2-tailed) as is indicated in Table 4. Therefore, it can efficacy can make use of different Web 2.0 tools effectively enough. sub-components was calculated again. It was found that a statistically significant correlation only exists be said the thatdigital thosecompetency with satisfactory of self-efficacy can make usebeliefs of different Web 2.0 between of studentslevel teachers and their teacher self-efficacy (r=.481, p<0,01; Table ofenough. correlation between digital empowerment in terms of and 2-tailed) as4 Level is indicated in Table 4. Therefore, it can be saidand thatteacher those self-efficacy with satisfactory level of selftools effectively competency prospective teachers efficacy can make use of different Web 2.0 toolsfor effectively enough.. Table 4. Level of correlation between digital empowerment and teacher self-efficacy in Table 4 Level of correlation between digital empowerment and teacher self-efficacy in terms of and Teacher Self-Efficay terms of and competency for prospective competency for prospective teachers teachers.. Digital Empowerment Components Competency Digital Empowerment Components !P<0.01 (2-tailed) Competency. r=.481! Teacher Self-Efficay r=.481!. *P<0.01 !P<0.01 (2-tailed) (2-tailed). When we examine Table 5, on the other hand, the same procedure was used to see if any correlation exists between these subcomponents of digital competency and teacher self efficacy for mentors. It has been observed that the correlation for motivation is r=.793 at p<0.05, r=.763 p<0.01 for technical availability and utilization; and r=.573, p<0.01 (2-tailed for all). This result once again supports the claim that the experience in the utilization of digital. 83.
(8) 6 When we examine Table 5, on the other hand, the same procedure was used to see if any correlation these subcomponents of digital competency and teacher –self efficacy forNºmentors. It 2013 has Pexists ortabetween Linguarum 20, junio. been observed that the correlation for motivation is r=.793 at p<0.05, r=.763 p<0.01 for technical availability and utilization; and r=.573, p<0.01 (2-tailed for all). This result once again supports the claim that the experience utilizationrole of digital technologies an important roledue in teaching in the technologies playsinanthe important in teaching in the plays classroom situation to competency classroom situation due to competency and motivation of those teachers attained as a result of years of6 and motivation of those teachers attained as a result of years of teaching exposure. teaching exposure. When we examine Table 5, on between the other hand, theempowerment same procedure was to seeself-efficacy if any correlation Table 5. Level of correlation digital and used teacher in exists5between subcomponents of digital competency teacher –self efficacy for of mentors. It has terms of motivation, technical availability andself-efficacy utilization, and Table Level of these correlation between digital empowerment andand teacher in terms motivation, been observed thattechnical the correlation for and motivation is and r=.793 at p<0.05, r=.763 p<0.01 for technical availability utilization, competency for mentors competency for mentors. availability and utilization; and r=.573, p<0.01 (2-tailed for all). This result once again supports the claim that the experience in the utilization of digital technologies plays an important role in teaching in the Teacher Self-Efficay classroom situation due to competency and motivation of those teachers attained as a result of years of teaching exposure. Digital Empowerment Components Motivation r=.793! Technical Availability and Utilization r=.763! Table 5 Level of correlation between digital empowerment and teacher self-efficacy in terms of motivation, Competency r=.573! technical availability and utilization, and competency for mentors *P<0.05 !P<0.05 (2-tailed) (2-tailed). Teacher Self-Efficay. Digital Empowerment Research Question 4.4. Components Do prospective ELT Research Question Do prospective ELT teachers teachersand andregular regularELT ELTteachers teachersdiffer differinindigital digital Motivation and their self-efficacy beliefs? r=.793! empowerment empowerment and their self-efficacy beliefs?. Technical Availability and Utilization r=.763! In order to see if there is any statistically significant difference between prospective teachers and Competency r=.573! ELT In ELT orderteachers to seeinif digital there is any statistically significant difference prospective regular empowerment and their self-efficacy, t-test of between significance was run andELT it teachers ELT teachers their self-efficacy, t-test(t-of was foundand that regular prospective ELT teachers in anddigital regular empowerment ELT teachers onlyand differ in digital empowerment !P<0.05 (2-tailed) calculated=-2.538>t-table=1.645) (Table 6). that This prospective result implies ELT that the mean difference for the teachers is significance was run and it was found teachers and regular ELT teachers m=5,8322, whereas it isempowerment m=5,1947 for student-teachers (Table 7). However, no significant difference has only differ in digital (t-calculated=-2.538>t-table=1.645) (Table 6). This result Research Question 4. Do prospective ELT teachers and regular ELT teachers differ in digital been observed implies that the differencebeliefs? for the teachers is m=5,8322, whereas it is m=5,1947 for empowerment and mean their self-efficacy. student-teachers However, significant difference has been observed between Table 6 Difference(Table between7). prospective ELTno teachers and regular ELT teachers in digital empowerment order to see ifinthere is any significant difference between teachers and these In participants terms of statistically teacher self-efficacy (m=3.7956 forprospective teachers;ELT m=3.4977 for regular ELT teachers in digital empowerment and state their self-efficacy, of significance wasofrunthe andimit student-teachers). Then we can once again that regulart-test teachers are aware Levene's was found that prospective ELT teachers and regular ELT teachers only differ in digital empowerment (tTestinforthe classroom. Therefore, t-test for Equality Means portance of digital technologies they difference areof motivated calculated=-2.538>t-table=1.645) (Table 6). result implies that the mean for the about teachersthis is Equality of This at issue and they feelit themselves least. m=5,8322, whereas is m=5,1947 competent for student-teachers (Table 7). However, no significant difference has Variances F Sig.. been observed. t hesap df Sig.(2Mean Table 6. Difference between prospective ELT teachers and regular Std. Error tailed) Difference Difference Table 6 Difference between prospective ELT teachers andempowerment. regular ELT teachers in digital empowerment ELT teachers in digital Digital Equal. Empowerment. Self-efficacy Digital Empowerment. Self-efficacy. 84. variances assumed Equal variances not assumed Equal Equal variances variances assumed assumed Equal Equal variances variances not not assumed assumed Equal variances assumed Equal variances not assumed. 8,782 ,004 Levene's Test for Equality of Variances F Sig.. -2,358. ,189. -,63756. t hesap. df. Sig.(2tailed). Mean Difference. Std. Error Difference. 1,834 ,179 8,782 ,004. -1,470 -2,358. 82 82. ,145 ,021. -,29782 -,63756. ,20262 ,27039. -1,104 -1,428. 8,949 8,518. ,298 ,189. -,29782 -,63756. ,26983 ,44652. -1,470. 82. ,145. -,29782. ,20262. -1,104. 8,949. ,298. -,29782. ,26983. 1,834. ,179. 82. ,021. -,63756. ,27039. t-test for Equality of Means -1,428. 8,518. ,44652.
(9) Table 6(2-tailed) Difference between prospective ELT teachers and regular ELT teachers in digital empowerment !P<0.05 Levene'sELT teachers and regular ELT teachers differ in digital Research Question 4. Do prospective for t-test for Equality of Means empowerment and their self-efficacyTest beliefs? Equality of In order to see if there is any Variances statistically significant difference between prospective ELT teachers and F Sig. and ttheir df Sig.(2Mean hesap self-efficacy, regular ELT teachers in digital empowerment t-test of significance wasStd. runError and it tailed) Difference Difference(twas found that prospective ELT teachers and regular ELT teachers only differ in digital empowerment Digital Equal Acalculated=-2.538>t-table=1.645) rif S arýçoban Prospective (Table and Regular Teachers’ Digital Empowerment Self-Efficacy 6). ThisELT result implies that the mean difference and for the teachers is Empowerment 8,782 ,004 -2,358 (Table827). However, ,021 no significant -,63756 difference ,27039has m=5,8322, whereasvariances it is m=5,1947 for student-teachers assumed been observed Equal Table 6. Difference between prospective ELT teachers and regular -1,428empowerment 8,518 ELT,189 -,63756 ,44652 Table 6 Differencevariances between prospective and regular teachers in digital empowerment ELT teachersELT in teachers digital (cont). not assumed Levene's Self-efficacy Equal Test for t-test for Equality of Means variances 1,834 -1,470 82 ,145 -,29782 ,20262 Equality,179 of assumed Variances Equal F Sig. t hesap df Sig.(2Mean Std. Error variances -1,104 8,949 ,298 -,29782 ,26983 tailed) Difference Difference not Digital Equal assumed Empowerment variances 8,782 ,004 -2,358 82 ,021 -,63756 ,27039 assumed Equal 7 Group statistics for for digital andand self-efficacy TableTable 7. Group statistics digitalempowerment empowement self/efficacy. variances -1,428 8,518 ,189 -,63756 ,44652 not assumed Groups N Mean Std. Deviation Std. Error Mean Self-efficacy Equal variances 1,834 ,179 -1,470 82 ,145 -,29782 ,20262 Digital student75 5,1947 ,68045 ,07857 assumed Empowerment teachers Equal variances -1,104 ,298 -,29782,43956 ,26983 teachers 9 5,8322 8,949 1,31867 not Self-efficacy studentassumed 75 3,4977 ,54645 ,06310 teachers. teachers. 9. 3,7956. ,78704. 7. ,26235. As the to the differencein in the the sub-components of the digital empowerment, Table 8 Table reports8that the only As to difference sub-components of the digital empowerment, reports was observed technical in availability utilizationand (t-calculated=-1.990>t-table=1.645). that difference the only difference wasinobserved technicaland availability utilization (t-calculated=Another supporting evidence for this difference can be seen in the mean differences for regular teachers 1.990>t-table=1.645). Another supporting evidence for this difference can be seen in the (m=5.7556) and student-teachers (m=5.0160) (Table 9). Regular teachers have reported that they can make mean for connection regular teachers (m=5.7556) and student-teachers (m=5.0160)technologies, (Table usedifferences of the internet both in school and at home, classrooms with information 9). Regular teachers have reported make use the internet connection both internet cafes, internet in the library,that and they so on.can Of course, this of advantage helps them to have effective instruction careers, become with more information motivated towards these technologies thusinternet towardsintheir in school and inat their home, classrooms technologies, internet and cafes, in the use ofthis theseadvantage digital devices, thus,todisplay teaching the lessons, library, feel andcompetent so on. Of course, helpsand them have effective effectivelanguage instruction behaviors. in their careers, become more motivated towards these technologies and thus towards their lessons, feel competent in theprospective use of these digital and devices, display effective lanTable 8 Difference between ELT teachers regularand ELTthus, teachers in technical availability guage teaching behaviors. and utilization Levene's Test for Equality of Variances F Sig.. Technical Availability and Utilization. Equal variances assumed Equal variances not assumed. 3,308. ,073. t-test for Equality of Means t hesap. df. Sig. (2tailed). Mean Difference. Std. Error Difference. -1,990. 82. ,050. -,73956. ,37155. -1,458. 8,887. ,179. -,73956. ,50737. 85.
(10) teachers. 9. 3,7956. ,78704. ,26235. As to the difference in the sub-components of the digital empowerment, Table 8 reports that the only difference was observed in technical availability and utilization (t-calculated=-1.990>t-table=1.645). Another supporting evidence for this difference can be seen in the mean differences for regular teachers (m=5.7556) and student-teachers (m=5.0160) (Table 9). Regular teachers have reported that they can make use of the internet connection both in school and at home, classrooms with information technologies, internet cafes, internet in the library, and so on. Of course, this advantage helps them to have effective instruction in their careers, become more motivated towards these technologies and thus towards their Plessons, orta Lfeel inguarum 20, junio 2013 competent in the use of these digital devices, and thus, display effective Nº language teaching behaviors.. Table 8. Difference prospective and regular ELT teachers Table 8 Difference between between prospective ELT teachersELT and teachers regular ELT teachers in technical availability in technical availability and utilization. and utilization Levene's Test for Equality of Variances F Sig.. Technical Availability and Utilization. Equal variances assumed Equal variances not assumed. 5. Conclusion. 3,308. ,073. t-test for Equality of Means t hesap. df. Sig. (2tailed). Mean Difference. Std. Error Difference. -1,990. 82. ,050. -,73956. ,37155. -1,458. 8,887. ,179. -,73956. ,50737. and recommendations. The ultimate aim of this study is to see the levels of digital empowerment and teacher-self efficacy beliefs of student-teachers and regular ELT teachers (mentors). At the end of the study it was observed that a statistically significant correlation exits between digital empowerment and teacher self-efficacy in foreign language teaching context. In addition the correlation between the level of prospective ELT teachers’ digital empowerment and their teacher selfefficacy beliefs is found to be important as well as the significant correlation coefficient for their mentors. Additionally, we have seen that the correlation between self-efficacy and (a) motivation is .270, P<0.05; (b) technical availability and utilization is .276, p<0.05; and (c) competency is .513, p<0.01 (2-tailed for all). However, we obtained a quite surprising result that indicates no correlation between awareness and self-efficacy (r=.175). As to the difference between prospective ELT teachers and regular ELT teachers in digital empowerment and their self-efficacy, it was found that prospective ELT teachers and regular ELT teachers only differ in digital empowerment (t-calculated=-2.538>t-table=1.645) (Table 6), but in self-efficacy. The only difference was observed in technical availability and utilization in favor of regular teachers (mentors). The findings obtained in this study bring some considerations in mind that foreign language teachers should become acquainted with digital technologies for more effective classroom teaching. To do this they should be motivated, have positive attitudes towards those technologies, and be made to feel competent through more practice in their pre-service teacher training programs at least in order to improve their self-efficacies by creating a positive classroom environment. They should be provided with information technologies and made a competent user of those technologies not only in class but also outside the class at least for their homework and projects.. 86.
(11) Arif Sarýçoban. Prospective and Regular ELT Teachers’ Digital Empowerment and Self-Efficacy. 6. References Akkoyunlu, B. (2012). «Sayýsal Etkinlik ve Eðitim Kurumlarýnýn Sorumluluklarý,» available from: http://www.hurriyetegitim.com/haberler/05.03.2012/prof-dr-buket-akkoyunlu-hacettepeuniversitesi-egit.aspx, accessed March 15, 2012. Akkoyunlu, B., M. Yýlnaz Soylu, & M. Çaðlar. (2010). «A Study on Developing Digital Empowerment Scale for University Students», in Hacettepe University Journal of Education, 39: 10-19. Bandura, A. (1986). «The Explanatory and Predictive Scope of Self-efficacy Theory», in Journal of Social and Clinical Psychology, 4, 3: 359-373. Brookover, W., Beady, C., Flood, P., Schweitzer, J., & Wisenbaker, J. (1979). School Social Systems and Student Achievement: Schools can Make a Difference. New York: Preager. Gibson, S., & Dembo, M.H. (1984). «Teacher Efficacy: A Construct Validation», in Journal of Educational Psychology, 76: 569-582. Guskey, T.R. (1988). «Context Variables that Affect Measures of Teacher Efficacy», in Journal of Educational Research, 81, 1: 41-47. Harvey, L. (2012). «Analytic Quality Glossary», Quality Research International, available from: http://www.qualityresearchinternational.com/glossary/, 200411, accessed March 15, 2012. Makinen, M. (2006). «Digital Empowerment as a Process for Enhancing Citizens’ Participation», E-learning, 3, 3: 381-395. available from: http://dx.doi.org/10.2304/elea.2006.3.3.381, accessed 15 March, 2012. McDonald, T., & Siegall, M. (1993). «The Effects of Technological Self-efficacy and Job Focus on Job Performance, Attitudes, and Withdrawal Behaviors», in Journal of Psychology, 5: 465-475. Midgely, C., Feldlaufer, H., & Eccles, J.S. (1989). «Change in Teacher Efficacy and Student Selfand Task-related Beliefs in Mathematics during the Transition to Junior High School», in Journal of Educational Psychology, 81, 2: 247-258. Petrou, D. (2012). «Digital Empoverment,» A Project Founded by European Commission (5050522009-LLP-GR-KA3MP), available from: http://eacea.ec.europa.eu/llp/projects/public_parts/documents/ict/2011/ict_mp_505052_digem_pub. pdf, accessed 15 March, 2012. Trentham, L., Silvern, S., & Brogdon, R., (1985). «Teacher Efficacy and Teacher Competency Ratings», in Psychology in the Schools, 22, 3: 343-352, available from: http://www.digem. eu, accessed 15 March, 2012.. 87.
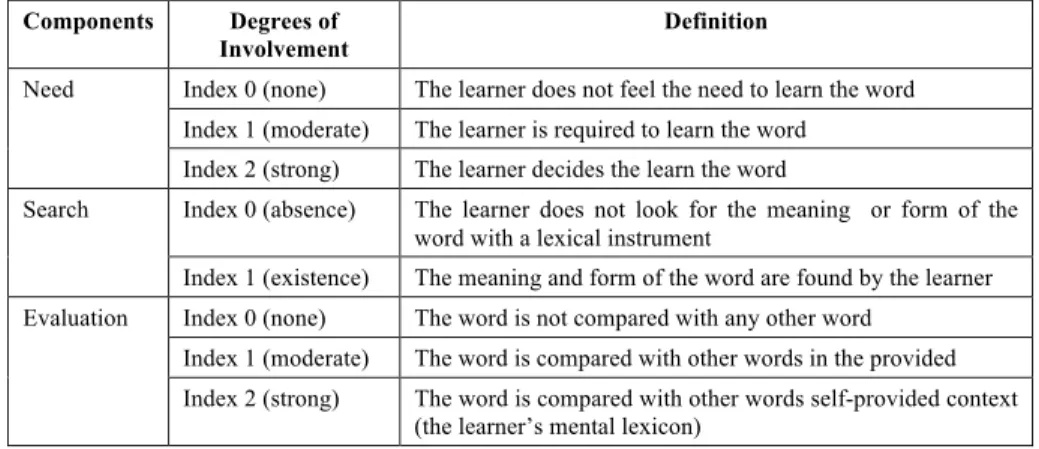
(12) Gema Alcaraz y Ángela Almela. The Bilingual Dictionary and Foreign Language.... the information that is processed at a deep level stays in memory longer than that which goes through a shallower processing. This initial approach to memory was expanded by Craik and Tulving some years later (1975). Whereas Craik and Lockhart presented three levels of processing (orthographic, acoustic and semantic), Craik and Tulving added the notion of elaboration to this model. That is to say, new information which is connected to information that already exists in memory gives place to more robust memory traces. However, there was a main criticism to this model, which points to the lack of encoding specificity. In other words, the Depth of Processing Model did not operationalize the degree of cognitive effort or elaboration. Laufer and Hulstijn (2001) tried to operationalize the concept of elaboration and felt the need to transfer this concept to the field of L2 vocabulary. They proposed the construct of «involvement», and this was the beginning of their hypothesis; it implied that the higher the involvement load, the larger and the better the amount of L2 vocabulary acquired. Specifically, this construct is built upon cognitive and motivational aspects. The three components of «involvement» are need, search and assessment. The first one is embedded in the motivational dimension, whereas the other two are related to the cognitive dimension of the construct. Both need and evaluation are organized into three levels: 0 or none, 1 or moderate and 2 or strong. Level 1 of need is given when the learner is required to learn the word by an external agent, for instance, the teacher. In level 1 of evaluation, the word is compared with other words in a specific context. The strong level of need and evaluation refers to the learner’s own initiative to learn the word in the first case, and the free use of the word by the learner, respectively. Search only accounts for two levels: 0 or none and 1 or presence (Table 3). Table 3. Degrees of involvement. Components Need. Search. Evaluation. Degrees of Involvement. Definition. Index 0 (none). The learner does not feel the need to learn the word. Index 1 (moderate). The learner is required to learn the word. Index 2 (strong). The learner decides the learn the word. Index 0 (absence). The learner does not look for the meaning or form of the word with a lexical instrument. Index 1 (existence). The meaning and form of the word are found by the learner. Index 0 (none). The word is not compared with any other word. Index 1 (moderate). The word is compared with other words in the provided. Index 2 (strong). The word is compared with other words self-provided context (the learner’s mental lexicon). Table 3. Degrees of involvement. According to the parameters shown in Table 3, we have designed four tasks with different degree of involvement: According to the parameters shown in Table 3, we have designed four tasks with different degree of involvement: •Task 1: Reading comprehension with marginal glosses Students are asked to read a series of short paragraphs in English and answer a true/false questionnaire about the paragraphs. In each of these paragraphs there is one of the target words selected for the study. These words appear in bold so as to highlight their presence. At the end of the paragraphs students can find the meaning of the target word between brackets. The content of these paragraphs is constituted by vocabulary that is understandable for the students, so that they can concentrate on the target word. According to Hulstijn and Laufer, task 1 contains a degree of involvement 1, as it includes moderate need (1) and no search or assessment.. 93.
(13) Porta Linguarum. Nº 20, junio 2013. • Task 1: Reading comprehension with marginal glosses Students are asked to read a series of short paragraphs in English and answer a true/ false questionnaire about the paragraphs. In each of these paragraphs there is one of the target words selected for the study. These words appear in bold so as to highlight their presence. At the end of the paragraphs students can find the meaning of the target word between brackets. The content of these paragraphs is constituted by vocabulary that is understandable for the students, so that they can concentrate on the target word. According to Hulstijn and Laufer, task 1 contains a degree of involvement 1, as it includes moderate need (1) and no search or assessment. • Task 2: Reading comprehension and fill-in the gaps This second activity contains the same paragraphs of task 1. However, students find a gap instead of the target words in the paragraphs. The task consists of filling in the gaps with the target words, which are alphabetically listed at the end of the task, together with their Spanish translation. In addition to the target words, seven distractors were included. The degree of involvement in task 2 includes moderate need (1) and moderate assessment (1) and no search. • Task 3: Writing with marginal glosses Task 3 consists of writing sentences with each of the target words. These words are listed in alphabetical order, together with their Spanish translation. Students are asked to write a sentence which shows that they have understood the meaning of the target word. This task presents a degree of involvement 3, as it includes moderate need (1), strong assessment (2), but still no search. • Task 4: Writing and dictionary use Similar to task 3, in task 4 students are asked to write meaningful sentences. However, this time students do not find the words translated into Spanish. It is the students who have to search the meaning of the targets words into a dictionary. All students are provided with the same dictionary. It was the most basic version of the Collins Pocket Plus English-Spanish dictionary. We decided to use a very basic dictionary so as to avoid the students’ possible confusion if they found several meanings for the same word. It is important to remark that students had already had experience with dictionary searching. Therefore, the fact that they had to use a dictionary did not imply an additional degree of difficulty. According to the ILH, this task contains a degree of involvement 4, as it includes moderate need (1), strong assessment (2) and, for the first time in this study, search (1). It is worth noting that each activity was distributed to a different group of students in each level. Thus, each task was performed by two groups, one of the groups consisting of seven Primary education students and the other one of seven Secondary education students.. 94.
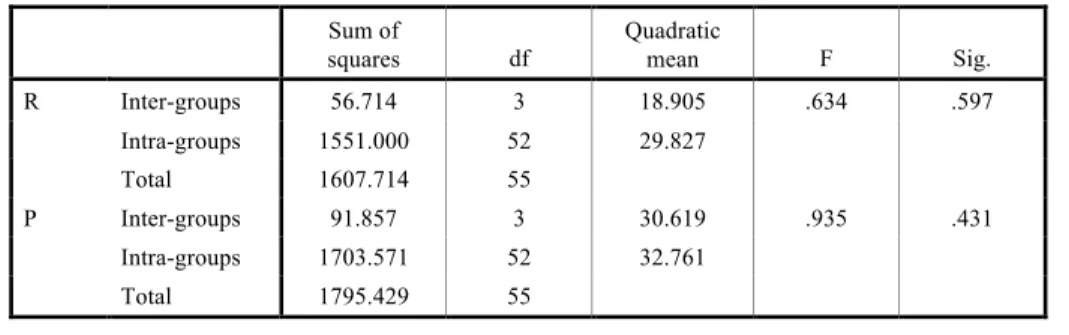
(14) Gema Alcaraz y Ángela Almela. The Bilingual Dictionary and Foreign Language.... 3.2.3. Vocabulary tests Three weeks before the study was carried out, all students did a pre-test in order to know whether they already knew the target words. The object of the test was to translate the target words into Spanish. After the eight groups of students had done their corresponding task, all students in each level did the same productive and receptive vocabulary tests. First, the productive tests were distributed. Students were asked to translate the Spanish target words into English. In the second place, the receptive tests were done by students, who had to translate the English target words into Spanish. The order of distribution is not arbitrary: the productive tests are considered to require more cognitive effort than the receptive tests. Therefore, the receptive tests were distributed in the second place so as to avoid that students could glean hints from these tests onto the productive ones. 3.2.4. Data analysis In order to compare the degree of acquisition (dependent variable) in the eight groups of learners, the parametric test of the analysis of variance or ANOVA has been run. In this case, the independent variable is the degree of involvement in the tasks. The ANOVA was completed with a post-hoc analysis (HDS Tukey) for the identification of the possible significant inter-group differences. According to the research norm in Linguistics, differences are considered significant when p <0.05. On the other hand, the results of the dictionary task have been compared with the participants’ opinion about dictionary use by means of a Pearson correlation coefficient, so as to detect any correlation between both variables.. 4. Results As can be seen in Table 4, the critical level associated to F is much higher than .05 both in the receptive (.597) and the productive test (.431). Consequently, we can assume that all the compared means present no significant differences between them. Put another way, the four tasks applied in the study do not make a difference in the students’ degree of vocabulary acquisition, running counter to the Involvement Load Hypothesis. Table 4. Overall ANOVA receptive and productive tests.. R. P. Sum of squares. df. Quadratic mean. F. Sig.. Inter-groups. 56.714. 3. 18.905. .634. .597. Intra-groups. 1551.000. 52. 29.827. Total. 1607.714. 55 .935. .431. Inter-groups. 91.857. 3. 30.619. Intra-groups. 1703.571. 52. 32.761. Total. 1795.429. 55. 95. Table 4. Overall ANOVA receptive and productive tests. However, the considerable significance found among the four groups of Primary Education is worth noticing (see Table 5): ANOVA. R. Inter-groups. Sum of squares. df. Quadratic mean. F. Sig.. 144.857. 3. 48.286. 27.592. .000.
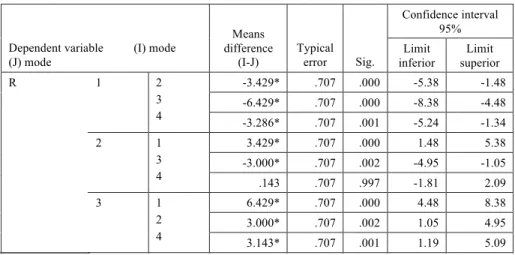
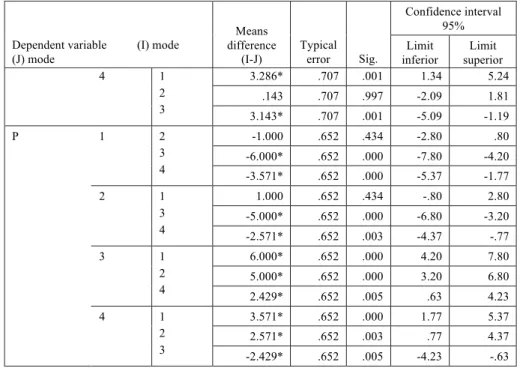
(15) R. P. Sum of squares. df. Quadratic mean. F. Sig.. Inter-groups. 56.714. 3. 18.905. .634. .597. Intra-groups. 1551.000. 52. 29.827. Total. 1607.714. 55 .935. .431. Inter-groups. Intra-groups Porta Linguarum Total. 91.857. 3. 30.619. 1703.571. 52. 32.761. 1795.429. 55. Nº 20, junio 2013. However, the considerable significance found among the four groups of Primary Education is worth Table 5): and productive tests Tablenoticing 4. Overall(see ANOVA receptive Table 5. the ANOVA receptive and productive tests the forfour Primary However, considerable significance found among groupsEducation of Primary students. Education is worth noticing (see Table 5): ANOVA ANOVA. Sum of squares R. P. df. Quadratic mean. F. Sig.. 27.592. .000. 34.208. .000. Inter-groups. 144.857. 3. 48.286. Intra-groups. 42.000. 24. 1.750. Total. 186.857. 27. Inter-groups. 152.714. 3. 50.905. Intra-groups. 35.714. 24. 1.488. Total. 188.429. 27. Tablefrom 5. ANOVA receptive and productive tests significant for Primary Education students The results the post-hoc analysis reflect differences among the scores of most groups indeed (Table 6). As regards the receptive test, it can be observed how all The results from the post-hoc significant differences amongmeans the scores of the groups differ except for the analysis second reflect one and the fourth one, which in practice most groups indeed (Table 6). As regards the receptive test, it can be observed how all the that both groups of participants have a similar level of receptive lexical knowledge. On the groups differ except for the second one and the fourth one, which means in practice that otherboth hand, groups 1 and 3 substantially between them and with groups of participants have a similardiffer, level ofboth receptive lexical knowledge. Onthe theremaining other groups. The former produces the expected performance, but the latter achieves the best score, hand, groups 1 and 3 substantially differ, both between them and with the remaining despite the fact it is not thethe group with performance, the higher degree involvement. groups. The that former produces expected but theoflatter achieves the best Whendespite it comes to the 1 and 2 score thus the post-hoc score, the fact thatproductive it is not thetest, groupgroups with the higher degreesimilarly; of involvement. it comes to significant the productive test, groupsamong 1 and 2them. score The similarly; the scores post-hocmarkedly test test When does not detect differences third thus group notthe detect significant differences among Thefrom third the group scores markedly better betterdoes than fourth one, which parallels thethem. results receptive test.. than the fourth one, which parallels the results from the receptive test.. Table 6. Tukey HSD for Primary Education students.. Dependent variable (J) mode R. 1. 2. 3. 4. 96 P. 1. 2. (I) mode 2 3 4 1 3 4. Means difference (I-J). Confidence interval 95% Typical error. Sig.. Limit inferior. Limit superior. -3.429*. .707. .000. -5.38. -1.48. 7 -6.429*. .707. .000. -8.38. -4.48. -3.286*. .707. .001. -5.24. -1.34. 3.429*. .707. .000. 1.48. 5.38. -3.000*. .707. .002. -4.95. -1.05. .143. .707. .997. -1.81. 2.09. 1 2 4. 6.429*. .707. .000. 4.48. 8.38. 3.000*. .707. .002. 1.05. 4.95. 3.143*. .707. .001. 1.19. 5.09. 1 2 3. 3.286*. .707. .001. 1.34. 5.24. .143. .707. .997. -2.09. 1.81. 3.143*. .707. .001. -5.09. -1.19. 2 3 4. -1.000. .652. .434. -2.80. .80. -6.000*. .652. .000. -7.80. -4.20. -3.571*. .652. .000. -5.37. -1.77. 1 3 4. 1.000. .652. .434. -.80. 2.80. -5.000*. .652. .000. -6.80. -3.20. -2.571*. .652. .003. -4.37. -.77.
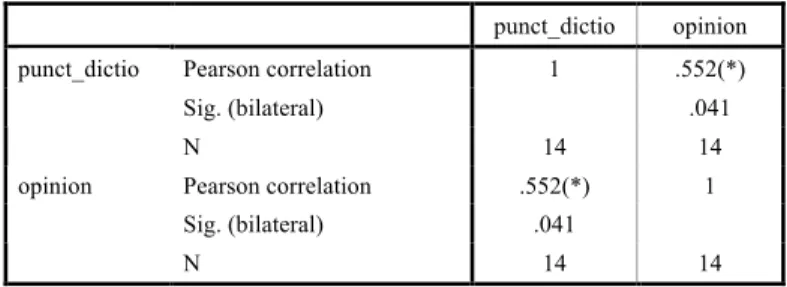
(16) Dependent variable (J) mode R. 1. (I) mode. Means difference (I-J). 2 3 4. Gema Alcaraz y Ángela Almela. Confidence interval 95% Typical error. Sig.. Limit inferior. Limit superior. -3.429*. .707. .000. -5.38. -1.48. -6.429*. .707. .000. -8.38. -4.48. -3.286* .707 Dictionary .001 -1.34 The Bilingual and-5.24 Foreign Language.... 2. 1 3.429* .707 .000 1.48 5.38 3 -3.000* .707 .002 -4.95 -1.05 Table 6. Tukey HSD for Primary Education students (Cont.). 4 .143 .707 .997 -1.81 2.09 Confidence interval 3 1 6.429* .707 .000 4.48 8.38 95% Means 2 3.000* .707 .002 1.05 4.95 Dependent variable (I) mode Typical difference Limit Limit 4 3.143* .707 .001 1.19 5.09 Sig. (J) mode (I-J) error inferior superior R. 4 1. 1 2 2 3 3 4. P. 1 2. 2 1 3 3 4 4. P. 3.286* -3.429* .143 -6.429*. .707 .707 .707 .707. .001 .000 .997 .000. 1.34 -5.38 -2.09 -8.38. 5.24 -1.48 1.81 -4.48. 3.143* -3.286* -1.000 3.429*. .707 .707 .652 .707. .001 .001 .434 .000. -5.09 -5.24 -2.80 1.48. -1.19 -1.34 .80 5.38. -6.000* -3.000* -3.571* .143. .652 .707 .652 .707. .000 .002 .000 .997. -7.80 -4.95 -5.37 -1.81. -4.20 -1.05 -1.77 2.09. .652 .707 .652 .707. .434 .000 .000 .002. .652 .707 .652 .707. .003 .001 .000 .001. -.80 4.48 -6.80 1.05 -4.37 1.19. 2.80 8.38 -3.20 4.95 -.77 5.09. .652 .707 .652 .707. .000 .997 .005 .001. 4.20 1.34 3.20 -2.09. 7.80 5.24 6.80 1.81. .652 .652 .652 .652. .000 .434 .003 .000. .63 -5.09 1.77 -2.80. 4.23 -1.19 5.37 .80. .652 .652. .005 .000. .77 -7.80 -4.23 -5.37. 4.37 -4.20 -.63 -1.77. 1.000. .652. .434. -.80. 2.80. -5.000*. .652. .000. -6.80. -3.20. 2 3. 1 1 3 2 4 4. 1.000 6.429* -5.000* 3.000* -2.571* 3.143*. 3 4. 1 1 2 2 4 3. 6.000* 3.286* 5.000* .143. 4 1. 1 2 2 3 3 4. *Means difference 2is significant1 at .05 level. 3 at .05 level. *Means difference is significant 4. 2.429* 3.143* 3.571* -1.000 2.571* -6.000* -2.429* -3.571*. -2.571* .652 .003 associated -4.37 to F is -.77much As in the case of the overall results, the bilateral significance 1for Primary 6.000* .652 .000 4.20 7.80 higher than .05 both in the receptive (.733) and the productive tests (.815) of the Secondary Table 6.3Tukey HSD Education students Education students (Table 7).2Thus, it can be5.000* stated that.652 there .000 are no significant differences 3.20 6.80 4 between ! them. 2.429* .652 .005 .63 4.23. !. As in the case of4 the overall1 results, the bilateral significance to F1.77 is much higher 3.571* .652 associated .000 5.37. Table 7. both ANOVA receptive and(.733) productive for Secondary Education students. than .05 in the receptive and thetests productive tests (.815) of the Secondary 2. 2.571* .77 differences 4.37 Education students (Table 7). Thus, it can be stated that .652 there are.003 no significant ANOVA 3 -2.429* .652 .005 -4.23 -.63 between them.. Sum of squares *Means difference is significant at .05 level. R Inter-groups 30.000. ! P!. df8. Quadratic mean. F. Sig.. 3. 10.000. .430. .733. .314. .815. Intra-groups 557.714 24 23.238 Table 6. Tukey HSD for Primary Education students Total 587.714 27 Inter-groups. 24.429. 3. 8.143. As in theIntra-groups case of the overall621.429 results, the bilateral 24 significance 25.893associated to F is much higher than .05Total both in the receptive 645.857(.733) and27the productive tests (.815) of the Secondary Education students (Table 7). Thus, it can be stated that there are no significant differences between them. Table 7. ANOVA receptive and productive tests for Secondary Education students. 8. As regards the comparison between the results of the dictionary task and the participants’ opinion about dictionary use, the overall Pearson correlation coefficient is indeed significant (see Table 8). This means in practice that, in general terms, the success in the task by virtue of dictionary use may lead the user to think highly of this tool.. punct_dictio. Pearson correlation. punct_dictio. opinion. 1. .552(*). 97.
(17) squares R. P. df. mean. F. Sig.. .430. .733. .314. .815. Inter-groups. 30.000. 3. 10.000. Intra-groups. 557.714. 24. 23.238. Total. 587.714. 27. Inter-groups. 24.429. 3. 8.143. Intra-groups. 621.429. 24. 25.893. Total. 645.857. 27. Porta Linguarum. Nº 20, junio 2013. Tablethe 7. ANOVA receptive and productive testsof forthe Secondary Education students As regards comparison between the results dictionary task and the participants’ opinion about dictionary use, the overall Pearson correlation coefficient is indeed significant regards the comparison between that, the results of theterms, dictionary task and in thethe participants’ (see As Table 8). This means in practice in general the success task by virtue opinion about dictionary use, the overall Pearson correlation coefficient is indeed of dictionary use may lead the user to think highly of this tool.. significant (see Table 8). This means in practice that, in general terms, the success in the task by virtue of dictionary use may lead the user to think highly of this tool.. Table 8. Overall Pearson correlation coefficients.. punct_dictio. punct_dictio. opinion. 1. .552(*). Pearson correlation Sig. (bilateral). .041. N opinion. Pearson correlation. 14. 14. .552(*). 1. Sig. (bilateral) N. .041 14. 14. * Correlations is at significant 0,05 level (bilateral). * Correlation is significant 0,05 levelat(bilateral) Table 8. Overall Pearson correlation coefficients. 5. Discussion. 5.DISCUSSION. As can be seen above, results point to a different behavior as regards task performance As can be seen above, results point to a different behavior as regards task performance on on the part of the two student levels. Whereas Primary Education students show significant the part of the two student levels. Whereas Primary Education students show significant differences in the four tasks, differenceswere werefound found in Secondary Education differences in the four tasks,no nosignificant significant differences in Secondary Education students. We observed that that the the dictionary diddid notnot seem to have thethe positive effect onon acquistudents. We observed dictionary seem to have positive effect that we expected, as it was predicted ILH. sitionacquisition that we expected, and asand it was predicted by by thetheILH. One for for that that is theislack training in dictionary use. In the use. case of Onepossible possiblereason reason theoflack of training in dictionary In Primary the case of Education students, the dictionary seemed to be conceived more as an obstacle as a than Primary Education students, the dictionary seemed to be conceived more as an than obstacle helping tool. While carrying out the dictionary task, students spent too much time in as a helping tool. While carrying out the dictionary task, students spent too much time in looking up the words. They also felt frustrated and anxious because not always would they be 9 this task even asked to change their group. able to find them. Some of the participants in In the same line scores for Secondary Education students were not very optimistic either. Although there were not important differences from the other three tasks, students dealing with the dictionary task did not perform better in the vocabulary tests. We observed that the other groups felt more comfortable with the other tasks. In addition, many members of the group working with the dictionary were unable to find the correct option in case they found a polysemous word. This fact reflects that problems were beyond the dictionary use, and that other linguistic weaknesses could be in the root of the dictionary misuse. However, and curiously enough, and despite drawbacks, when we asked students about the use of the dictionary, both Primary and Secondary Education groups in general showed a positive attitude towards this tool. What is more, even though results were not the expected ones, it was found that those who showed a positive attitude towards the dictionary performed better in that task than those who did not.. 98.
(18) Gema Alcaraz y Ángela Almela. The Bilingual Dictionary and Foreign Language.... Students think that the dictionary can be a helpful tool, as long as you know how to use it. However, it becomes a double-edge sword if we cannot make an adequate use. In fact, the misuse or no use of the bilingual dictionary can lead to a negative attitude towards this tool, which at the same time can have a negative effect on acquisition as we can infer from the results of our study. Given this situation, we can pose two questions: why this reticence on the part of students to using this tool and how can we change this situation. As regards the first question, part of the origin of this unwillingness might be found in the concept that some people have of the Communicative approach for language teaching. That is to say, given some aspects of the Communicative method it can be understood as avoiding translation to the L1. Consequently, the use of the bilingual dictionary within this methodological framework is barely considered. This runs somehow counter to real situations that normally occur in the classroom. One of the most common questions posed by students during a L2 lesson concerns the meaning of some L2 word. If our students have an elementary L2 level, it is very difficult to solve the problem of L2 meaning through the L2 itself. This is what is called the «beginners paradox». That is to say, as the beginners’ knowledge of the foreign language is very limited, it is difficult for them to learn to solve problems of meaning through the use of the L2. The L2 level of elementary students is too low for them to sort out their understanding problems with just the L2. As for the second question, an introduction of a training program is suggested. This program should make students aware of linguistic phenomena such as polysemy and homonymy. It should also call the students’ attention on morphology and other types of information that is found in dictionary entries, and finally it should present the context as an ally rather than an enemy. That is to say, the context can offer information about the word, which can be used when looked up in the dictionary. In this line, it is also important the role of the teacher in transmitting a positive attitude towards the bilingual dictionary, both implicitly and explicitly. She should highlight the value of this tool, leaving aside too radical postures. Finally, the use of the bilingual dictionary can also contribute to the students’ autonomy. In other words, the dictionary reinforces the learners’ ability to monitor their own learning process. They are able to solve some of their L2 problems on their own without resorting to the teacher. This fact is highly positive as it motivates students, encouraging them to take the bridles of their own L2 learning process.. 6. Final. remarks. The present study deals with the students’ use of the bilingual dictionary at two levels: Primary and Secondary education. Contrary to what it is suggested by the ILH, those working with a dictionary task got worse results in vocabulary tests than those who carried out other type of task. Yet, positive attitude towards the bilingual dictionary on the part of some students had an effect on vocabulary acquisition.. 99.
(19) Porta Linguarum. Nº 20, junio 2013. Therefore, the main action to be taken is to introduce and reinforce the use of the bilingual dictionary at all levels. It is important for students to become familiarized with this tool. Otherwise, their lack of familiarity might lead to a negative attitude towards it, which might negatively affect acquisition.. 7. References Carrell, P., Devine J. and Eskey, D. (eds.) (1988). Interactive Approaches to Second Language Reading. Cambridge: Cambridge University Press. Cote, M. and Tejedor, C. (1998). «La enseñanza de vocabulario y el uso del diccionario», in Encuentro. Revista de Investigación e Innovación en la clase de idiomas, 10: 26-35. Craik, F. and Lockhart, R. (1972). «Levels of processing: A framework for memory research», in Journal of verbal learning and verbal behaviour, 11: 671-84. Craik, F.I.M. and Tulving, E. (1975). «Depth of processing and the retention of words in episodic memory», in Journal of Experimental Psychology: General, 104, 268-294. Escott, J. (2008). A pretty face. London: Dominoes Publishers. Fraser, C. (1997). «The role of consulting a dictionary in reading and vocabulary learning», in Canadian Journal of Applied Linguistics, 2, 2: 73-89. Gardner, H. (1993). Multiple Intelligences: The Theory in Practice. New York: Basic Books. Hosenfeld, C. (1984). «Case studies of ninth grade readers», in J.C. Alderson and A. H. Urquhart (eds.), Reading in a foreign language. London: Longman, 231-44. Hulstijn, J. and Laufer, B. (2001). «Some empirical evidence for the involvement Load Hypothesis in vocabulary acquisition», in Language Learning, 51, 3: 539-58. Hulstijn, J., Hollander, M. and Greidanus, T. (1996). «Incidental vocabulary learning by advanced foreign language students: the influence of marginal glosses, dictionary use, and reoccurrence of unknown words», in The Modern Language Journal, 80, 3: 327-39. Knight, S. (1994). «Dictionary use while reading: The effects on comprehension and vocabulary acquisition for students of different verbal abilities», in The Modern Language Journal, 78, 3: 285-99. Laufer, B and Hulstijn, J. (2001). «Incidental vocabulary acquisition in a second language: the construct of task-induced involvement», in Applied Linguistics, 22: 1-26. Laufer, B. (2005). «Lexical Frequency profiles: From Monte Carlo to the Real World. A response to Meara», in Applied Linguistics, 26, 4: 582-88. Luppescu, S. and Day, R. (1993). «Reading dictionaries and vocabulary learning» in Language Learning, 43: 26387. McLaughlin, B. (1978). «The monitor model: Some methodological considerations», in Language Learning, 28: 309-32. Nation, I.S.P. (1990). Teaching and learning vocabulary. Boston, MA: Heinle and Heinle.. 100.
(20) Gema Alcaraz y Ángela Almela. The Bilingual Dictionary and Foreign Language.... Rubin, J. (1975). «What the ‘good language learner’ can teach us», in TESOL Quarterly, 9: 41-51. Schmitt, N., Schmitt, D. and Clapham, C. (2001). «Developing and exploring the behaviour of two new versions of the Vocabulary Levels Test», in Language Testing, 18, 1: 55-88. Songhao, L. (1997). «Dictionary use as a way of learning vocabulary in SLA: A preliminary study», in Directions: Journal of Educational Studies, 36, 1: 82-99.. 101.
(21)
(22)
Figure


+4
Documento similar
The aim of the present study was to analyse the relationships between psychological factors (the Pain Catastrophizing Scale, Tampa Kinesiophobia Scale and Self-Efficacy Scale) and
Bausseron [60] underscore the modulating role of self-efficacy in the relationship between emotional intelligence and academic performance in secondary school students; finally,
The study of second language acquisition is always being updated and new data about the students and teachers’ attitudes towards the use of Spanish in ELT
Castillo and Molina-García, 2009). The aim of this study is to ascertain the links between physical activity and general self-efficacy and life satisfaction constructs, as well as
The aim of the current study is to analyse the relationship established between the level of intensity and directionality of anxiety and perceived self-confidence and
The data for learning self-regulation (higher values in this variable mean that the students used more strategies oriented to learning goals) is coming from the
In the UNA-CR population, some self-efficacy variables stand out for having averages bigger than 5 and percentages of teachers in training who perceive they have those
This study aimed to determine the level of digital competence of Dual Vocational Training teachers (Dual VET) [22,23], as this is a key factor of analysis and study in direct
