Measuring
regional
differences
in
users'
perceptions
towards
interurban
toll
roads
Juan
Gomez
,
Anestis
Papanikolaou
,
José
Manuel
Vassallo
a b s t r a c t
Public acceptability is crucial to achieve the successful implementation of certain policy initiatives. In the trans-port sector, this is especially relevant for toll roads since they entail a burden to the users. Previous literature in thisfield has mainly focused on analyzing the influence of different individual characteristics on attitudes to-wards road charges, without clear results. However, other context-specific drivers such as regional parameters may also play an important role to explain users' attitudes, especially when the implementation of tolls within the same nation varies throughout regions. The goal of this paper is to analyze regional differences in users' per-ceptions with regard to tolls as an appropriate way tofinance the provision of road infrastructure. Based on a na-tionwide survey conducted to road users in interurban toll roads in Spain, we develop a multilevel logit model to explore regional differences in drivers' perceptions. The research concludes that differences identified seem to be more influenced by context-specific variables, related to either the characteristics of the toll road or the region, than by the characteristics of the individuals. The paper also underlines the negative effects of an asymmetrical distribution of toll roads across regions on users' perceptions, since those territories especially suffering the bur-den of tolls show a more negative attitude towards road charging.
Keywords:
Regional differences Users' attitudes users' perceptions Toll road Multilevel model Spain
1. Introduction
Public acceptability has traditionally been identified as one of the key drivers to achieve a successful implementation of different policy initiatives (Marciano et al., 2014; Aitken et al., 2014). Regarding the transport sector, this is especially relevant in the case of road charging strategies (Zheng et al., 2014; Kockelman et al., 2009), that is being a policy increasingly adopted by governments to collect stable resources
to face budgetary constraints. In this respect,Dill and Weinstein
(2007)claim that policy makers must seek to recommend options that not only have strong public support, but are also desirable in terms of equity, ability to generate stable revenue, capacity to encourage environmentally responsible choices, etc.
Despite the increasing literature on attitudes towards tolls and acceptability of road user charges, there is a need for a more compre-hensive approach (Kallbekken et al., 2013). The existing literature has traditionally analyzed the influence of individual characteristics (age, income, trip purpose, etc.) on perceptions towards toll roads, leading to inconclusive results (Gehlert et al., 2011). By contrast,
no previous efforts have been made to include explanatory variables at the regional level or specifically address regional differences on toll road acceptability. This approach may be crucial when road charging characteristics greatly vary across regions within the same nation.
Spain constitutes an interesting case in the international context to explore regional differences on users' attitudes towards toll roads. While the current Spanish high capacity road network is one of the lon-gest ones within Europe, it is made up of both tolled and free roads asymmetrically distributed across regions. As pointed out byVassallo et al. (2012), this is due to the changes over time of the road transport policy implemented by different governments. As a result, while some regions such as Catalonia or Valencia have a dense toll motorway net-work, the percentage of free high capacity roads is significantly higher in other areas of the country. As pointed out byGomez et al. (2015), this heterogeneity has provoked negative sentiments towards road charging in certain regions along with political complaints. In fact, pro-test groups and associations have recently appeared in some regions of Spain (such as Catalonia) to coordinate actions against tolls because of the sentiment of unfairness perceived when compared to the rest of Spaniards.
facilities across regions. Based on a nationwide survey conducted in in-terurban toll roads, we develop a multilevel logit model to measure the influence of individual, road-related and regional variables in users' perceptions.
This paper is organized as follows. After this introductory chapter,
Section 2summarizes the state of knowledge on perceptions towards
road charges and identifies some research gaps in the literature.
Section 3describes the data collected from a survey conducted to road users and the explanatory variables included in this research.
Section 4outlines the multilevel methodology adopted to explore re-gional differences in drivers' attitudes, andSection 5presents and dis-cusses the results. Finally,Section 6shows the main conclusions and points out further research.
2. Literature review
Previous studies on attitudes towards road charging have been mainly focused on urban contexts, with special attention to the imple-mentation of congestion charging systems in city centers (Furst and Dieplinger, 2014; Schuitema et al., 2010; Gaunt et al., 2007). By contrast, the literature analyzing perceptions on interurban areas is still limited and primarily concerns residents' perceptions rather than users' (Kockelman et al., 2009; Dill and Weinstein, 2007).
Till now, research efforts have been mainly directed towards mea-suring the influence of individual socioeconomic factors (age, gender, income, etc.) on road pricing attitudes. These studies—potentially useful to target specific user market segments—have not generally led to con-clusive and coincident results about the influence of these types of
var-iables on attitudes as noted byYusuf et al. (2014)andOdeck and
Kjerkreit (2010). Because of this lack of evidence, some authors (Schade and Schlag, 2000; Rienstra et al., 1999) have pointed out that socioeconomic factors might have a somewhat lesser impact on accept-ability than other drivers such as attitudinal factors.
The study of the acceptability of toll road pricing constitutes a com-plex issue that can be approached from different perspectives (Zheng et al., 2014) such as the perceived fairness of charges (Cools et al., 2011; Fujii et al., 2004), political bias (Hårsman and Quigley, 2010) or existing community values (Yusuf et al., 2014). Particularly,Smirti et al. (2007)acknowledged that the level of acceptability may some-times be highly context-specific, so attitudes may change across roads or, at an upper level, even across territories with different characteris-tics. Despite the fact that the literature admits this problem, as of today, little effort has been made to incorporate the regional perspective in the acceptability analysis, or to measure regional differences on users' perceptions towards road charging.
There are some research studies dealing with regional differences in certain transport modes such as air transport (Alberts et al., 2009) or
maritime (Castillo-Manzano and Fageda, 2014; Oosterhaven et al.,
2001). However regional differences have scarcely been addressed for road transport issues, and when analyzed they have been limited to spe-cific areas such as road safety (Tolon-Becerra et al., 2013; Eksler et al., 2008; Lassarre and Thomas, 2005), or spillover indicators ( Condeço-Melhorado et al., 2011). The papers bySandow (2008)andAbane (2011)are among the few studies in the literature incorporating the geographic perspective in the analysis of travelers' behavior.
Regarding acceptability towards road charging, some research stud-ies made a preliminary approach to regional differences.Podgorski and Kockelman (2006)analyzed public support for toll roads in Texas, and found that those regions with small urban areas were more receptive to road charging. According to the authors, this result may be influenced by the fact that residents could be thinking of tolls not applied to roads in their areas. Also focusing on Texas,Kockelman et al. (2009)identified a higher support in those regions having past positive experiences with toll roads. In the same line, the study byDill and Weinstein (2007)in California pointed out that regional experience with toll facilities ap-peared to increase support for tolling.
Despite the interest of thesefindings regarding road charging ac-ceptability, there is still room for a different types of analysis that models users' instead of residents' perception. In addition, when focus-ing on regional differences, it is possible to use hierarchy in the survey data to properly address differences among respondents and therefore
avoid the so-called may“atomistic fallacy”(see more comments in
Section 4), present in some of the researches previously mentioned. To sum up, some research gaps can be identified concerning the cur-rent state of knowledge in this topic. First, further explanatory variables than individual characteristics—such as regional parameters or tolling infrastructure attributes—need to be addressed to have a more thor-ough picture. Second, the existing literature has not specifically focused on users' attitudes but on public perceptions in general. And third, we are not aware of any previous research mainly focusing on regional dif-ferences on users' perceptions towards toll roads that use specific modeling techniques for this purpose.
3. The data: a nationwide survey in Spanish toll roads
In order to measure users' perceptions towards interurban toll roads and explore potential differences across regions, we develop a multilev-el binary logit analysis. To that end, we collected data from a nationwide survey (seeAppendix 1) developed in several Spanish interurban toll roads in 2010. With the aim to identify potential regional differences not in public acceptability but in drivers' perceptions, the questionnaire was specifically addressed to users of interurban toll roads. It was con-ducted between October and November, 7-days a week in order to get a representative sample in terms of users' trip purpose, since its distri-bution generally vary during the week. The data was collected from per-sonal interviews at service areas or petrol stations near the existing tolling infrastructure. We stratified the sample in order to achieve suffi -cient representativeness at the regional level.
As this paper is mainly focused on identifying regional differences in users' attitudes, the network covered in the survey includes the Spanish regions with a toll road network homogeneously distributed over the territory. The network surveyed combines regions with mature toll roads, where user charging was implemented decades ago, along with regions with a more recent toll network. Catalonia, Madrid, Valencia, the Basque Country and Galicia were the cases ultimately selected for this research. Other potential regions (Andalusia, Castilla-La Mancha, Castilla y León) were not included in the end because toll roads are lo-cated only in specific areas of the region. This may result in users' per-ceptions towards tolls widely varying over the same region, making the analysis more difficult.
Then, the network ultimately surveyed comprises all the interurban toll roads starting and/or ending in the 5 regions selected. The sample includes respondents selected in a balanced way from the regions cho-sen (seeAppendix 2). The data size is large enough to be considered representative for each region. In total, 2769 users from 30 toll roads were surveyed. The resulting sample, made up by 2264 km, can be also considered representative of the Spanish toll network, as it includes around 75% of total tolled km in the country. We would like to note that it is among the longest interurban toll road systems ever surveyed in the literature.
The data was collected through face-to-face questionnaires especial-ly designed for research purposes. In order to capture respondents' atti-tudes towards toll roads, the questionnaire requested them to report whether they considered tolls as an appropriate way tofinance the pro-vision of road infrastructure. This is an approach previously adopted to
measure respondents' road charging acceptability such as inOdeck
and Brathen (2008). Their answers at this point are the dependent var-iable to be modeled through the multilevel logit specification detailed below.
through personal interviews. Secondly, we incorporated a set of explan-atory variables regarding the attributes of tolling infrastructure. This represents the second level in the model. Finally, a group of regional pa-rameters made up the third level of data. As can be seen, although the main objective of the research was to identify potential regional differ-ences on users' perceptions, the inclusion of an intermediate level concerning the characteristics of the toll infrastructure was necessary to properly take into account the existing hierarchy in the data. In this respect, potential heterogeneity may appear in users' perceptions among toll roads, given some differences observed in terms of physical or charging attributes.
Individual characteristics of users, as well as attitudes towards toll roads, were collected through face-to-face questionnaires (see details inAppendix 1). In thefirst part, drivers were asked about their socioeco-nomic and transport-related characteristics (age, level of income, type of vehicle used, trip purpose, etc.), generally grouped into different cat-egories as shown inTable 1. Among further explanatory variables po-tentially determining individuals' perceptions towards tolls, the political beliefs can be identified as a relevant one. However, due to the objection frequently shown by respondents to report ideological concerns in some regions of Spain, the current research approached this issue at the regional level by analyzing the political atmosphere of each region.
The second level of data in the model was made up of infrastructure attributes, including physical and charging characteristics with regard to the toll road used. Although it is acknowledged that the level of
ac-ceptability towards road pricing may be highly context-specific
(Smirti et al., 2007), the characteristics of the tolling infrastructure
have not been explicitly incorporated as explanatory variables in previ-ous modeling approaches. They are expected to have a significant infl u-ence on users' attitudes, and also to be useful to explain potential differences among users of different types of toll roads.
Among the road infrastructure variables, wefirstly included the
quality of the free parallel road available in each case, since it increases the possibility for users to skip tolls and therefore might be a significant explanatory factor to determine users' perceptions. It is important to note that in Spain it is a requirement that every toll concession has a free parallel road available in the same corridor. The binary variable adopted distinguishes between toll roads whose free alternative route is a conventional (two-lane) road, generally with poor quality, and those ones competing with high capacity roads (highways). Additional-ly, we included the toll rate per kilometer charged in each road as an ex-planatory variable, in order to capture the potential effect of the charging level on users' perceptions. This parameter was collected from the Spanish Ministry of Transportation database (Ministerio de Fomento, 2011a). Finally, a binary variable was considered to differenti-ate between purely interurban toll roads and tolled point sections (tunnels).
Finally, the third level of data is made up of a set of independent var-iables at the regional level in order to explain potential differences in users' attitudes across regions. Firstly, GDP per capita—expressed in 1000 Euro/person—intends to capture the influence of the average stan-dard of living within each region on toll road acceptability, in a similar way as other papers measuring public acceptability (Karlsdotter et al., 2009). Moreover, an explanatory variable referring to the abundance of toll roads in each region is inserted in the model. This variable is Table 1
Description of variables included in the research.
Variable Subgroup Respondents % Sample
Dependent variable
User perception towards toll roads
Positive 1451 52.4
Negative 1318 47.6
Explanatory variables
Individual characteristics Gender Male (base reference) 1454 52.5
Female 1315 47.5
Age Under 24 (base reference) 148 5.3
From 24 to 34 453 16.4
From 35 to 49 1153 41.6
From 50 to 64 773 27.9
Above 64 242 8.7
Type of vehicle Car (base reference) 2452 88.6
Light van 201 7.3
Truck 96 3.5
Moto 9 0.3
Bus 11 0.4
Income Under 20,000 Euro (base reference) 725 26.2 From 20,000 to 30,000 Euro 926 33.4 From 30,000 to 50,000 Euro 394 14.2
Above 50,000 Euro 95 3.4
Not responding 629 22.7
Frequency/type of user Frequent (base reference) 2099 75.8
Occasional 670 24.2
Trip purpose Commuting (base reference) 845 30.5
Business 331 12.0
Weekend leisure 744 26.9
Holiday leisure 534 19.3
Other 315 11.4
Toll roads % Infrastructure characteristics Quality of the alternative route Conventional road (base reference) 22 74.2
Highway 8 25.8
Unitary toll rate (Euro/km) Mean: 0.13 Sd: 0.09 Type of toll infrastructure Road (base reference) 26 87.1
Tunnel 4 12.9
measured as the percentage of high capacity road km being tolled with-in each particular region, accordwith-ing to the Spanish Mwith-inistry of Transpor-tation database (Ministerio de Fomento, 2011b). The regions considered in the research show significant variability at this point given that a great proportion of the high capacity network is tolled in regions such as Catalonia (47.2%) or the Basque Country (41.2%), while this percent-age is much lower in other regions such as Madrid (14.9%). In that
re-spect, we may expect that those regions with a higher presence—in
relative terms—of toll roads might show a more negative attitude. Political beliefs have also been identified as a driver potentially influencing perceptions towards road charging (Hårsman and Quigley, 2010). We approach the effect of the political atmosphere in each region by considering the general support obtained by either right- or left-wing parties. Notwithstanding the fact that a complementarity with data at the individual level would have been highly desirable, analyzing the effect of the political climate on users' perceptions remains a rele-vant issue given the key role played by the regional governments of Spain in social and economic beliefs. Specifically, we included the per-centage of votes obtained by left-wing parties in the last regional elec-tions in the country. We may expect that the political climate may be less supportive of tolls in regions governed by socialist/communist parties, while a higher presence of conservative parties would favor more positive attitudes towards toll roads. In addition, we include an explanatory variable concerning the support for nationalist/regionalist parties (those parties supporting more independence from the central government or even full independence) within each region, with the aim to measure the influence of nationalist feelings on general attitudes towards tolls. The reason behind that is the great opposition against tolls by nationalist parties in certain regions such as Catalonia.
Table 1summarizes the main characteristics of the data sample. A balanced proportion of men and women were surveyed, with a higher presence of people aged between 35 and 49 (41.6%). Furthermore, we observe users' income typically lying below Euro 30,000, and a vast ma-jority of cars (88.6%) regarding the type of vehicle used. The high share of respondents (22.7%) not reporting their income is also noticeable. Commuting (30.5%) and weekend leisure (26.9%) are the most common trip purposes in the sample, with a high proportion of respondents (75.8%) makingN8 trips per month (frequent users).
Concerning toll infrastructure, a significant percentage of the sample drives in interurban toll roads competing with conventional roads. It can be noted that, for the network surveyed, there is a great asymmetry across regions regarding the alternative to the toll road (seeAppendix 2). Tolled sections competing with free highways are numerous in re-gions such as Madrid, while in the Basque Country or Catalonia the al-ternative route is generally made up of a conventional (two-lane) road. Some variability is also found in other explanatory variables such as the toll rate applied, nationalist/regionalist feelings or abun-dance of toll roads across regions. Finally, we would like to note the bal-anced proportion of respondents in the sample from the 5 regions surveyed: Catalonia (20.1%), Valencia (20.3%), Madrid (19.8%) the Basque Country (20.1%), and Galicia (19.6%). The sample reached a data size large enough to be representative of toll road users in each ter-ritory. Further details about the survey conducted to collect the data for this research can be found inGomez et al. (2015).
4. Methodology
In order to measure users' perceptions towards interurban toll roads and explore potential differences across regions, we develop a multilev-el binary logit modmultilev-el. This type of specification represents an extension of the classical regression models, in the sense that they take into ac-count potential correlation between data observations due to hierarchi-cal or nested structures in the data.
When hierarchically/nested structured data are present in the sam-ple, classical regression models become not valid since the assumption of independent observations is violated (Koppelman and Bhat, 2006).
In this case, we can expect that observations belonging to the same group may share common characteristics while being also different from other existing groups. Failing to account for these differences may lead to the so-called“atomistic fallacy”, with important negative consequences in the results. Firstly, a misinterpretation of estimates is commonly associated, since inferences regarding variability across groups are drawn based on the individual level of data (Hox, 2002). Sec-ondly, it may lead to spurious statistical significances of parameter esti-mates in the model, due to an underestimation of the standard errors calculated. As underlined byGoldstein (2003), these limitations can be overcome by using multilevel (or hierarchical) models, since they rec-ognize the existence of such data hierarchies.
Based on a more complex structure, multilevel specifications consid-er a diffconsid-erent model for each level of data. This also allows exploring inter-group variability at different levels. Among other advantages, these models make possible not only to quantify the relationship be-tween variables within the same level, but also to estimate their infl u-ence on other levels defined in the data.
For our research, we apply the standard multilevel approach, based on random coefficients, that has been widely described in the literature (de Leeuw and Meijer, 2007). In order to model users' acceptability to-wards toll roads, this technique is combined with a logit specification given the binary nature of the dependent variable (seeSection 3). Par-ticularly, we model the probability that respondents consider tolls as an appropriate mechanism tofinance the provision of roads.
Binary choice models fall into the category of utility maximization models, assuming that a person chooses the alternative with the higher utility (Ben-Akiva and Lerman, 1995; Train, 2003) among all the options available. The utility of each choice (Uik) is a random variable that can be
determined by a number of explanatory parameters Xp. The binomial
logit approach developed in this research follows the standard proce-dure so for further detail the reader is referred toGujarati and Porter (2004);Koppelman and Bhat (2006)orTrain (2003).
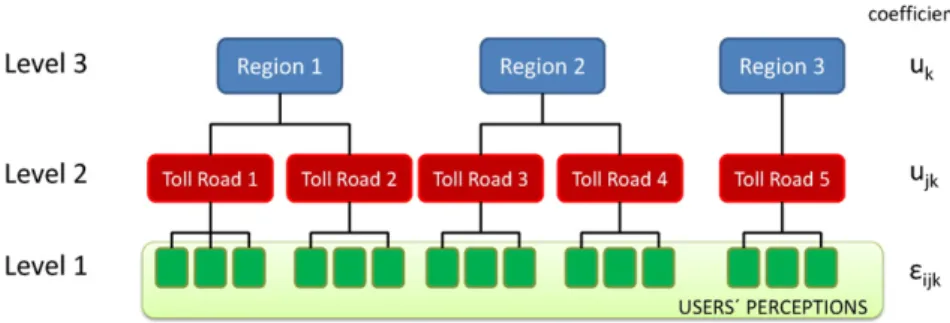
Simultaneously, the model accounts for the hierarchical level of the data by adopting the multilevel technique. The data needed for the re-search were collected from different toll roads, which can be subse-quently grouped into regions (see an illustrative example inFig. 1; the specific application to the case study selected is included inAppendix
3). Therefore, the modeling framework was assigned a three-level
structure (i–j–k). Subscript i is related to individuals, while j and k refer to the toll road and regional level, respectively. As in every multi-level approach, higher multi-levels of the hierarchy (toll roads and regions) are considered themselves a sample from a general population of toll roads and regions.
The model comprises random effects at both intercepts and slope parameters, allowing random variations among toll roads (j) and re-gions (k), as shown below in a general form:
Yijk¼β0ð Þnjkþβ1ð ÞnjkX1ijkþ…þβp nð ÞjkXpijkþεijk
β0ð Þnjk¼β0ð Þn þujkþuk; βp nð Þjk¼βp nð Þþujkþuk ð1Þ
whereβ0(n)jkis the model intercept, consisting of afixed interceptβ0(n), a random variation ujkof this intercept across toll roads and a random variation ukof this intercept across regions, in a similar way as in
Papadimitriou et al. (2014). Then, it allows intercepts to vary randomly at each different level (toll roads and regions). In a similar way,β1(n)jkis the coefficient for explanatory variable X1, also allowing variability across toll roads (j) and regions (k). Finally,ɛijkis the common idiosyn-cratic error. Therefore, it is possible to structure the total variation in the model into three different error terms:
Eijk¼ukþujkþεijk ð2Þ
divergences between responses are due to unobserved regional (toll road) differences, and not to differences across respondents. Additional-ly, a significant random slope with regard to regions (toll roads) means that the influence of a certain explanatory variable Xpdoes significantly vary across regions (toll roads).
The explanatory variables in the model comprise individual charac-teristics (Xijk), toll road attributes (Xjk) and regional parameters (Xk), as it was explained more deeply inSection 3. Given the different level of the independent variables, the hierarchical analysis followed the
tradi-tional stepwise procedure, developed in greater detail by Murillo
(2008), among others. Through this method, subsequent models are generated by gradually incorporating the explanatory variables into the analysis:
- Model 0: only including intercepts and random effects (no explana-tory variables).
- Model I: incorporating individual characteristics to the model. - Model II: adding toll road attributes to the analysis.
- Model III: including regional parameters in the model.
Throughout this process, the model repeatedly evaluates the im-provement in thefitting of the model that is achieved due to the gradual inclusion of new explanatory variables. Along with this, the methodolo-gy makes possible to check the statistical significance of the random ef-fects included, in both intercepts and slope coefficients, for the different levels of data.
5. Choice modeling results and discussion
5.1. Definition of the model and preliminaryfindings
This section reports the main results coming out from the multilevel analysis modeling users' perceptions towards toll roads. Before showing the estimates calculated through the binomial logit specification de-scribed inSection 4, some preliminaryfindings for certain explanatory variables, particularly categorical ones, are presented in Table 2. Concerning the whole sample, the majority of respondents (52.4%) were positive towardsfinancing the provision of road infrastructure through a toll mechanism. Although atfirst glance this attitude seems to be fairly homogeneous throughout certain subsamples, noteworthy differences can be identified in some cases, especially when we disag-gregate the results by region.
With regard to individual characteristics, we observe that users' per-ceptions do not vary too much depending on gender. Positive attitudes towards toll roads for men (52.5%) are only slightly higher when com-pared to women (52.2%). The same distribution is also found in the sam-ple concerning trip frequency of use, with a slightly more positive perception for frequent users.
Furthermore, toll road acceptance seems to increase to some extent with age, if we exclude respondents under 24. The survey shows that
49.4% of users between 24 and 34 consider that tolling is an adequate mechanism tofinance the provision of roads, while this percentage in-creases up to 59.9% for respondents aged above 64. It can also be found that, the higher the income (particularly above 50,000 Euro), the more positive the users' attitudes towards toll roads. Thisfinding is in line with other previous results referred to in the literature (Odeck and Kjerkreit, 2010).
Fig. 1.Hierarchy in users' perceptions considered in the multilevel model adopted: illustrative example.
Table 2
Users' perceptions towards toll roads. Preliminary results in percentage for categorical variables.
Level of data Dependent variable Perception towards toll roads (%) Explanatory variables Positive Negative
Total sample 52.4 47.6
Individual Gender
Men 52.5 47.5
Women 52.2 47.8 Age
Under 24 54.7 45.3 From 24 to 34 49.4 50.6 From 35 to 49 50.7 49.3 From 50 to 64 53.9 46.1 Above 64 59.9 40.1 Type of vehicle
Car 53.5 46.5
Light van 45.9 54.1 Truck 49.0 51.0
Moto 81.8 18.2
Bus 40.0 60.0
Income
Below 20,000 Euro 51.2 48.8 From 20,000 to 30,000 Euro 52.9 47.1 From 30,000 to 50,000 Euro 56.1 43.9 Above 50,000 Euro 60.7 39.3 Not responding 51.6 48.4 Frequent 52.5 47.5 Frequency/Type of user
Occasional 52.2 47.8 Trip purpose
Commuting 49.8 50.2 Business 55.3 44.7 Weekend leisure 54.6 45.4 Holiday leisure 52.6 47.4 Other 50.8 49.2 Road infrastructure Type of tolled infrastructure
Interurban road 52.2 47.8 Tunnel 61.6 38.4 Quality alternative
If we focus on the influence of road infrastructure characteristics, some heterogeneity on users' attitudes can be noticed depending on the quality of the alternative road. Drivers are significantly more posi-tive towards toll roads (63.4%) when the free parallel road happens to be a high capacity road. This contrasts with a lower support (49.8%) in the case that the competing road was of low quality. These results may reflect that the absence of high quality free alternatives forces drivers, in a certain way, to use toll roads to save travel time thus influencing their attitudes towards tolling.
Some heterogeneity is also observed regarding users' attitudes when we analyze the results by region. As can be seen, users' acceptability in Catalonia is low (39.6%), while in Madrid is relatively high (65.1%). Other regions such as the Basque Country or Galicia show a more mod-erate position, with positive attitudes being around 55%. The asymmet-rical density of toll roads throughout the nation might be one of the reasons explaining regional differences because it causes a perceived sentiment of unfairness. In fact, only 14.9% of the high capacity network is tolled in Madrid, while this percentage is significantly higher in other regions surveyed, such as the Basque Country (41.2%) and specially Cat-alonia (47.2%).
In order to check the validity of these preliminaryfindings, a multi-level logit specification has been calibrated. The model estimates the probability of being positive towards toll roads—that is, to consider tolls as an appropriate way tofinance the provision of roads—and mea-sures the influence of different explanatory variables on this attitude. As pointed out above, the multilevel specification is a suitable econometric technique for exploring regional and inter-road differences from the sample.
Before setting up the multilevel model, some tests for checking multicollinearity between the explanatory variables were applied. The analysis showed that the regional parametersnationalist/regionalist feel-ingsandabundance of toll roads(seeTable 1) were highly correlated and thus statistically not independent of each other (correlation coeffi -cient = 0.98). Despite the fact that these variables refer to very different aspects, such a high multicollinearity level does not make possible to separate the partial effect of each explanatory parameter (Gujarati and Porter, 2004) and thus one of them needs to be removed from the model. Given its expected greater influence to explain regional differ-ences in users' perceptions, we opted for keeping the abundance of toll roads within a region as an explanatory variable in the model.
Following the usual procedure for exploring regional differences through a multilevel specification, we developed a stepwise analysis. Firstly, a so-called Model 0 or“empty model”was run to test whether random variation across regions (level 3) and toll roads (level 2) are a significant part of the total variation between responses. After that, sub-sequent models were generated by gradually incorporating explanatory variables concerning individual characteristics (level 1), road infrastruc-ture attributes (level 2) and regional parameters (level 3). Throughout this process, random variation across groups (regions and toll roads) was tested not only for intercepts but also for slope coefficients. In order to make the paper more concise, only results from the initial
andfinal models are displayed in the paper. The intermediate results produced (Models I and II) can be checked in the Appendix section.
Table 3includes different estimates for the zero model. Firstly, Model 0.A allows random intercepts for both the regional and toll road level. As can be seen, the standard deviation of random intercepts for regions is highly significant (p-value = 0.004), while no significant toll road group effect is found in the sample (p-valueN0.05). In order to check the statistical significance of the toll road level, we estimated an alternative Model 0.B, only including random effects across regions. By testing the hypothesis of Model 0.B being nested in Model 0.A, differ-ences between likelihood ratios resulted not significant (p-value = 0.145). Therefore, there is no evidence of statistically significant dispar-ities among users from different toll roads. In line withMurillo (2008)
andTrain (2003), we decided to remove random coefficients related to the toll road level (ujk) from the model, and continue the analysis from now on under the assumption of users´ differences with a two-level specification. These authors point out that low or non-significant random effects evidence that groups are not internally homogeneous, so the grouping act has no consequences on the results and observations can thus be considered independent in this case. Random coefficients at the toll road level are then removed in order to avoid false complexity in the model, not supported by the data.
Next, the different explanatory variables were incorporated to the multilevel model, generating Models I to III as set inSection 4. Estima-tion results from Model III—including all the explanatory variables con-sidered in the research—are displayed inTable 4, and discussed below sorted by the type of explanatory parameter: individual, road-related and regional. Estimation results from the intermediate models generat-ed (Models I and II) are shown inAppendix 4.
5.2. Analysis of individual characteristics and road infrastructure attributes
The influence of individual characteristics and road infrastructure at-tributes on users' perceptions was gradually incorporated in the
analy-sis through Models I and II respectively (seeAppendix 4for more
details). Given the small variability of results during the stepwise modeling process, we display the empirical results for thefinal multilev-el specification inTable 4.
Estimates for Model III confirm the relatively low influence of indi-vidual socioeconomic characteristics on acceptability towards road charging, as sometimes identified in the literature (Schade and Schlag, 2000; Rienstra et al., 1999). Despite a less positive perception towards toll roads observed in the case of women, no statistically significant dif-ferences are found throughout the categories established in terms of age, income or type of vehicle.
We can observe that users' perception becomes less negative as the age increases, but the relationship is not statistically significant (p-value N0.05) for any of the intervals established. Frequency of trips does nei-ther have an impact on users´ perceptions towards toll roads, even though a lower acceptability, not statistically significant, can be ob-served for occasional users. Concerning the type of vehicle, no statisti-cally different attitudes are found between e.g. truck and car drivers, despite the distinct effect that tolls may have in the generalized cost for each case. Nevertheless, the type of vehicle revealed to be overall a significant variable to explain users' attitudes towards toll roads, at the light of the results for the LR-test.
A more supportive attitude towards toll roads is found for higher in-come levels, but again a statistically significant influence cannot be con-cluded from this analysis, as inOdeck and Brathen (2008)orBhatt et al. (2008), among others. With regard to trip purpose, almost statistical
differences are identified for business trips when compared to the
base case (commuting). This more positive perception may be caused by the fact that, in some occasions, it is not the employee but the em-ployer who pays for the toll in this type of trips. Furthermore, the LR-test indicates that trip purpose is overall an explanatory variable statis-tically significant to explain users´ attitudes towards toll roads. Table 3
Users' perceptions towards interurban toll roads: estimation results. Model 0. Model Model 0.A Model 0.B Variables Coeff. Std.
error
p-value Coeff. Std. error
p-value
Fixed effects
Intercept 0.109 0.162 0.499 0.102 0.157 0.519 Random effects
Toll road 0.137 0.083 0.099
Region 0.346 0.119 0.004 0.341 0.115 0.003
−2 log likelihood
−1883.20 −1884.28
Likelihood-ratio test (0.B nested in 0.A)
ProbNchi2
Despite the fact that many of the individual explanatory variables in-cluded in the model were not statistically significant, a likelihood-ratio test does not reject the hypothesis of Model 0 being nested in Model I (seeAppendix 4). Therefore, a statistically significant improvement in thefitting of the model was achieved when including individual charac-teristics as explanatory variables. Additionally, we can observe that the standard deviation of random intercepts for regions remains significant but in the same order of magnitude when compared to Model 0. This fact evidences that, from a practical point of view, individual character-istics do not contribute to explain unobserved differences on users' per-ceptions across regions. This issue will be further explored by testing not only the potential influence of individual characteristics on random in-tercepts, but also coefficient variations across regions (see comments
regardingAppendix 5below).
Regarding the influence of road infrastructure attributes on users' perceptions, some trends can be identified from the estimates displayed inTable 4. As pointed out bySmirti et al. (2007), the role of context-specific parameters on users' perceptions seems to be of greater impor-tance than the characteristics of individuals. Regarding the type of toll infrastructure, we can observe that setting tolls in specific spots such as tunnels have for users a higher acceptability than regular interurban roads. According to the estimation results, odds ratio in favor of being positive towards toll roads increases by 53.6% for users of tunnel facili-ties. This result, very close to be statistically significant, may be due to the shorter length and consequently smaller toll payments associated to this type of road infrastructure.
As it is expected the level of the toll rate has a negative influence on users' perceptions towards toll roads. Despite not being statistically sig-nificant, those users driving in more expensive toll roads have a lower acceptability towards road pricing. Finally, the quality of the alternative free route represents a highly significant parameter to explain users' perceptions, in line withSmirti et al. (2007). We can observe that drivers are 34.4% more supportive of being charged in toll roads com-peting with free highways than in toll roads comcom-peting with low quality alternatives. Thisfinding seems reasonable given the fact that, when the alternative is not so good, users are more captive to use toll roads.
Again, a likelihood-ratio test confirms the statistically significant im-provement (p-valueb0.05) reached in the model after the inclusion of infrastructure-specific characteristics (seeAppendix 4). On the other hand, the standard deviation of the random intercepts for regions
re-mains still significant but lower when compared to Model I.
Conse-quently, we can see that road infrastructure attributes contribute to reduce unobserved regional differences on users' acceptability, mainly by taking into account the current heterogeneity across regions in terms of quality of the alternative free road (seeAppendix 2). As pointed out above, in regions such as Catalonia or the Basque Country the alter-native route is generally a conventional (two-lane) road, while in Madrid tolled sections competing with free highways are more numerous.
With the aim to further explore regional differences for the explan-atory variables already considered (individual characteristics and infra-structure attributes), we conducted several supplementary models Table 4
Users' perceptions towards interurban toll roads: estimation results. Model III (including individual, toll road and regional parameters).
Level of data Explanatory parameters Modeling estimates Overall significance (LR test) Coeff. Std. error p-Value p-Value
Fixed effects
Intercept −4.297 0.881 0.000
Individual Gender (base reference: male) 0.001
Female −0.279 0.085 0.001
Age (base eference: under 24) 0.197
From 24 to 34 −0.249 0.219 0.255 From 35 to 49 −0.178 0.207 0.391 From 50 to 64 −0.013 0.214 0.952
Above 64 0.176 0.277 0.525
Type of vehicle (base reference: car) 0.011
Light van −0.251 0.153 0.101
Truck −0.137 0.221 0.537
Moto 1.494 6.486 0.982
Bus −0.767 0.664 0.248
Income (base reference: under 20,000€) 0.317 From 20,000 to 30,000€ 0.080 0.131 0.541
From 30,000 to 50,000€ 0.146 0.169 0.388 Above 50,000€ 0.235 0.299 0.431
Frequency (base reference: frequent user) 0.476 Occasional user −0.066 0.092 0.476
Trip purpose (base reference: commuting) 0.008
Business 0.266 0.136 0.051
Weekend leisure 0.162 0.110 0.140 Holiday leisure 0.087 0.122 0.476
Other −0.049 0.146 0.739
Toll road Type of tolled infrastructure (base reference: road)
0.061
Tunnel 0.429 0.229 0.061
Toll rate −1.481 0.985 0.133 0.133
Quality of the alternative route (base reference: conventional)
0.029
Highway 0.296 0.136 0.029
Region Regional GDP per capita 0.049 0.010 0.000 0.000 % Left-wing parties −0.081 0.015 0.000 0.000 % High capacity roads tolled −0.012 0.004 0.008 0.008 Random effects
Region 1.77 e-06 0.040 0.999
allowing random slopes on predictors. The main results obtained, shown inAppendix 5, make clear that no coefficient variability across regions is present in our sample. Regarding individual characteristics, gender, age or income coefficients do not significantly vary across re-gions, given the highp-value obtained in all cases for both the standard deviation of random slopes and the likelihood-ratio test. Similarly, the analysis does not suggest any regional variation in the slope coefficients concerning infrastructure attributes, such as quality of the alternative route or the toll rate charged.
5.3. Analysis of regional parameters
Finally, estimation results are discussed for the three explanatory variables included at the regional level concerning political beliefs, share of toll roads and average wealth. We should point out again that, due to multicollinearity problems, it was not possible to incorpo-rate the variable related to nationalist/regionalist feelings (measured through the vote to nationalist/regionalists parties) in each territory.
As can be seen inTable 4, despite being statistically significant, the wealth of each region measured through the GDP per capita has very lim-ited influence on users' perceptions. According to the results, for a 100 Euro-increase in the regional GDP per capita, the odds ratio in favor of being positive towards tolling increases by only 0.5%, so toll acceptability remains quite similar for different levels of regional wealth. This is also in line with the results we obtained regarding the influence of the individual level of income on users´ attitudes. Therefore, the average standard of liv-ing within a region seems to play a minor role on toll roads acceptability, at least for the case of Spain. These results contrast withfindings in other areas such as health services (Karlsdotter et al., 2009).
Attitudes towards toll roads are however more noticeably affected by the political atmosphere within the region. This result confirms the
conclusions byHårsman and Quigley (2010)regarding the influence
of political bias on road charging acceptability. Given the negative sign of the coefficient in the model, an increase in the vote to left-wing parties at the regional level reduces the support for toll roads. Thisfi nd-ing makes sense, since Spanish socialist and communist parties promote a greater involvement of the government in the economy, typically as-sociated in Spain to publicly-funded services. This attitude is then polit-ically opposed to paying a toll for using roads. We can also note that this conclusion deserves to be complemented with an analysis of the infl u-ence of political beliefs at the individual level.
Additionally, as might be expected the density of toll roads within a region significantly influences users' perceptions towards toll roads. Even excluding the influence of infrastructure attributes—such as the quality of the alternative road in each case—or political beliefs, we can observe that users from regions with a higher density of toll roads have a more negative attitude towards road charging. This fact may be explained by the marked asymmetry of toll roads across regions, which is strongly connected to the influence of perceived fairness on pricing acceptability, as pointed out byCools et al. (2011). In this re-spect, it is not strange that users from Catalonia or Valencia, very fre-quently obliged to pay for using high capacity roads, feel unfairly treated when compared to other regions with a more extensive free high-capacity road network.
We alsofind that the inclusion of regional parameters significantly improve thefitting of the model, given the results obtained for the likelihood-ratio test (p-valueb0.05). It is also worth noticing how unob-served effects across regions almost disappear in Model III. As can be seen inTable 4, random coefficients become very close to zero and non-statistically significant after including regional parameters in the model. Then, we may conclude that regional differences initially identi-fied on users' attitudes towards toll roads can be appropriately ex-plained by the variables already included in the model. Finally,Table 5
refines the results by removing overall non-significant explanatory var-iables such as age or income, with no effect on thefitting of the model according to the likelihood-ratio test.
5.4. Discussion of the results
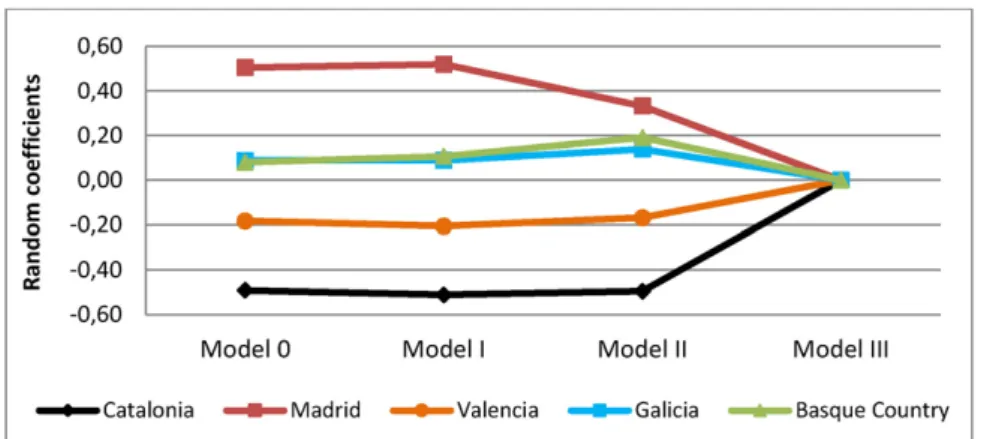
In this subsection, we briefly discuss the results obtained in this re-search work with regard to unobserved differences at the regional level. To that end, we included inFig. 2theevolutionof random inter-cepts for the main models calibrated stepwise in this paper (Models 0 to III). Atfirst glance, some trends can be identified concerning users' differences across regions. Random intercepts in Model 0 evidence that users from Valencia, and especially from Catalonia, show a more negative perception towards toll roads than the average. This contrasts with regions such as Galicia or the Basque Country, in an intermediate position, and especially with the case of Madrid, whose users shows a higher positive attitude towards road charging.
As mentioned above, this view can be explained in the light of the asymmetrical tolling conditions currently applied, resulting from a changing national road transport policy over time. This fact has caused a marked regional heterogeneity that in its turn has provoked a negative perception due to a sentiment of unfairness in the regions more widely affected by tolls. This situation, combined with political beliefs and different tolling infrastructure attributes across regions, has created a significant anti-toll atmosphere in certain parts of the country, although they were initially favored by the early implemen-tation of toll roads.
The lack of change in random intercepts observed between Models 0 and I (seeFig. 1) evidences the limited influence of the characteristics of individuals on regional differences. Additionally, infrastructure attri-butes only seem to be of great importance for the case of Madrid, given that its random coefficient goes down from 0.52 to 0.33. This fact appears to be strongly connected with the fact that toll roads in this region usually have a free high-capacity alternative (seeAppendix 2). Finally, we can see that undoubtedly differences across regions are more affected by regional context-specific parameters included in the model, especially the abundance of toll roads. In this respect, a more Table 5
Users' perceptions towards interurban toll roads: refining results. Level of
data
Explanatory parameters Modeling estimates Coeff. Std.
error
p-Value
Fixed effects
Intercept −4.441 0.863 0.000 Individual Gender (base reference: male)
Female −0.306 0.081 0.000 Type of vehicle (base reference:
car)
Light van −0.276 0.152 0.070 Truck −0.146 0.221 0.510 Moto 1.981 15.692 0.990 Bus −0.714 0.666 0.283 Trip purpose (base reference:
commuting)
Business 0.257 0.135 0.057 Weekend leisure 0.196 0.105 0.062 Holiday leisure 0.144 0.115 0.211 Other 0.044 0.137 0.747 Toll road Type of tolled infrastructure (base
reference: road)
Tunnel 0.437 0.228 0.056 Toll rate −1.486 0.983 0.130 Quality of the alternative route
(base reference: conventional)
Highway 0.299 0.135 0.027 Region Regional GDP per capita 0.048 0.010 0.000 % Left-wing parties −0.082 0.015 0.000 % High capacity roads tolled −0.011 0.004 0.011 Random effects
Region 1.68 e-05 0.039 0.999
coordinated tolling policy would be desirable to eliminate, or at least to reduce, these regional differences and sentiments of unfairness present in certain territories.
6. Conclusions and further research
The multilevel logit model developed in this research enabled us to explore and quantify the explanatory effect of context-specific variables, not only at the regional level but also concerning road-related attri-butes. From the analysis we were able to obtain some interesting conclusions.
Thefirst conclusion is that users' perceptions towards toll roads may experience substantial differences across regions within the same na-tion. This seems to be especially crucial in those cases undergoing a het-erogeneous toll implementation process across territories.
The second conclusion is that regional differences on tolling accept-ability seem to be more affected by context-specific variables, related to either toll road or regional characteristics, than by the attributes of indi-viduals. Particularly, those regions comparatively having a higher share of toll roads or more burdensome tolling infrastructure generally show a more negative perception towards road charging. This idea provides useful insight for future research, given the fact that these types of var-iables have barely been modeled till now.
The third conclusion concerns the consequences of developing an asymmetrical road transport policy across regions. In parallel with the
promotion of regional development and the analysis of territorial equi-ty, a more coordinated implementation of road transport policies across regions seems to be advisable in order to avoid the sentiments of being treated unfairly that some territories perceive. Then, a more balanced national implementation of pricing strategies and road accessibility pro-vision can contribute to better distribute the burden of roadfinancing, as well as to avoid negative perceptions in certain territories.
From the results of this paper, some aspects can be pointed out for further research. First, further efforts are needed to extend the current analysis to regions with a lower presence of toll roads, in order to esti-mate the potential consequences and acceptability of establishing a more homogeneous road transport policy throughout the nation. Addi-tionally, atrans-national research would be highly desirable, especially at the European level, with the aim to evaluate public perceptions to-wards the current EU charging policy. Finally, the influence of further explanatory variables on users' perceptions needs to be explored more deeply, likely by incorporating political beliefs at the individual level or latent variables through a structural equation approach.
Acknowledgement
The authors wish to thank the Spanish Ministry of Economy and
Competitiveness (MINECO), which has funded the project“EU Support
Mechanisms to promote Public Private Partnerships forfinancing
TransEuropean Transport Infrastructure”[TRA 2012-36590].
Appendix 1. Variables measured and questions addressed in the survey
Variable Question addressed Options provided Socioeconomic characteristics
Gender Male; female
Age Where do you place your age in the following intervals? Under 25; from 25 to 34; from 35 to 49; from 50 to 64; above 64 Income Where do you put your personal income in the following
intervals?
Under 20,000; From 20,000 to 30,000; From 30,000 to 50,000; Above 50,000 Type of vehicle Car; light van; truck; moto; bus
Region Catalonia; Madrid; Valencia; Basque Country; Galicia Frequency/type of user How often do you use toll roads, considering the following
intervals?
N8 trips per month (frequent user);b8 trips per month (occasional user); Never used it before (potential user)
Trip purpose (only for frequent and occasional users)
What is the most common trip purpose when you use toll roads?
Commuting; business/work related activities; weekend leisure; holiday leisure; other
Characteristic of the toll road
Quality of the free alternative Conventional road; Highway
Toll rate Expressed in Euro/km
Tunnel Tunnel; interurban road
Attitudes towards tolls
Perception towards toll roads Do you think that tolls are an appropriate mechanism to
finance the provision of roads?
Yes; no
Appendix 2. Main characteristics of the toll roads included in the sample
Region Toll road Year of start Length (km) Toll rate, light vehicle (Euro/km) High capacity alternative road People surveyed By toll road By region Catalonia Montmeló–La Jonquera 1972 135.6 0.089 Partly (3.0%) 58 558
Montmeló–Papiol 1978 26.6 0.092 No 135 Barcelona–Tarragona 1975 96.6 0.089 Partly (9.7%) 78 Zaragoza–Mediterráneo 1976 215.5 0.095 Partly (6.6%) 18 Barcelona–Montmeló 1972 14.2 0.100 Yes 89 Montgat–Palafolls 1969 43.1 0.087 No 67 Castelldefels–El Vendrell 1992 56.3 0.163 No 39 San Cugat–Manresa 1990 43.1 0.147 No 26 Vallvidriera Tunnels 1992 16.7 0.206 No 40
Cadí Tunnel 1986 29.7 0.392 No 8
Madrid Madrid–Guadalajara 2003 64.1 0.099 Yes 59 548
Madrid–Arganda 2003 33.1 0.096 Yes 91
Madrid–Ocaña 2003 53 0.104 Yes 59
Madrid–Navalcarnero 2003 29 0.109 Yes 61
Eje Aeropuerto 2005 8.8 0.143 Yes 103
Villalba–Adanero 1977 69.6 0.144 No 162
Madrid–Toledo 2006 60 0.092 Yes 13
Valencia Tarragona–Valencia 1978 225.3 0.096 Partly (19.8%) 177 562 Valencia–Alicante 1976 148.5 0.097 Partly (9.2%) 198
Circunvalación Alicante 2007 28.5 0.101 Yes 49 Alicante–Cartagena 2001 76.6 0.061 No 138
Basque Country Artxanda Tunnels 2003 3 0.492 No 62 558 Bilbao–Ermua 1976 36.2 0.087 Partly (5.3%) 162
Ermua–Behobia 1976 87.6 0.107 No 181
Maltzaga–Arrasate 2003 35.6 0.107 No 59 Bilbao–Zaragoza 1978 294.4 0.092 Partly (18.0%) 94
Galicia Ferrol–Front. Portuguesa 1979 218.9 0.089 Partly (14.4%) 264 543 Santiago–Alto Sto. Domingo 2003 56.6 0.094 No 53
La Coruña–Carballo 1998 32.6 0.068 No 145 Puxeiros–Val Miñor 1999 25.2 0.060 No 81
Appendix 4. Users' perceptions towards interurban toll roads: estimation results. Models 0 (lack of explanatory variables), Model I (including individual characteristics) and Model II (including infrastructure attributes)
Level of data
Model Model 0 Model I: Model 0 + individual characteristics
Model II: Model I + infrastructure characteristics Variables Coeff. p-Value Coeff. p-Value Coeff. p-Value Fixed effects
Intercept 0.102 0.519 0.293 0.266 0.332 0.224
Individual
Gender (base reference: male)
Female −0.271 0.001 −0.268 0.002
Age (base eference: under 24)
From 24 to 34 −0.248 0.256 −0.244 0.265
From 35 to 49 −0.182 0.379 −0.173 0.404
From 50 to 64 −0.020 0.926 −0.104 0.961
Above 64 0.185 0.504 0.181 0.513
Type of vehicle (base reference: car)
Light van −0.251 0.100 −0.256 0.094
Truck −0.165 0.457 −0.141 0.525
Moto 1.623 0.988 1.504 0.982
Bus −0.753 0.253 −0.763 0.250
Income (base reference: under 20,000€)
From 20,000 to 30,000€ 0.070 0.589 0.079 0.546 From 30,000 to 50,000€ 0.123 0.466 0.147 0.384
Above 50,000€ 0.180 0.544 0.242 0.415
Frequency (base reference: frequent user)
Occasional user −0.070 0.449 −0.064 0.491 Trip purpose (base reference: commuting)
Business 0.231 0.089 0.263 0.053
Weekend leisure 0.146 0.182 0.164 0.136
Holiday leisure 0.060 0.619 0.086 0.480
Other −0.053 0.717 −0.048 0.744
Type of tolled infrastructure (bc: road) Toll Road
Tunnel 0.431 0.059
Toll rate −1.459 0.138
Quality of the alternative route (bc: conventional)
Highway 0.335 0.014
Random effects
Region 0.341 0.003 0.355 0.003 0.309 0.004
−2 log likelihood −1884.28 −1862.280 −1855.98
Likelihood-ratio test Mod. 0 nested in Mod. I Mod. I nested in Mod. II ProbNchi2= 0.001 ProbNchi2= 0.006
Appendix 5. Users' perceptions towards interurban toll roads: testing regional differences for slope coefficients
Model Assumption Random coefficient p-value Random region coefficient
Log-likelihood Prob. nesting model IN
chi2 Model I. Gender Regional differences on gender coefficients 0.147 0.405 0.355 −1862.16 0.176 Model I. Age Regional differences on age coefficients 0.000 0.999 0.355 −1862.28 1.000 Model I.·Income Regional differences on income coefficients 0.158 0.116 0.198 −1861.49 0.132
Model Assumption Random coefficient p-value Random region coefficient
Log-likelihood Prob. nesting model IIN
chi2 Model II. Alternative Regional differences on quality of the alternative coefficient 0.000 0.999 0.309 −1855.98 0.999 Model II. Toll rate Regional differences on toll rate coefficient 0.000 0.999 0.309 −1855.98 0.999
References
Abane, A.M., 2011.Travel behavior in Ghana: empirical observations from four metropol-itan areas. J. Transp. Geogr. 19, 313–322.
Aitken, V., Bell, S., Hills, S., Rees, L., 2014.Public acceptability of indirect potable water reuse in the south-east of England. Water Sci. Technol. Water Supply 14, 875–885.
Alberts, H., Bowen, J.T., Cidell, J.L., 2009.Missed opportunities: the restructuring of Berlin's Airport System and the city's position in International Airline Networks. Reg. Stud. 43, 739–758.
Ben-Akiva, M.E., Lerman, S.R., 1995.Discrete Choice Analysis: Theory and Application to Travel Demand. MIT Press, Cambridge, MA.
Bhatt, K., Higgins, T., Berg, J.T., 2008.Lessons learned from international experience in con-gestion pricing. US Department of Transportation & Federal Highway Administration.
Castillo-Manzano, J., Fageda, X., 2014.How are investments allocated in a publicly owned port system? Political Factors versus economic criteria. Reg. Stud. 48, 1279–1294.
Condeço-Melhorado, A., Gutiérrez, J., García-Palomares, J.C., 2011.Spatial impacts of road pricing: accessibility, regional spillovers and territorial cohesion. Transp. Res. A 45, 185–203.
Cools, M., Brijs, K., Tormans, H., Moons, E., Janssens, D., Wets, G., 2011.The socio-cognitive links between road pricing acceptability and changes in travel-behavior. Transp. Res. A Policy Pract. 45, 779–788.
de Leeuw, J., Meijer, E., 2007.Introduction to multilevel models. In Handbook of Multilevel Analysis. Springer.
Dill, J., Weinstein, A., 2007.How to pay for transportation? A survey of public preferences in California. Transp. Policy 14, 346–356.
Eksler, V., Lassarre, S., Thomas, I., 2008.Regional analysis of road mortality in Europe. Pub-lic Health 122 (9), 826–837.
Furst, E.W.M., Dieplinger, M., 2014.The acceptability of road pricing in Vienna: the pref-erence patterns of car drivers. Transportation 41 (4), 765–784.
Gaunt, M., Rye, T., Allen, S., 2007.Public acceptability of road user charging: The case of Edinburgh and the 2005 Referendum. Transp. Rev. 27, 85–102.
Gehlert, T., Kramer, C., Nielsen, O.A., Schlag, B., 2011.Socioeconomic differences in public acceptability and car use adaptation towards urban road pricing. Transp. Policy 18, 685–694.
Goldstein, H., 2003.Multilevel Statistical Models. Institute of Education, Arnold, London.
Gomez, J., Papanikolaou, A., Vassallo, J.M., 2015. Users’perceptions and willingness to pay in interurban toll roads: identifying differences across regions from a nationwide sur-vey in Spain. Transportation.http://dx.doi.org/10.1007/s11116-015-9662-6. Gujarati, D., Porter, D.C., 2004.Basic Econometrics. fourth ed. The Mc Graw-Hill
Companies.
Hårsman, B., Quigley, J.M., 2010.Political and public acceptability of congestion pricing: ideology and self-interest. J. Policy Anal. Manage. 29 (854-U221).
Hox, J., 2002.Multilevel Analysis: Techniques and Applications. Lawrence Erlbaum Asso-ciates, Hillsdale, NJ.
Kallbekken, S., Garcia, J.H., Korneliussen, K., 2013.Determinants of public support for transport taxes. Transp. Res. A Policy Pract. 58, 67–78.
Karlsdotter, K., Martín, J.J., López, M.P., Jódar, F., García, L., 2009.Análisis multinivel de la influencia de la renta individual y regional en la salud de los españoles en 2007. Congreso de la Asociación Española de Ciencia Regional. XXXV Reunión de estudios regionales. IV Jornades valencianes d'estudis regionals.
Kockelman, K.M., Podgorski, K.V., Bina, M., Gadda, S., 2009.Public perceptions of pricing existing roads and other transportation policies: the Texas perspective. J. Transp. Res. Forum 48, 19–38.
Koppelman, F.S., Bhat, C., 2006.A self instructing course in mode choice modeling: multi-nomial and nested logit models. Prepared for the US Department of Transportation, Federal Transit Administration.
Lassarre, S., Thomas, I., 2005.Exploring road mortality in Europe: national versus regional realities. J. R. Stat. Soc. A. Stat. Soc. 168, 127–144.
Marciano, J.A., Lilieholm, R.J., Teisl, M.F., Leahy, J.E., Neupane, B., 2014.Factors affecting public support for forest-based biorefineries: a comparison of mill towns and the general public in Maine, USA. Energ Policy 75, 301–311.
Ministerio de Fomento, 2011a.Informe 2010 sobre el sector de autopistas de peaje en España. Delegación del Gobierno en las Sociedades Concesionarias de Autopistas Nacionales de peaje.
Ministerio de Fomento, 2011b.Anuario Estadístico 2010. Centro de Publicaciones. Secretaría General Técnica.
Murillo, F.J., 2008.Los Modelos Multinivel como herramienta para la investigación educativa. Magis. Revista Internacional de Investigación Educativa Vol. 1, pp. 17–34.
Odeck, J., Brathen, S., 2008.Travel demand elasticities and users attitudes: a case study of Norwegian toll projects. Transp. Res. A 42, 77–94.
Odeck, J., Kjerkreit, A., 2010.Evidence on users' attitudes towards road user charges—a cross sectional survey of six Norwegian toll schemes. Transp. Policy 17, 349–358.
Oosterhaven, J., Eding, G.G., Stelder, D., 2001.Clusters, linkages and interregional spill-overs: methodology and policy implications for the two Dutch mainports and the rural North. Reg. Stud. 35, 809–822.
Papadimitriou, E., Theofilatos, A., Yannis, G., Cestac, J., Kraiem, S., 2014.Motorcycle riding under the influence of alcohol: results from the SARTRE-4 survey. Accid. Anal. Prev. 70, 121–130.
Podgorski, K.V., Kockelman, K.M., 2006.Public perceptions of toll roads: a survey of the Texas perspective. Transp. Res. A 40, 888–902.
Rienstra, S.A., Rietveld, P., Verhoef, E.T., 1999.The social support for policy measures in passenger transport. A statistical analysis for The Netherlands. Transp. Res. D 4, 181–200.
Sandow, E., 2008.Commuting behavior in sparsely populated areas: evidence from north-ern Sweden. J. Transp. Geogr. 16, 14–27.
Schade, J., Schlag, B., 2000.Acceptability of urban transport pricing. Research Report 72. Government Institute for Economic Research, Helsinki.
Schuitema, G., Steg, L., Forward, S., 2010.Explaining differences in acceptability before and acceptance after the implementation of a congestion charge in Stockholm. Transp. Res. A Policy Pract. 44, 99–109.
Smirti, M., Evans, A., Gougherty, M., Morris, E., 2007.Politics, public opinion and project design in California road pricing. Transp. Res. Rec. 1996, 41–48.
Tolon-Becerra, A., Lastra-Bravo, X., Flores-Parra, I., 2013.National and regional analysis of road accidents in Spain. Traffic Inj. Prev. 14 (5), 486–495.
Train, K., 2003.Discrete Choice Methods With Simulation. Cambridge University Press.
Vassallo, J.M., Ortega, A., Baeza, M.Á., 2012.Impact of the economic recession on toll high-way concessions in Spain. J. Manag. Eng. 28, 398–406.
Yusuf, J.E., O'Connell, L., Anuar, K.A., 2014.For whom the tunnel be tolled: a four-factor model for explaining willingness-to-pay tolls. Transp. Res. A 59, 13–21.