The opinions expressed in the articles are those of the authors and do not necessarily reflect the views of ECLAC. During his tenure as editor, the Journal achieved major milestones that led it to its current position as one of the most important academic publications specializing in development issues in the region and beyond.
Introduction
Theoretical and empirical considerations
The Chinese pursuit of natural resources and the centre-periphery approach
As is well known, the center-periphery model dates back to the origin of ECLAC,3 from the early years of the organization under Raúl Prebisch (Prebisch, 1950; ECLAC, 1951). Third, and even more relevant, the behavior of Chinese multinationals, especially in the natural resource sector, is essentially determined by the planning interests of the government of China.
The importance of Latin American natural resources for China
Although this study does not evaluate the development effects of investments in natural resources, arguments of this type are considered in the final section of the article. In the case of soybeans, the country's food security policy has made grain cultivation more attractive than oilseed production (Gale, Hansen and Jewison, 2015; Wong and Huang, 2012; Sharma, 2014).
Chinese access to Latin American oil
These firms' reserves in the region include 750 million barrels in the Bolivarian Republic of Venezuela, 700 million barrels in Brazil, 284 million barrels in Argentina and 140 million barrels in Ecuador. Surprisingly, Table 1 shows that China has very few claims on Colombia's oil and no oil business in Mexico, which are two of the four largest producing countries in the region, along with the Bolivarian Republic of Venezuela and Brazil.
Chinese access to Latin American iron ore and copper
As for copper, China owns 20.7 million fine tons of Latin American reserves, equivalent to 70% of reserves in Chinese territory. While China's production of copper ore in the region had only secured the equivalent of 5.3%.
Chinese access to Latin American soya
According to Wesz Junior (2011 and 2014), following processes of production chain verticalization and horizontalization in the last two decades, the soybean market in Latin America is mainly controlled by the ABCD companies. The other firm acquired by COFCO, Nidera, also has a well-developed logistics infrastructure in the Latin American soy complex.
Conclusion
Latin America lacks a long-term development strategy to align Chinese interests with more ambitious goals for economic and social progress than governments in the region currently have. The unprecedented speed of Chinese growth in the region may be questioned by Westerners and, in particular, by Americans; and there are signs of this happening, as mentioned above.
Bibliography
Wang (2012), “Modeling future vehicle sales and inventories in China”, Energy Policy, vol. 2011), China's Energy Security: Prospects, Challenges, and Opportunities, Washington, D.C., The Brookings Institution. Jie (2015), China's Agricultural Investment in Latin America: A Critical Appraisal, Dialogue [online] http://www.thedialogue.org/wp-content/uploads/2015/06/Chinas-Agricultural-Investment- in-Latin - America.pdf. 2013), “The Dragon in the Backyard: US Visions of China's Relations with Latin America”, Papel Politico, vol.
- The Latin American securities market
- Corporate governance, regulatory frameworks and best practice codes
- Econometric analysis
- Conclusions
Latin America and the Caribbean (22 countries): bond issues of the financial and non-financial sectors, 2005–2015. The aggregated measures of the corporate governance standards applicable in the four MILA countries and in Brazil indicate that the performance of these five countries “
South America: an analysis from international trade
- Literature review
- Methodology
- The spillover effect of growth based on international trade
- Data sources
- Results and discussion
- Final considerations
Based on these considerations, this study aims to analyze the spillover effect of China's growth on the growth rate of South American countries during the period 1981–2014. As expected, China's growth was found to have a large positive impact on the growth of South American countries over the period 1981–2014.

Interjurisdictional equity principle
- Which variable to equalize?
- Revenue cyclicality
- Highly skewed distribution deriving from the spatial concentration of the resources
- Efficiency issues
- Approaches to equalization transfers
- Interjurisdictional equity in the practice of decentralized systems
- Equalization of expenditure and revenue
- Revenue equalization only
- Vertical and horizontal equalization
- Territorial inequality and fiscal
Local governments therefore function as factors of production that contribute to the creation of the natural resource interest. In the vertical model, the skewness of the distribution of income to be equalized affects the total amount of the grant.
Equalization transfers: alternatives for Latin America
- Argentina
- Peru
In the first case, the revenues of all provinces are at least fully adjusted to the national average; in the second model, the equalization standard is set at 80% of the national average. This means that a horizontally closed model in Argentina in the year of the example would not be able to equalize, that is, bring all provinces in line with the national average. This option assumes a standard of 80% of the average of the five richest regions, after elimination of outliers.
Final remarks
Without additional funding from the central government, the pool of resources from grants only makes it possible to match the 86% benchmark. Of course, this comes at a cost in terms of a lower level of enforcement of the principle of interjurisdictional equality. The results of the vertical model for both countries, Argentina and Peru, are presented in Table 3.
Annex A1
- Inequality: measurement and description of evolution
- Income inequality in the Latin American countries
- Reconstruction of a database on inequality: first results
- The trend of inequality
- Quantification of the components of inequality in Latin Aamerica
- Determinants of the evolution of income inequality in Latin American countries,
- Panel data model, econometric specification
- Empirical results
- Ranking of Latin American countries by reduction in inequality levels
- Conclusions
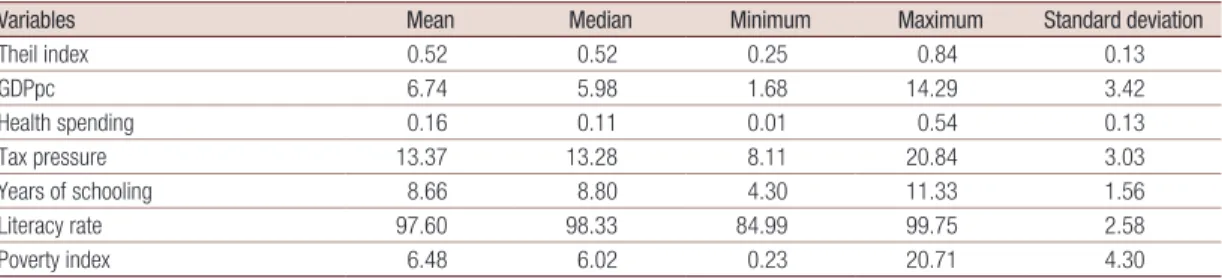
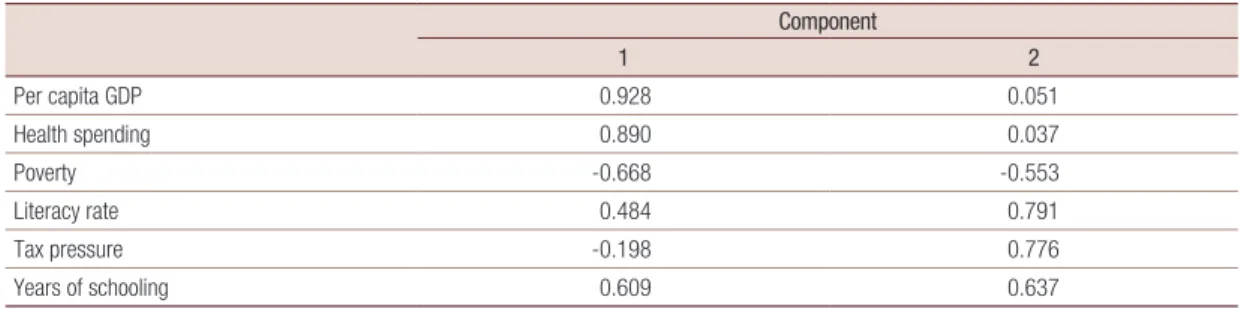
The first step was to collect information on inequality in the countries included for the study period, which was done using Theil index data provided by the World Bank and the Socio-economic Database for Latin America and the Caribbean (SEDLAC). Determinants of the Evolution of Income Inequality in Latin American Countries, Inequality in Latin American Countries, Econometric Panel Data Model. In the remaining countries, inequality varies according to economic and social circumstances (this is the case of Costa Rica, the Dominican Republic, Ecuador, Guatemala, Panama and the Plurinational State of Bolivia).

An opportunity-cost approach to the analysis of Amazonian
Ecosystem services provided by the Amazon forest
In the Amazon basin1, ecosystem services have a special impact due to the interconnections between the Amazon rainforest and the global climate system, due to their function in carbon storage. It spans all the northern Brazilian states (Akker, Amazonas, Amapá, Pará, Rondônia, Roraima and Tocantins) along with Mato Grosso and part of Maranhão (Pereira and others, 2010). The Amazon forest biomass is estimated to contain about 70 PgC (petragram carbon), which corresponds to 10%–15% of the earth's total carbon stock (Keller, Melilloand Zamboni de Mello, 1997; Houghton et al., 2001).
Review of literature on the valuation of
Deforestation in the Amazon region is estimated to have released very large amounts of carbon into the atmosphere. Consequently, the continuation and intensity of deforestation has severe consequences for ecosystem functions in the Amazon basin (Foley et al., 2007), and may even affect rainfall in the region (Salati and Nobre, 1991; Sampaio et al., 2007). ; Nobre and Borma, 2009). Finally, global beneficiaries include those who receive benefits across country borders, deriving from the non-excludable and non-rival characteristics of the "global commons" or "global public goods" of the Amazon ecosystem.
Amazonian environmental goods and services
Market failures and the opportunity cost of Amazon land use
- Market failures
- Opportunity costs
There are several sources of market failure related to land use in the Amazon, leading to deforestation across the region. One source of market failure, which can be considered before the land use decision, stems from incomplete or imperfect information about land conversion opportunities. In protected land areas, the opportunity cost is typically the highest value extractive land use (Naidoo and others, 2006).
Cost-benefit analysis of maintaining environmental goods and services
- Methodological procedures
- Net benefit calculations
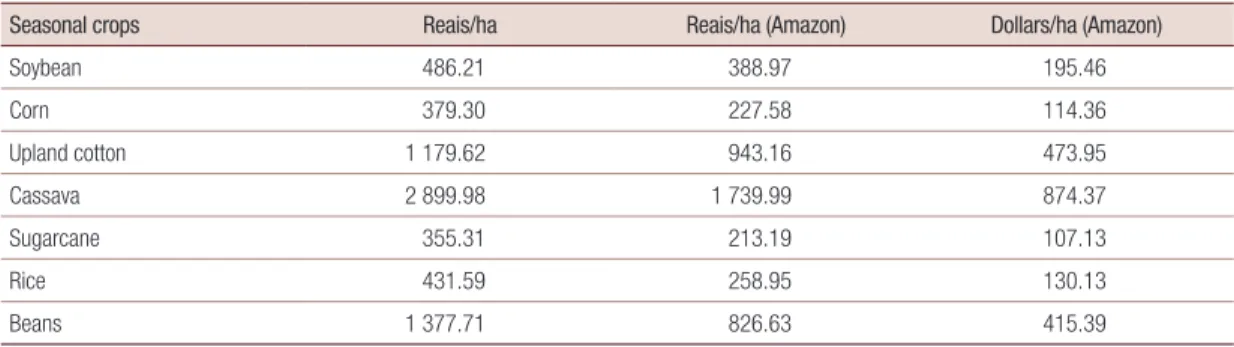
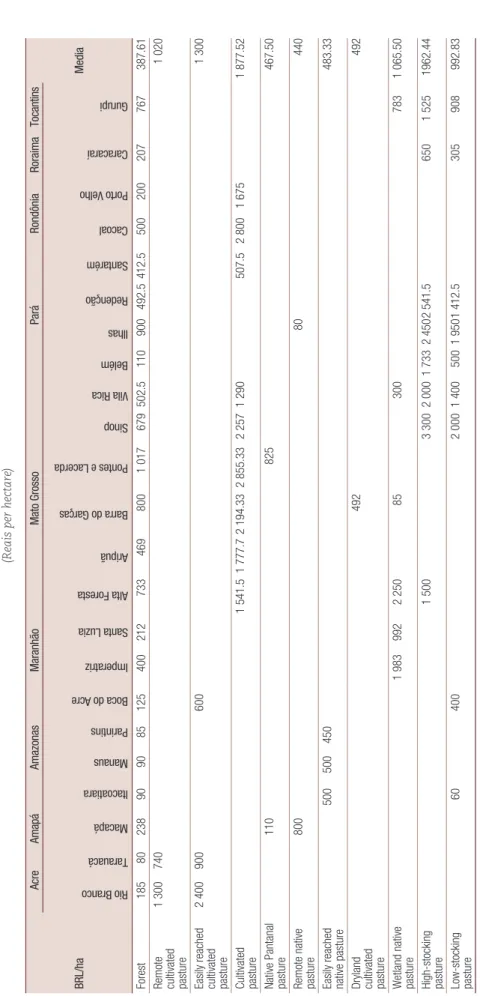
This activity is responsible for the largest change in land use in the Amazon, accounting for over 2/3 of the deforestation that has occurred in recent decades. In the last twenty years, the size of the cattle population has almost tripled (IBGE, 2012), with an expansion driven by factors such as currency devaluation and improved animal production and tracking systems, which led to the extinction of foot-and-mouth disease. disease (Nepstad and Stickler, 2008). 12 The methodology used to estimate this value is described in the literature review on Existence Value related to the conservation of biodiversity of the Amazon region in section IV.
Final thoughts
Foley (2000), "Combined Effects of Deforestation and Doubled Atmospheric CO2 Concentrations on Amazonian Climate", Journal of Climate, Vol. 1990), "The environment as a commodity", Oxford Review of Economic Policy, vol. Shukla (1991), "Amazon deforestation and regional climate change", Journal of Climate, Vol. 1993), "Empirical tests and analysis of environmental degradation policies at different stages of economic development", Punim Pune, No. 8, Banco da Amazônia, January–June. 1987), "Natural Resources and Economic Policy in Developing Countries", The Annals of Regional Science, Vol. 1985), The Economic Institutions of Capitalism, New York, The Free Press.
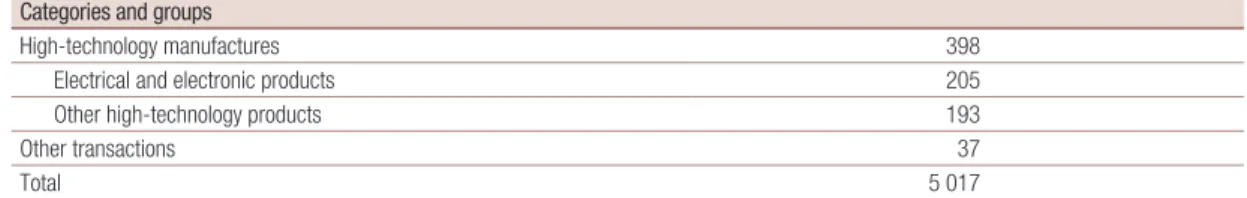
Elements of analysis for trade integration and export diversification
Classification of trade by technology intensity Category Three-digit codes of the Standard International Trade Classification, Revision 2. The range of values of the TI varies depending on the number of products, from 0 to lnnj. Durán Lima and Álvarez (2011) use formula (3) and suggest that, in the case of the five-digit SITC ds.
Results
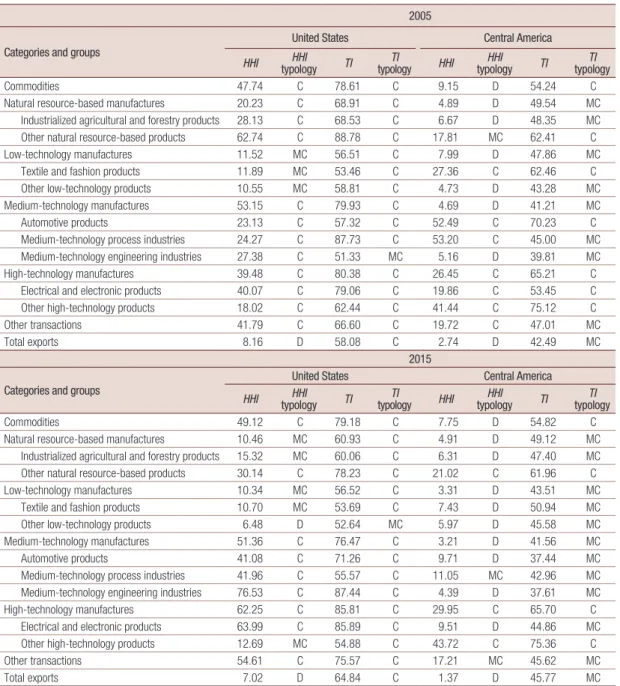
El Salvador: products exported to the United States and Central America, by technology intensity group, 2005–2015. El Salvador: diversification indicators for exports to the United States and Central America, by technology intensity group, 2005 and 2015. El Salvador: decomposition of the Theil index for exports to the United States and Central America, 2005–2015.
An analysis of the Mexican case
The informal sector and labour mobility in Latin America
However, the various forms of informal employment cannot all be expected to react in the same way to business cycles. Of male workers initially in informal employment, 7.3% moved to formal employment, while the transition from formal to informal employment was about 4.7%. He finds that this transition probability is higher for the former than for the transition from formal to informal employment.
A few notes on Okun’s coefficient
One of the first studies of a non-linear relationship between output growth and changes in unemployment was Courtney (1991). The opposing view is that companies are unwilling to lay off employees during recessions because of the high costs involved (due to labor laws) and because their investment in employee training would be lost. In the short term, they found evidence that unemployment adjusted asymmetrically to output growth; in particular, that it adjusted in the expected way during the downturn in the business cycle.
Informality and Okun’s coefficient
Furthermore, the size of the output gap required to induce the change in regime is estimated in the model.
Methodology
- Empirical models
- The data
An advantage of this method is that it uses only the first two sample moments of the variables involved. Further details of the methodology are available in a technical appendix available from the authors upon request. This graph shows that the behavior of cyclical components is consistent with the economic theory of Okun's law, implying that cyclical unemployment is negative only if cyclical output is positive and vice versa.

Empirical results
Cyclical unemployment responds better to simultaneous cyclical production when the former is in a recessionary regime. Moreover, the probability p11 of remaining in the expansionary regime at time (t), given that the unemployment rate was in the same regime at time (t-1), is 0.90. This implies that cyclical unemployment is more responsive to changes in cyclical output in a recessionary regime.
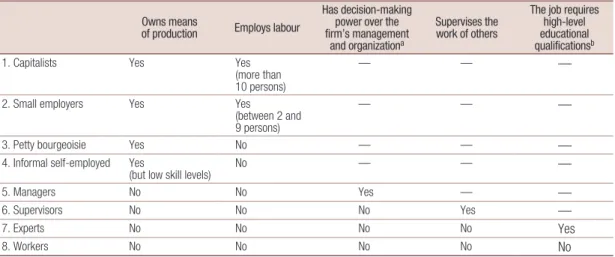
- Transformations of the Chilean class structure
- Critical analyses of mesocratization in Chile
- Research focus, analytical framework and hypothesis
- Variables, data and techniques of analysis
- Variables
- Data
- Estimated wage-earning class locations for 1992, 2003 and 2013
- Technique of analysis
- Results
The mesocratization of the class structure should thus be expressed as an increase in the number of individuals occupying middle-class positions in every economic sector (or in most of them), even if the sectors with the largest number of working-class people (for example, agriculture) grew faster than those with more middle class people (such as financial services). Chile: Breakdown of the effects of changes in economic sectors and in class composition by economic sector and 2003–2013. It is also true that the growth of some activities in the service sector has a positive effect on the growth of the middle class (which is exactly what this study showed when it was found that the net increase in professionals was due to the growth of activities related to public, social, community and personal services) .
Construction of counterfactual data tables
Table of counterfactual data to measure the effects of the transformation of the economic sectors
Chile: impact of the transformation of economic sectors and changes in the structure of classes, 2003-2013. Source: Prepared by the author based on data from the National Socio-Economic Survey (CASEN) (2003 and 2013) and the National Survey on Employment, Work, Health and Quality of Life of Workers in Chile (ENETS.
Table of counterfactual data to measure the effects of the change in the class
Chile: effect of the transformation on class composition and changes in class structure, 2003–2013.
An analysis from the design of a territorial development index
Theoretical framework
- Territorial development and dynamics
- First model adjustment
- Second model adjustment
- Third model adjustment
This is achieved by using a smaller number of factors that summarize a large portion of the information, something seen in the percent variance accumulated by the factors. The analysis performed for each of the dimensions will now be explained in detail. The results of the calculation of the indicator in the named municipalities, i.e. Angol and Carahue, will now be presented (see table 21).
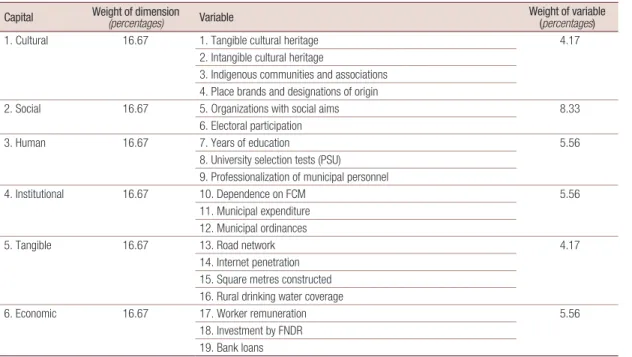
Conclusions
In terms of economic capital, Carahue has better numbers than Angola, with a higher average salary for workers and a greater volume of investments transferred by the National Fund for Regional Development (FNDR) due to large investment projects carried out recently. This model combines elements from various developmental theories that define the dimensions of the index. The next step is a series of multivariate statistical analyses, aimed at making certain adjustments to the model by reducing the dimensionality of the data (and technically validating the proposal) and then achieving a simplified TDI calculation for Angola and Carahue municipalities based on administrative records.