Dag Gillberg
2014-07-04 CERN
Combination of the Higgs boson main property measurements
using the ATLAS detector
Dag Gillberg (CERN)
on behalf of the ATLAS Collaboration
ICHEP, Valencia, Spain, July 4, 2014
Outline
Main Higgs boson properties studied at ATLAS
I. mass - New! June 2014
main talk by Robert Harrington II. production rate & couplings
to other particles
main focus of this presentation
III. spin and parity
main talk by Kirill Prokofiev IV. fiducial/differential cross
sections, kinematic properties;
associated jet activity; BSM …
see talks by S. Laplace, G. Sciolla
2 gg→H VBF VH ≡ WH or ZH ttH
H H
H H
q W,Z
q
g
g
t
q t q
q q
g
g ~87% ~7.2% ~5.0% ~0.6%
coupling and spin results (II and III) not
yet updated with new calibration/mass
July 4, 2012
It’s been two years!
Happy discovery day Happy discovery day
Higgs boson mass
3
Bruno Lenzi (CERN) Higgs properties from boson in bosonic decay channels in ATLAS - LHCP 02/06/2014
Improved calibration of electrons and photons
4
NEW
η|
| 0 0.2 0.4 0.6 0.8 1 1.2 1.4 1.6 1.8 2 2.2 2.4
MC 1/2 / Edata 1/2E
0.9 0.95 1 1.05
1.1 Z→µµ (trunc. mean)
(MPV) µ
µ Z→ Average
= 20.3 fb-1
t d
∫
L=8 TeV, s
ATLAS Preliminary
ID + services Cryostat + Solenoid PS Cables
L1 L2 L3
μ
ID + services
L1 L2 L3
μ
|η|<1.82
|η|>1.82
e e
Unconv γ, E0<500 MeV
Cryostat
ID end
e
1. Calorimeter non-uniformities and layer inter- calibration corrected using e/γ/μ
• Response stable at ~0.05% vs. time and pileup
• 1-2% precision on E1/2, 5% on EPS
• Constrain inactive material (2-5 X0) to ~2-10% X0
NEW
Date (Day/Month) 13/03 23/04 04/06 16/07 27/08 07/10 18/11 30/12
Relative energy scale
0.998 0.9985 0.999 0.9995 1 1.0005
1.001 1.0015
1.002
= 20.3 fb-1
t d
∫
L=8 TeV, ATLAS Preliminary s
mee
E/p
Bruno Lenzi (CERN) Higgs properties from boson in bosonic decay channels in ATLAS - LHCP 02/06/2014
Improved calibration of electrons and photons
4
NEW
η|
| 0 0.2 0.4 0.6 0.8 1 1.2 1.4 1.6 1.8 2 2.2 2.4
MC 1/2 / Edata 1/2E
0.9 0.95 1 1.05
1.1 Z→µµ (trunc. mean) (MPV)
µ µ Z→ Average
= 20.3 fb-1
t d
∫
L=8 TeV, s
ATLAS Preliminary
ID + services Cryostat + Solenoid PS Cables
L1 L2 L3
μ
ID + services
L1 L2 L3
μ
|η|<1.82
|η|>1.82
e e
Unconv γ, E0<500 MeV
Cryostat
ID end
e
1. Calorimeter non-uniformities and layer inter- calibration corrected using e/γ/μ
• Response stable at ~0.05% vs. time and pileup
• 1-2% precision on E1/2, 5% on EPS
• Constrain inactive material (2-5 X0) to ~2-10% X0
NEW
Date (Day/Month) 13/03 23/04 04/06 16/07 27/08 07/10 18/11 30/12
Relative energy scale
0.998 0.9985 0.999 0.9995 1 1.0005
1.001 1.0015 1.002
= 20.3 fb-1
t d
∫
L=8 TeV, ATLAS Preliminary s
mee
E/p
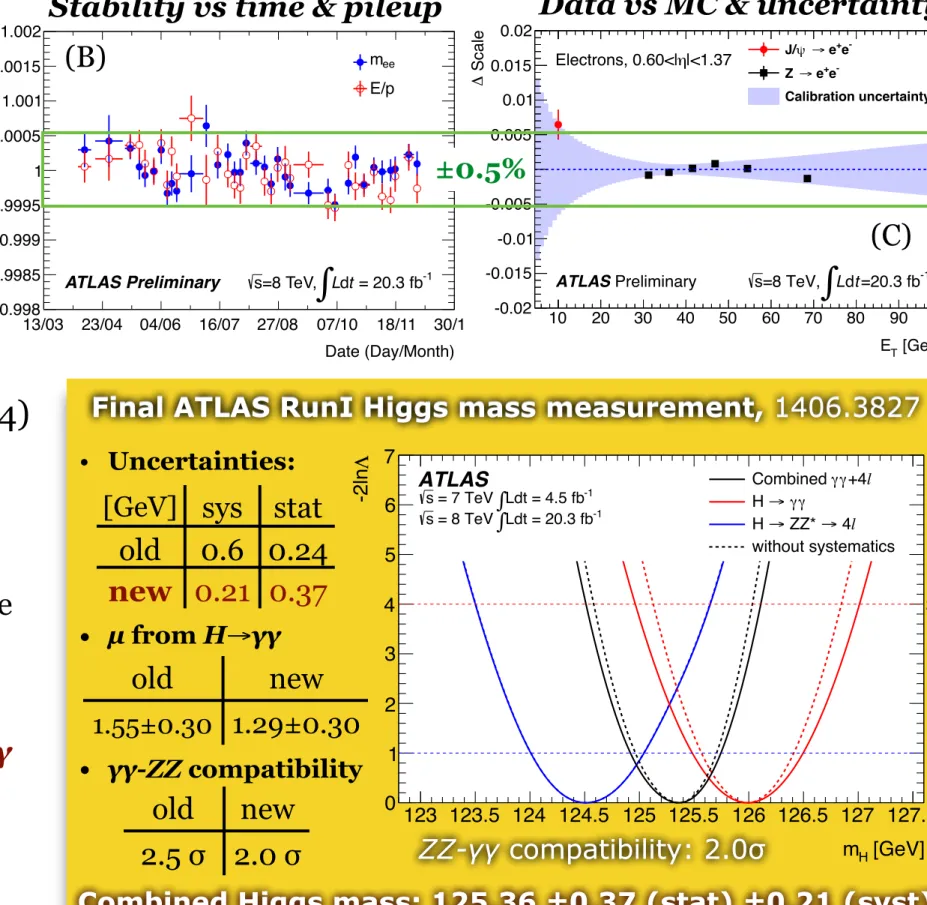
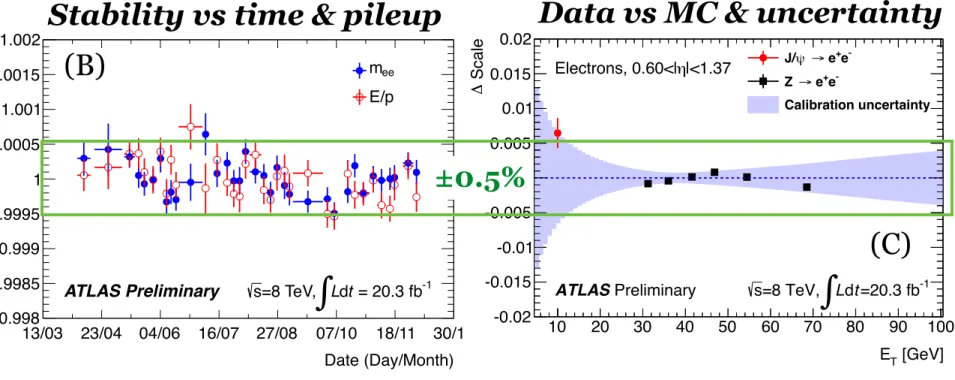
New e/γ calibration (spring 2014)
• Calorimeter layers individually calibrated with µ, e and γ (A)
• Energy response stable within 0.5%
versus time and pileup (B)
• Improved material description of the calorimeters: inactive material
constrained to 2-10%X0
• Precise MVA-based EM cluster
calibration → 10% improved H→γγ mγγ resolution
• Data-MC agreement within (small!) uncertainty after calibration (C)
(A) (B)
(C)
[GeV]
mH
123 123.5 124 124.5 125 125.5 126 126.5 127 127.5
Λ-2ln
0 1 2 3 4 5 6 7
1σ 2σ
ATLAS
Ldt = 4.5 fb-1
= 7 TeV ∫
s
Ldt = 20.3 fb-1
= 8 TeV ∫
s
+4l γ Combined γ
γ γ H →
l
→ 4 ZZ*
H →
without systematics
Figure 8: Value of 2 ln⇤as a function ofmHfor the individualH ! andH!ZZ⇤!4`channels and their combination, where the signal strengthsµ andµ4` are allowed to vary independently. The dashed lines show the statistical component of the mass measurements. For the H!ZZ⇤!4`channel, this is indistinguishable from the solid line that includes the systematic uncertainties.
[GeV]
mH
123 123.5 124 124.5 125 125.5 126 126.5 127 127.5 )=125.36 GeV) H(m SMσ/σSignal yield (
0 0.5 1 1.5
2 2.5 3 3.5
4 ATLAS
Ldt = 4.5 fb-1
= 7 TeV ∫
s
Ldt = 20.3 fb-1
= 8 TeV ∫
s
γ+ZZ*
Combined γ γ γ H →
l
→ 4 ZZ*
H → Best fit 68% CL 95% CL
Figure 9: Likelihood contours 2 ln⇤(S,mH) as a function of the normalized signal yieldS = / SM(mH=125.36 GeV) andmHfor theH! andH!ZZ⇤!4`channels and their combination, including all systematic uncertainties. For the combined contour, a common normalised signal yieldS is used. The markers indicate the maximum likelihood estimates in the corresponding channels.
22
Bruno Lenzi (CERN) Higgs properties from boson in bosonic decay channels in ATLAS - LHCP 02/06/2014
[GeV]
ET
10 20 30 40 50 60 70 80 90 100
Scale∆
-0.02 -0.015 -0.01 -0.005
0 0.005 0.01 0.015
0.02
e-
e+
→ ψ J/
e-
e+
Z →
Calibration uncertainty
|<1.37 Electrons, 0.60<|η
ATLASPreliminary s=8 TeV,
∫
Ldt=20.3 fb-1Improved calibration of electrons and photons
5
NEW
2. EM cluster energy correction via MVA regression
• 10% better resolution for H → γγ
3. E-scale and resolution extracted with Z → ee
• Good data/MC agreement after corrections
• Linearity and extrapolation to photons checked with Z → ee vs. ET(e-), J/ψ and Z → ℓℓγ
• 0.03-0.05% for 40 GeV ET electrons
• ~0.2-0.5% for photons
NEW
[GeV]
ET
10 20 30 40 50 60
Scale∆
-0.02 -0.015 -0.01 -0.005
0 0.005 0.01 0.015
0.02
Unconverted photons Data
Calibration uncertainty
ATLASPreliminary s = 8 TeV, ∫Ldt = 20.3 fb-1
| η
| 0 0.2 0.4 0.6 0.8 1 1.2 1.4 1.6 1.8 2 2.2
Scale∆
-0.02 -0.015 -0.01 -0.005 0 0.005 0.01 0.015 0.02
Converted photons Data
Calibration uncertainty
ATLASPreliminary s=8 TeV, ∫Ldt = 20.3 fb-1
Entries / 500 MeV
0 50 100 150 200 250 300 350 400 450 500
103
×
= 20.3 fb-1
t d
∫L
=8 TeV, s
ATLAS Preliminary
Calibrated data MC, uncorrected MC
[GeV]
mee
80 82 84 86 88 90 92 94 96 98 100
Ratio to MC
0.9 0.95 1 1.05
1.1 Calibration uncertainty
±0.5%
(C)
Combined Higgs mass: 125.36 ±0.37 (stat) ±0.21 (syst) ZZ-γγ compatibility: 2.0σ
Final ATLAS RunI Higgs mass measurement, 1406.3827
Combined Higgs mass: 125.36 ±0.37 (stat) ±0.21 (syst) ZZ-γγ compatibility: 2.0σ
Final ATLAS RunI Higgs mass measurement, 1406.3827
• Uncertainties:
• µ from H→γγ
• γγ-ZZ compatibility
[GeV] sys stat old 0.6 0.24 new 0.21 0.37
old new
2.5 σ 2.0 σ
old new
1.55±0.30 1.29±0.30
Calorimeter layer intercalibration Stability vs time & pileup Data vs MC & uncertainty
New CMS Combined mass: 125.03 ±0.27 (stat) ±0.15 (syst)
Matter particles
Force carriers (gauge bosons)
The Higgs can interact with (couples to) all massive, fundamental particles
Higgs couplings
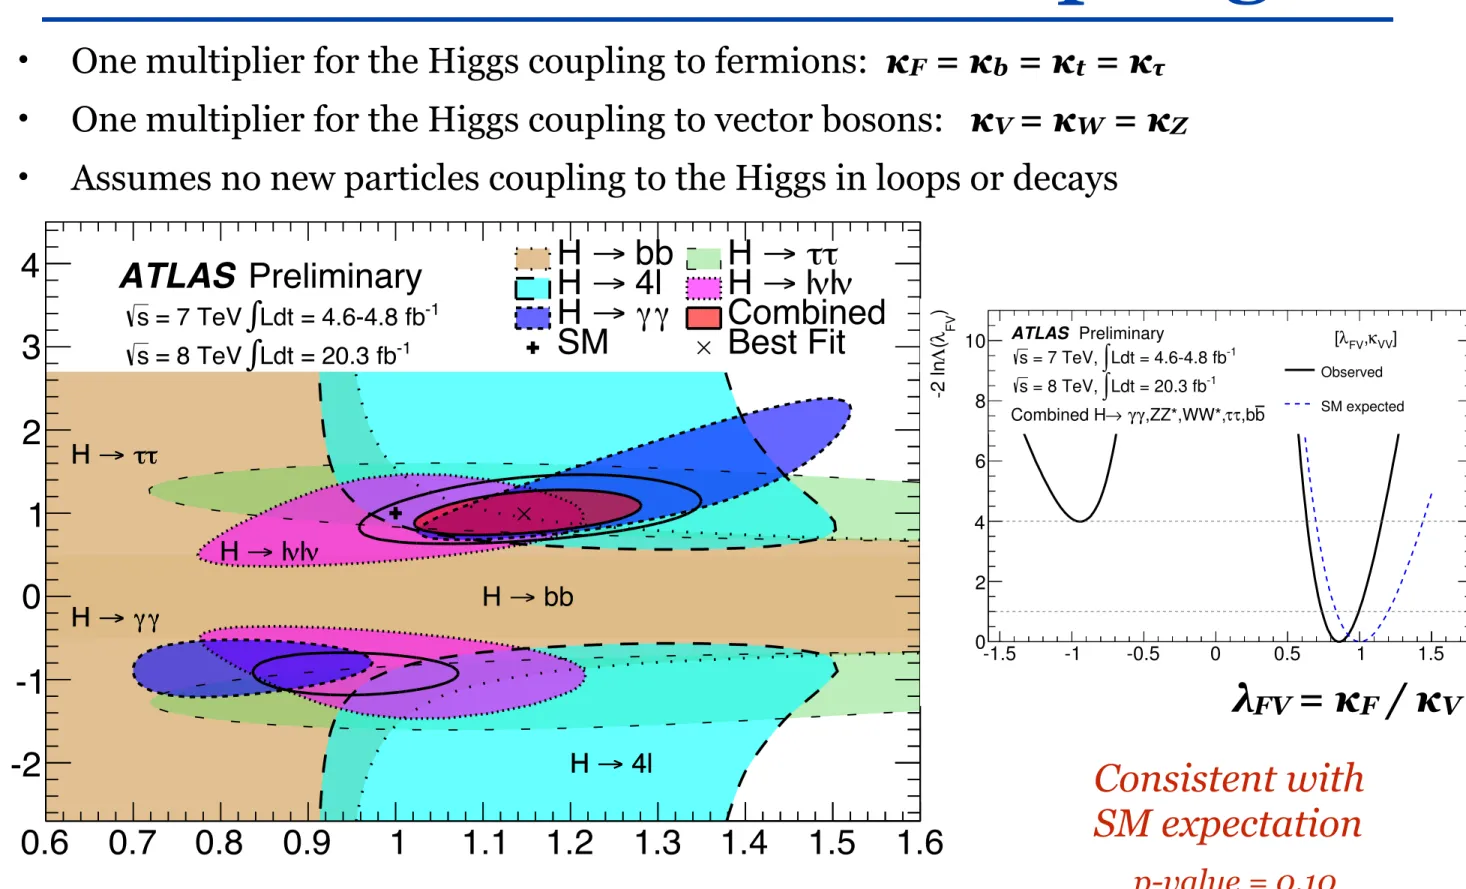
•
Search for deviations from the SM Higgs coupling to other particles by
introducing multipliers using a tree-level motivated benchmark model following the LHC Higgs XS WG recommendations: 1209.0040
4
κZ
κW
– 62–
VBF production. The observations by ATLAS and CMS ex- clude a value of ρV BF+V H,ggH+ttH = 0 at an even greater level of confidence.
IV.2.5. Measurement of the coupling properties of H (i) From effective Lagrangians to Higgs observables
All 8 operators of the effective Lagrangian Eq. (13) that were unconstrained before the Higgs data induce, at tree-level, deviations in the Higgs couplings that respect the Lorentz struc- ture of the SM interactions, or generate simple new interactions of the Higgs boson to the W and Z field strengths, or induce some contact interactions of the Higgs boson to photons (and to a photon and a Z boson) and gluons that take the form of the ones that are generated by integrating out the top quark. In other words, the Higgs couplings are described, in the unitary gauge, by the following effective Lagrangian [180,38]
L = κ3m2H
2v H3 + κZ m2Z
v ZµZµH + κW 2m2W
v Wµ+W−µH + κg αs
12πvGaµνGaµνH + κγ α
2πvAµνAµνH + κZγ α
πvAµνZµνH + κV V α
2πv
!cos2 θWZµνZµν + 2 Wµν+ W−µν"
H
−
⎛
⎝κt %
f=u,c,t
mf
v f f + κb %
f=d,s,b
mf
v f f + κτ %
f=e,µ,τ
mf v f f
⎞
⎠H.
(22) The correspondence between the Wilson coefficients of the dimension-6 operators and the κ’s is given in Table 11. In the SM, the Higgs boson does not couple to massless gauge bosons at tree level, hence κg = κγ = κZγ = 0. Nonetheless, the contact operators are generated radiatively by SM particles loops. In particular, the top quark gives a contribution to the 3 coefficients κg, κγ, κZγ that does not decouple in the infinite top mass limit. For instance, in that limit κγ = κg = 1 [19,20,181]
(the contribution of the top quark to κZγ can be found in Ref. [181]).
January 9, 2014 16:22
Effective Lagrangian describing the Higgs couplings in unitarity gauge
Status of Higgs boson physics (PDG), page 62
!
Notreviewed,forinternalcirculationonly
Coupling to Fermions v. Vector Bosons
V = W = Z
F = t = b = ⌧
I
Normalization profiled in fit.
g g
t,b h
q
q q
q h
q
q W/Z
h W/Z
Production Modes
h
W
h W/Z
W/Z
h b,τ
b,τ h
t,b t,b
Decays
γ γ γ γ
Saxon (UPenn) Combined Higgs Measurements May 5, 2014 8 / 18
Higgs couplings
•
Search for deviations from the SM Higgs coupling to other particles by
introducing multipliers using a tree-level motivated benchmark model following the LHC Higgs XS WG recommendations: 1209.0040
•
Assumptions:
๏
Single, narrow, CP-even scalar resonance
(tensor structure of couplings assumed to be those of the SM)
๏
Narrow width approximation is valid:
!
•
Deviations from SM parametrized using multipliers κ, e.g.
where κ
g and κγare effective multipliers since the Higgs boson does not directly couple to these particles,
but via loops that contains interference:
5
B (i ! H ! f ) =
i fH
B(gg ! H ! ) = ggF H!
H
Example:
B (gg ! H ! ) = (
ggFB )
SM(gg ! H ! ) ⇥
2g
2
2H
2= 1.59
2W0.66
W
t+ 0.07
2tthese relations are modified if non-SM particles enter the loop
Higgs couplings
•
Parameters of interest
• Signal strength µ = σmeasured/σSM
multiplier for total yield.
Can also be defined for each production mode, e.g.:
µ
VBF= σ
VBF,measured/ σ
VBF,SM• Multiplier κ for a given coupling
e.g. κ
tfor the Higgs-top quark coupling, or κ
Ffor general Higgs-fermion coupling
•
Different types of models tested by imposing different relations between kappas
•
In both cases, SM has: µ
≡ 1 and κ ≡ 1Deviations from unity indicate non-SM Higgs couplings
6Notreviewed,forinternalcirculationonly
Factorizing
I
Production Modes
I
Fermions v. Bosons
I
Up v. Down
I
Leptons v. Quarks
I
W v. Z : Custodial Sym.
I
Photon, Gluon Loops
I
Unobs. or Invisible
g g
t,b h
q
q q
q h
q
q W/Z
h W/Z
Production Modes
h
W
h W/Z
W/Z
h b,τ
b,τ h
t,b t,b
Decays
γ γ γ γ
Saxon (UPenn) Combined Higgs Measurements May 5, 2014 6 / 18
gg→H VBF VH ≡ WH or ZH ttH
H H
H H
q W,Z
q
g
g
t
q t q
q q
g g
Note: κ allows for more direct accesses to coupling as µ
contain complex interplay between production and decay
Datasets and analysis strategy
• Combine ATLAS Higgs measurements from 5 different channels
•
Each analysis is further divided into categories that increases sensitivity:
→ different s/b and production mode/decay compositions
→ allows to extract Higgs couplings to different particles
•
Parameter(s) of interest extracted by simultaneous maximal likelihood fit
7
Notreviewed,forinternalcirculationonly
Analysis Categories
Channel Decay Production Tagging
h ! - VBF, `, E/T, 2-jet VH.
h ! ZZ⇤ 4` VBF, `
h ! WW ⇤ `⌫`⌫ 0-jet, 1-jet, 2-jet VBF
V (h ! bb) Z ! ⌫⌫, W ! `⌫, Z ! `` -
h ! ⌧ ⌧ (2012) ⌧lep⌧lep, ⌧lep⌧had, ⌧had⌧had Boosted ggh, VBF
signal composition (%) 0 10 20 30 40 50 60 70 80 90 100
One-lepton significance
miss
ET
Low-mass two-jet Tight high-mass two-jet Loose high-mass two-jet
Conv. transition Conv. rest high pTtTt
Conv. rest low pTt Conv. central high pTt Conv. central low pTt Unconv. rest high pTt Unconv. rest low pTt Unconv. central high pTt
Unconv. central low p Inclusive
ggF VBF WH ZH ttH
ATLAS Preliminary (simulation) H → γ γ
Example: Tagged Categories in h → γγ
Saxon (UPenn) Combined Higgs Measurements May 5, 2014 3 / 18
Example:
H→γγ categories
channel decay categories L [fb 1]
H ! - low/high pTt, VBF, `, ETmiss 4.8+20.3
H ! ZZ⇤ 4` `, VBF 4.6+20.3
H ! W W⇤ `⌫`⌫ 0, 1, 2 jets, VBF 4.6+20.3
V H ! V b¯b Z ! ⌫⌫, W ! `⌫, Z ! `` - 4.6+20.3
H ! ⌧ ⌧ ``, `-had, had-had boosted, VBF 20.3
γγ, ZZ, WW, bb, τ τ
VBF categories:
large fraction of VBF low-mjj, ETmiss and lepton categories:
large fraction of WH
µ) Signal strength (
-0.5 0 0.5 1 1.5 2
ATLAS Prelim.
Ldt = 4.6-4.8 fb-1
∫
= 7 TeV s
Ldt = 20.3 fb-1
∫
= 8 TeV s
= 125.5 GeV mH
0.28 -
0.33
= 1.57+
µ γ γ H →
0.12 - 0.17 +
0.18 -
0.24 +
0.22 -
0.23 +
0.35 -
0.40
= 1.44+
µ
→ 4l ZZ*
H →
0.10 -
0.17 +
0.13 -
0.20 +
0.32 -
0.35 +
-0.29 0.32
= 1.00+
µ lν lν WW* → H →
0.08 -
0.16 +
0.19 -
0.24 +
0.21 - 0.21 +
0.20 - +0.21
= 1.35 µ
, ZZ*, WW*
γ γ H→
Combined
0.11 -
0.13 +
0.14 -
0.16 +
0.14 -
0.14 +
-0.6 0.7
= 0.2+
µ b
→ b W,Z H
<0.1
±0.4
±0.5
0.4 -
0.5
= 1.4+
µ
(8 TeV data only)
τ τ H →
0.1 -
0.2 +
0.3 - + 0.4
0.3 - + 0.3
0.32 -
0.36
= 1.09+
τ µ , τ b
→b H
Combined
0.04 -
0.08 +
0.21 -
0.27 +
0.24 -
0.24 +
-0.17 0.18
= 1.30+
µ
Combined
0.08 -
0.10 +
0.11 -
0.14 +
0.12 -
0.12 +
Total uncertainty on µ
1σ
±
(stat.) σ
theory )
sys inc.
(
σ
(theory) σ
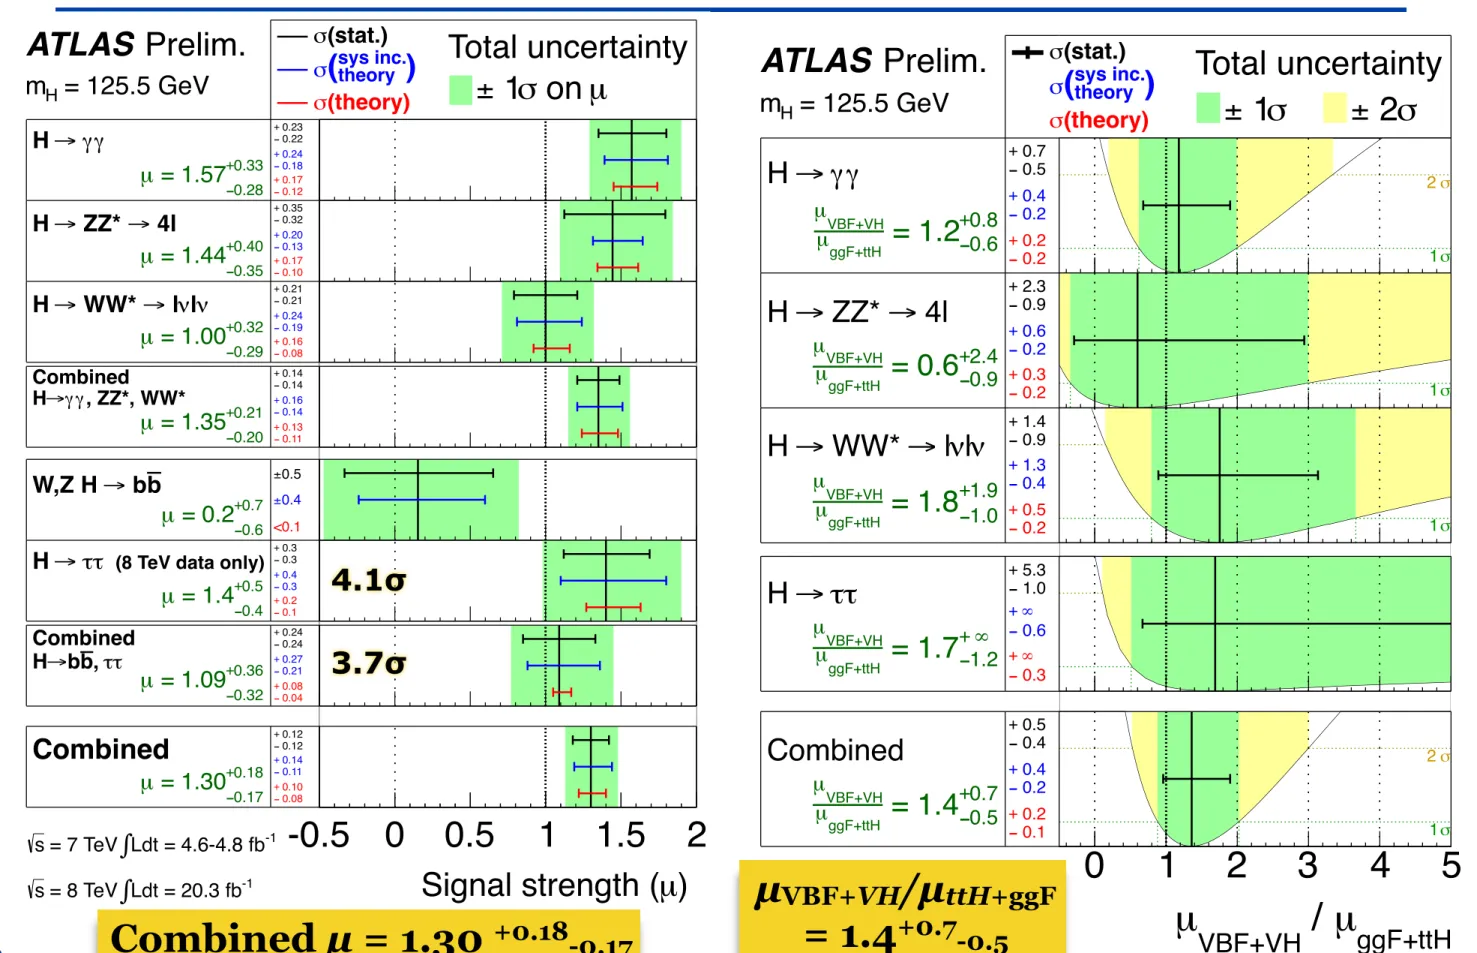
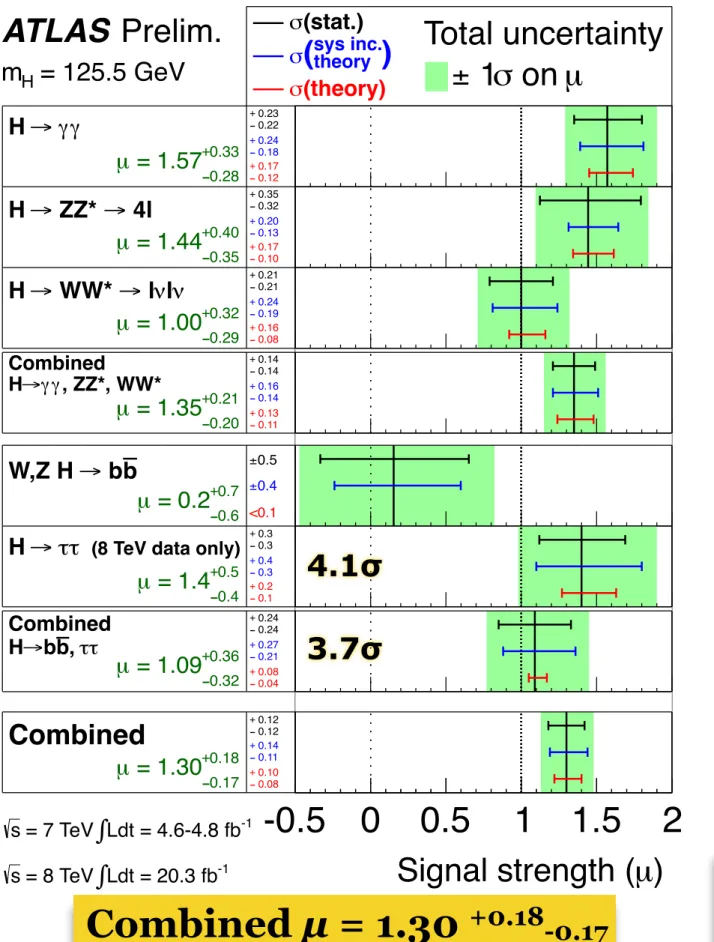
Figure 1: The measured signal strengths for a Higgs boson of mass mH =125.5 GeV, normalised to the SM expectations, for the individual final states and various combinations. The best-fit values are shown by the solid vertical lines. The total ±1 uncertainties are indicated by green shaded bands, with the individual contributions from the statistical uncertainty (top), the total (experimental and theoretical) systematic uncertainty (middle), and the theory uncertainty (bottom) on the signal strength (from QCD scale, PDF, and branching ratios) shown as superimposed error bars. The measurements are based on Refs. [3, 5, 6], with the changes mentioned in the text.
Section 2. In the H ! ⌧⌧ channel, the ratio µVBF+VH/µggF+ttH has an infinite 1 upper bound, because the signal is almost only observed in the VBF mode, hence the ggF denominator can be arbitrarily small.
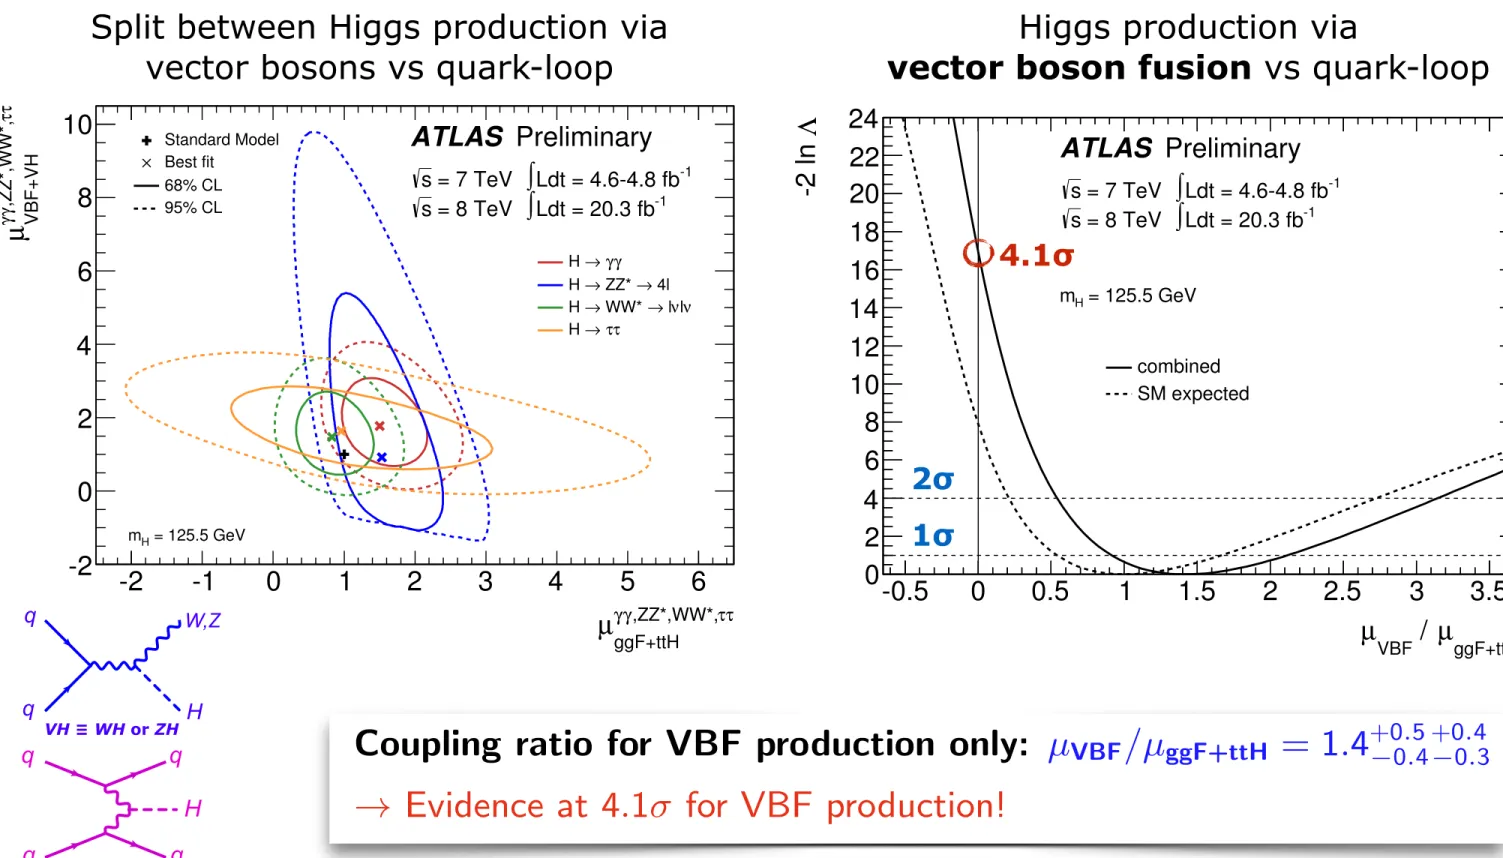
To test the sensitivity to VBF production alone, the data are also fitted with the ratio µVBF/µggF+ttH. In order not to influence the VBF measurement through the VH categories, the parameter µVH/µggF+ttH is treated independently and profiled. A value of
µVBF/µggF+ttH = 1.4+00.4.5 (stat)+00.3.4 (sys)
is obtained from the combination of the four channels (Fig. 4). This result provides evidence at the 4.1 level that a fraction of Higgs boson production occurs through VBF.
6
Combined signal strength
8
iv.b Combining Coupling measurements Combined signal strength results for µ and µ
VBF+VH/µ
ggF+ttH:
µ) Signal strength (
-0.5 0 0.5 1 1.5 2
ATLAS Prelim.
Ldt = 4.6-4.8 fb-1
∫
= 7 TeV s
Ldt = 20.3 fb-1
∫
= 8 TeV s
= 125.5 GeV mH
0.28 - +0.33
= 1.57 µ
γ γ H →
0.12 -
0.17 +
0.18 -
0.24 +
0.22 -
0.23 +
0.35 -
0.40
= 1.44+
µ
→ 4l ZZ*
H →
0.10 -
0.17 +
0.13 -
0.20 +
0.32 -
0.35 +
0.29 -
0.32
= 1.00+
µ lν lν WW* → H →
0.08 -
0.16 +
0.19 -
0.24 +
0.21 -
0.21 +
0.20 -
0.21
= 1.35+
µ
, ZZ*, WW*
γ γ H→
Combined
0.11 -
0.13 +
0.14 -
0.16 +
0.14 -
0.14 +
-0.6 +0.7
= 0.2 µ
b
→ b W,Z H
<0.1
±0.4
±0.5
0.4 - +0.5
= 1.4 µ
(8 TeV data only)
τ τ H →
0.1 -
0.2 +
0.3 -
0.4 + - 0.3
0.3 +
0.32 -
0.36
= 1.09+
τ µ , τ b
→b H
Combined
0.04 -
0.08 +
0.21 -
0.27 +
0.24 -
0.24 +
0.17 -
0.18
= 1.30+
µ
Combined
0.08 -
0.10 +
0.11 -
0.14 +
0.12 -
0.12 +
Total uncertainty on µ
1σ
±
(stat.) σ
theory )
sys inc.
(
σ
(theory) σ
Figure 1: The measured signal strengths for a Higgs boson of mass mH =125.5 GeV, normalised to the SM expectations, for the individual final states and various combinations. The best-fit values are shown by the solid vertical lines. The total ±1 uncertainties are indicated by green shaded bands, with the individual contributions from the statistical uncertainty (top), the total (experimental and theoretical) systematic uncertainty (middle), and the theory uncertainty (bottom) on the signal strength (from QCD scale, PDF, and branching ratios) shown as superimposed error bars. The measurements are based on Refs. [3, 5, 6], with the changes mentioned in the text.
Section 2. In the H channel, the ratio µVBF+VH/µggF+ttH has an infinite 1 upper bound, because the signal is almost only observed in the VBF mode, hence the ggF denominator can be arbitrarily small.
To test the sensitivity to VBF production alone, the data are also fitted with the ratio µVBF/µggF+ttH. In order not to influence the VBF measurement through the VH categories, the parameter µVH/µggF+ttH is treated independently and profiled. A value of
µVBF/µggF+ttH = 1.4+0.50.4 (stat)+0.40.3 (sys)
is obtained from the combination of the four channels (Fig. 4). This result provides evidence at the 4.1 level that a fraction of Higgs boson production occurs through VBF.
6
ggF+ttH
/ µ
VBF+VH
µ
0 1 2 3 4 5
ATLAS Prelim.
Ldt = 4.6-4.8 fb-1
∫
= 7 TeV s
Ldt = 20.3 fb-1
∫
= 8 TeV s
= 125.5 GeV mH
-0.6 +0.8
= 1.2
ggF+ttH
µVBF+VH µ
γ γ H →
1 σ 2 σ
- 0.2 + 0.2 0.2 -
0.4 +
0.5 -
0.7 +
-0.9 2.4
= 0.6+
ggF+ttH
µVBF+VH µ
→ 4l ZZ*
H →
1 σ - 0.2
+ 0.3 0.2 -
0.6 + - 0.9
2.3 +
1.0 -
1.9
= 1.8+
ggF+ttH
µVBF+VH µ
lν lν WW* → H →
1 σ 0.2
- + 0.5
0.4 -
1.3 + - 0.9 + 1.4
-1.2 +∞
= 1.7
ggF+ttH
µVBF+VH µ
τ τ H →
0.3 - +∞
0.6 - +∞
1.0 -
5.3 +
0.5 - +0.7
= 1.4
ggF+ttH
µVBF+VH µ
Combined
1 σ 2 σ
0.1 -
0.2 +
0.2 -
0.4 + - 0.4
0.5 +
Total uncertainty 1σ
± ± 2σ
(stat.) σ
theory )
sys inc.
(
σ
(theory) σ
Figure 3: Measurements of the µVBF+VH/µggF+ttH ratios for the individual final states and their combi- nation, for a Higgs boson mass mH =125.5 GeV. The best-fit values are represented by the solid vertical lines, with the total ±1 and ±2 uncertainties indicated by the green and yellow shaded bands, re- spectively, and the statistical uncertainties by the superimposed horizontal error bars. The numbers in the second column specify the contributions of the statistical uncertainty (top), the total (experimental and theoretical) systematic uncertainty (middle), and the theoretical uncertainty (bottom) on the signal cross section (from QCD scale, PDF, and branching ratios) alone. For a more complete illustration, the likelihood curves from which the total uncertainties are extracted are overlaid. The measurements are based on Refs. [3, 6], with the changes mentioned in the text.
means in particular that the observed state is assumed to be a CP-even scalar as in the SM (this assumption was tested by both the ATLAS [15] and CMS [16] Collaborations).
The LO-motivated coupling scale factors j are defined in such a way that the cross section j and the partial decay width j associated with the SM particle j scale with the factor 2j when compared to the corresponding SM prediction. Details can be found in Refs. [14, 17].
In some of the fits the effective scale factors and g for the processes H and gg H, which are loop-induced in the SM, are treated as a function of the more fundamental coupling scale factors t,
b, W, and similarly for all other particles that contribute to these SM loop processes. In these cases the scaled fundamental couplings are propagated through the loop calculations, including all interference effects, using the functional form derived from the SM. Similarly the scaling of the VBF cross section
8
Overall signal production strength: µ = 1.30
+0.180.17Evidence for VBF+VH: µ
VBF+VH/µ
ggF+ttH= 1.4
+0.70.510 / 21
µ
VBF+VH/µ
ttH+ggF= 1.4
+0.7-0.5Combined µ = 1.30
+0.18-0.173.7σ 4.1σ
ATLAS-CONF-2014-009
Evidence for VBF Higgs production
9
iv.c Combining Coupling measurements
Projection in µ
VBF+VH-µ
ggF+ttHplane:
τ τ ,ZZ*,WW*, γ
γ
ggF+ttH
µ
-2 -1 0 1 2 3 4 5 6
ττ,ZZ*,WW*,γγ VBF+VHµ
-2 0 2 4 6 8
10 Standard Model
Best fit 68% CL 95% CL
γ γ H →
→ 4l ZZ*
H →
lν lν WW* → H →
τ τ H →
Preliminary ATLAS
Ldt = 4.6-4.8 fb-1
∫
= 7 TeV s
Ldt = 20.3 fb-1
∫
= 8 TeV s
= 125.5 GeV mH
Figure 2: Likelihood contours in the (µggFf +ttH, µVBFf +VH) plane for the channels f=H , H ZZ 4 , H WW , H and a Higgs boson mass mH = 125.5 GeV. The sharp lower edge of the H ZZ 4 contours is due to the small number of events in this channel and the require- ment of a positive pdf. The best-fit values to the data ( ) and the 68% (full) and 95% (dashed) CL contours are indicated, as well as the SM expectations (+).
5 Coupling fits
In the previous section signal strength scale factors µif for given Higgs boson production or decay modes are discussed. However, for a measurement of Higgs boson couplings, production and decay modes cannot be treated independently. Scenarios with a consistent treatment of Higgs boson couplings in production and decay modes are studied in this section. All uncertainties on the best-fit values shown in this Section take into account both experimental and theoretical systematic values.
5.1 Framework for coupling scale factor measurements
Following the leading order (LO) tree level motivated framework and benchmarks recommended in Ref. [14], measurements of coupling scale factors are implemented for the combination of all analyses and channels summarised in Table 1. This framework is based on the following assumptions:
• The signals observed in the different search channels originate from a single narrow resonance with a mass near 125.5 GeV. The case of several, possibly overlapping, resonances in this mass region is not considered.
• The width of the assumed Higgs boson near 125.5 GeV is neglected, i.e. the zero-width approxi- mation is used. Hence the product BR(i H f) can be decomposed in the following way for all channels:
BR(i H f) = i · f
H ,
where i is the production cross section through the initial state i, f the partial decay width into the final state f and H the total width of the Higgs boson.
• Only modifications of couplings strengths, i.e. of absolute values of couplings, are taken into account, while the tensor structure of the couplings is assumed to be the same as in the SM. This
7
ggF+ttH
µ
VBF / µ
-0.5 0 0.5 1 1.5 2 2.5 3 3.5
Λ-2 ln
0 2 4 6 8 10 12 14 16 18 20 22 24
combined SM expected
Preliminary ATLAS
Ldt = 4.6-4.8 fb-1
∫
= 7 TeV s
Ldt = 20.3 fb-1
∫
= 8 TeV s
= 125.5 GeV mH
Figure 4: Likelihood curve for the ratio µ
VBF/µ
ggF+ttHfor the combination of the H , H ZZ 4 , H WW and H channels and a Higgs boson mass m
H= 125 . 5 GeV. The parameter µ
VH/µ
ggF+ttHis profiled in the fit. The dashed curve shows the SM expectation. The horizontal dashed lines indicate the 68% and 95% CL.
and the total width scale factor
2Hare expressed as functions of the more fundamental coupling scale factors in some fits. To a very good approximation, the relevant expressions for m
H= 125 . 5 GeV are:
2
1 . 59 ·
2W0 . 66 ·
W t+ 0 . 07 ·
2t(2)
2g
1 . 06 ·
2t0 . 07 ·
t b+ 0 . 01 ·
b2(3)
2VBF
0 . 74 ·
2W+ 0 . 26 ·
Z2(4)
2H
0 . 57 ·
2b+ 0 . 22 ·
2W+ 0 . 09 ·
2g+ 0 . 06 ·
2+ 0 . 03 ·
Z2+ 0 . 03 ·
c2. (5) For details and the exact expressions used, see Appendix A and Ref. [14].
The assumptions made for the various measurements are summarised in Table 2 and discussed in the next sections together with the results. The functional dependence of the signal strengths on the e ff ective scale factors
jis explicated for each benchmark model considered and for the most important Higgs boson production and decay modes in Appendix A.
5.2 Fermion versus vector (gauge) couplings
This benchmark is an extension of the fit to the single parameter µ , where di ff erent strengths for the fermion and vector couplings are probed. It assumes that only SM particles contribute to the H and gg H vertex loops, and modifications of the coupling strength factors for fermions and vector bosons are propagated through the loop calculations. The fit is performed in two variants, with and without the assumption that the total width of the Higgs boson is given by the sum of the known SM Higgs boson decay modes (modified in strength by the appropriate fermion and vector coupling scale factors).
5.2.1 Only SM contributions to the total width
The fit parameters are the coupling scale factors
Ffor all fermions and
Vfor all vector couplings:
V
=
W=
ZF
=
t=
b= =
g.
As only SM particles are assumed to contribute to the gg H vertex loop in this benchmark, the gluon fusion process depends directly on the fermion scale factor
2F. The relevant scaling formulae can be found in Appendix A.1.1.
9
Coupling ratio for VBF production only: µ
VBF/µ
ggF+ttH= 1.4
+0.50.4+0.40.3! Evidence at 4.1 for VBF production!
11 / 21
iv.c Combining Coupling measurements
Projection in µVBF+VH-µggF+ttH plane:
τ τ ,ZZ*,WW*, γ
γ ggF+ttH
µ
-2 -1 0 1 2 3 4 5 6
ττ,ZZ*,WW*,γγ VBF+VHµ
-2 0 2 4 6 8
10 Standard Model
Best fit 68% CL 95% CL
γ γ
→ H
→ 4l ZZ*
→ H
ν νl
→ l WW*
→ H
τ τ
→ H
Preliminary ATLAS
Ldt = 4.6-4.8 fb-1
∫
= 7 TeV s
Ldt = 20.3 fb-1
∫
= 8 TeV s
= 125.5 GeV mH
Figure 2: Likelihood contours in the (µggF+ttHf , µVBF+VHf ) plane for the channels f=H , H ZZ 4 , H WW , H and a Higgs boson mass mH = 125.5 GeV. The sharp lower edge of the H ZZ 4 contours is due to the small number of events in this channel and the require- ment of a positive pdf. The best-fit values to the data ( ) and the 68% (full) and 95% (dashed) CL contours are indicated, as well as the SM expectations (+).
5 Coupling fits
In the previous section signal strength scale factors µif for given Higgs boson production or decay modes are discussed. However, for a measurement of Higgs boson couplings, production and decay modes cannot be treated independently. Scenarios with a consistent treatment of Higgs boson couplings in production and decay modes are studied in this section. All uncertainties on the best-fit values shown in this Section take into account both experimental and theoretical systematic values.
5.1 Framework for coupling scale factor measurements
Following the leading order (LO) tree level motivated framework and benchmarks recommended in Ref. [14], measurements of coupling scale factors are implemented for the combination of all analyses and channels summarised in Table 1. This framework is based on the following assumptions:
• The signals observed in the different search channels originate from a single narrow resonance with a mass near 125.5 GeV. The case of several, possibly overlapping, resonances in this mass region is not considered.
• The width of the assumed Higgs boson near 125.5 GeV is neglected, i.e. the zero-width approxi- mation is used. Hence the product BR(i H f) can be decomposed in the following way for all channels:
BR(i H f) = i · f
H ,
where i is the production cross section through the initial state i, f the partial decay width into the final state f and H the total width of the Higgs boson.
• Only modifications of couplings strengths, i.e. of absolute values of couplings, are taken into account, while the tensor structure of the couplings is assumed to be the same as in the SM. This
7
ggF+ttH
µ
VBF / µ
-0.5 0 0.5 1 1.5 2 2.5 3 3.5
Λ-2 ln
0 2 4 6 8 10 12 14 16 18 20 22 24
combined SM expected
Preliminary ATLAS
Ldt = 4.6-4.8 fb-1
∫
= 7 TeV s
Ldt = 20.3 fb-1
∫
= 8 TeV s
= 125.5 GeV mH
Figure 4: Likelihood curve for the ratio µVBF/µggF+ttH for the combination of the H , H ZZ 4 , H WW and H channels and a Higgs boson mass mH = 125.5 GeV. The parameter µVH/µggF+ttH is profiled in the fit. The dashed curve shows the SM expectation. The horizontal dashed lines indicate the 68% and 95% CL.
and the total width scale factor 2H are expressed as functions of the more fundamental coupling scale factors in some fits. To a very good approximation, the relevant expressions for mH = 125.5 GeV are:
2 1.59 ·