The largest EU countries showed particularly sharp reductions of more than 7%, with the UK topping our index with a 10.9% drop in carbon intensity – the highest by any country over the past six years. The UK topped our index with a remarkable 10.9% drop in carbon intensity - the result of a strong economy, a warmer winter and lower coal use.
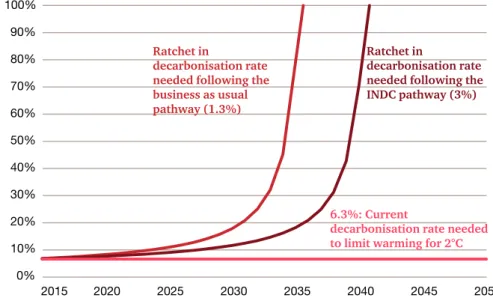
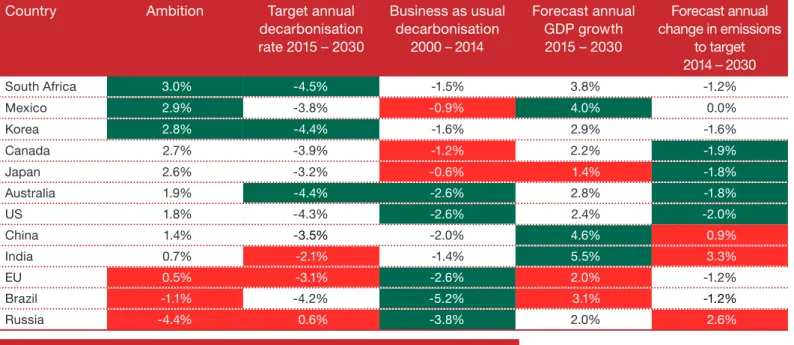
The national targets A step change in ambition
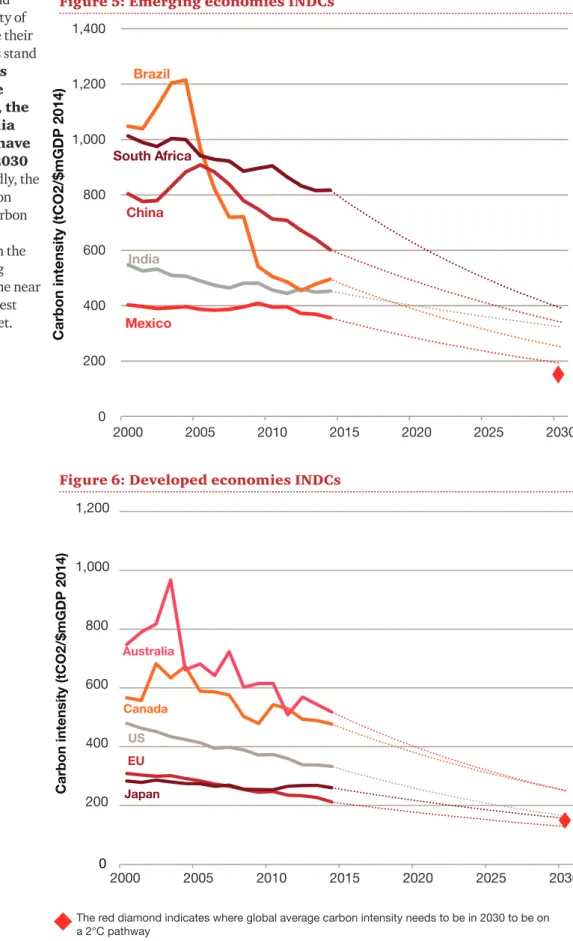
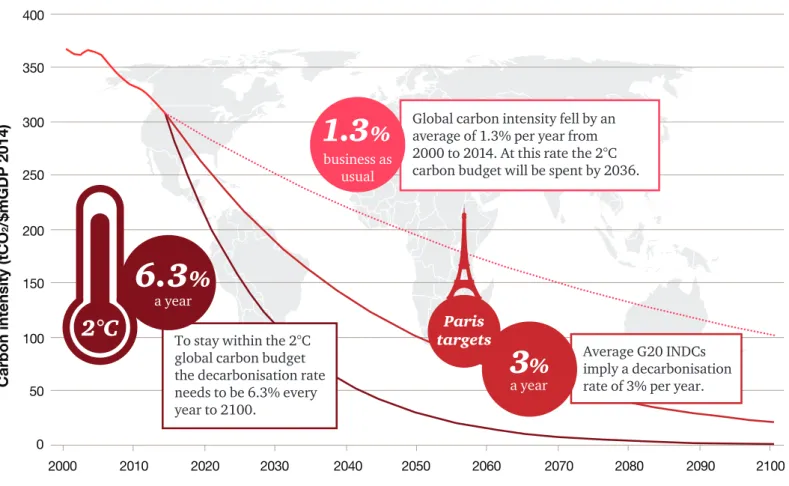
Second, the EU, US and Japan appear to be on track to reach the global average carbon intensity needed for 2°C in 2030. Sources for figures 5, 6 and 7: UNFCCC national communications, government statistics, BP, Energy The red diamond indicates where the global average carbon intensity needs to be in 2030 to be on a 2°C path.
What does this mean for business?
In the short term, most INDCs have focused their emission reduction efforts on the energy, industry and transport sectors, which account for 90%. In this section we focus on the impacts the INDCs will have on energy, industry and transport.
Key countries: Which countries are driving sectoral commitments?
89%) reported making energy efficiency improvements, and over half (54%) are changing strategic investments in light of climate change opportunities. They are also changing how they manage risk (61%) and partnering with suppliers (58%) and consumers (55%) to address opportunities.
Main policies: What are the main policies embedded in the INDCs?
Along with rising energy prices, this was cited as the top near-term concern by business in our latest Pulse Survey of CEOs on climate change. Companies are also motivated by improved growth opportunities. managing risk and costs, increasing shareholder value and rebuilding trust and reputation.
Implications: What are the implications for business?
India's energy consumption has more than doubled this century to 638 Mtoe, and 63% of the increase came from the addition of 216 Mtoe of coal. Policies to tackle coal are central to the major players' INDCs. Table 3: Snapshots of INDCs affecting coal. Major emitters such as China are now starting to introduce carbon pricing, addressing some concerns about the EU's competitiveness.
The majority of the world's most carbon-intensive industrial products are made in a small number of countries. The level of the carbon price and the complex mechanisms (such as free allocation and tax rebates) used by countries to protect different sectors. The majority of the 'clean trillion' will come from the EU, the US, China and India.
As the level of public awareness of the threat of climate change increases, there will be greater public pressure on financial institutions to take a stand on their financing of carbon intensive activities. This has been led by wind and solar collectively increasing their share of the energy mix from 1% to 3%. For half of this century, Australia's carbon intensity has actually increased, driven by emissions rather than changes in GDP (which has grown steadily).
The Ministry of the Environment, 2015, Sustainable energy targets, Emissions reduction fund Energy issues, 2015, feed-in tariff for grid-connected solar systems. Climate change has emerged as one of the most important political and business issues of our time.
Deforestation levels should be 80% below the 1996-2005 average in the Amazon and 40% below 1999-2008 average in the
This publication has been prepared for general guidance only on topics of interest and does not constitute professional advice. You should not act on the information in this publication without obtaining specific professional advice. No representation or warranty (express or implied) is made as to the accuracy or completeness of the information contained in this publication and, to the extent permitted by law, PricewaterhouseCoopers LLP, its members, employees and agents do not accept or assume any liability . , responsibility or duty of care for any consequences of you or anyone else acting, or failing to act, in reliance on the information contained in this publication or for any decision based on it.
In this document, 'PwC' refers to the UK member firm, and sometimes to the PwC network.
Biofuels, ethanol and biodiesel is estimated to form 18% of the energy mix by 2030
It was strongest in the five years leading up to the global recession, where it fell above 3% every year and peaked at 6% in 2007, but contracted only once by 0.2% before the current recession in 2009. But things will return to normal – PwC's World predicts a return to just over 2% by 2050. Oil rose the most in absolute terms at 42% of the energy mix, adding an additional 42Mtoe, supporting Brazil's largest emitting sector after LULUCF, the transport sector.
Gas also increased in absolute terms (27 Mtoe) and more than doubled its share of the fuel mix from 5% to 12% this century. Of the energy-related emissions, transport contributed more than half and industry a quarter, the rest relating to electricity and buildings. Brazil's BAU trajectory, which has reduced on average 5.2% per year since 2000, is the country closest to the LCEI two-degree trajectory.
Brazil's carbon intensity has seen the most dramatic trend this century, due in part to its significant LULUCF sector. We use the average since the turn of the century, including LULUCF, 5.2%, for our business as usual forecast opposite and below. Historical e-emissions data: Brazil's 2nd National Communication to the UNFCCC Emissions and target data: Brazilian Government Decree no.
Ontario has joined the Western Climate Initiative’s (WCI) cap-and- trade scheme, the largest North American carbon market led by Quebec and
The share of renewable energy in the energy mix has remained relatively stable since 2000, fluctuating between 27% and 28%. This is close to what France achieved when it switched to nuclear power in the 1980s. Around US$130 billion of investment will be needed to install 104 GW of wind capacity by 2020 – equivalent to 35,000 3 MW turbines or close to the current installed onshore wind capacity in the EU.
The National Strategy Center for Climate Change estimates that China will need to invest US$6.3 trillion in the low-carbon transition, including energy efficiency improvements, development of renewable energy, nuclear and CCS technology over the next 16 years. Renewable energy: Since 2000, the share of renewable energy in the EU's energy mix has increased from 6% to 13.5% in 2014, primarily through additional wind capacity (3.5 percentage points). Renewable energy displaced coal and gas by 1 percentage point each and oil by 4 percentage points in the fuel mix.
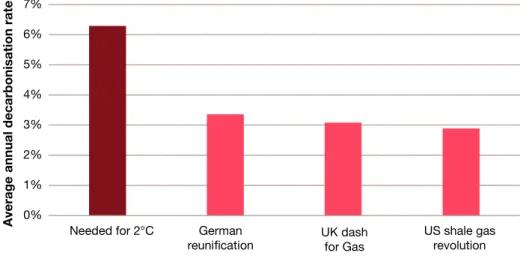
That's faster than the UK gas crunch in the 1990s or Germany's post-reunification restructuring. Using our measure of ambition – the 0.7% gap between BAU and the target lines below – India's level of ambition is behind China (1.4%) and only slightly ahead of the EU (0.5%) coming from a much higher intensity low carbon. Carbon intensity followed a mostly downward trend in the early 2000s, but since the 2008 recession it has fluctuated.
The steel industry - the world's second largest after China - will continue to service domestic carmakers and construction and is internationally competitive because of the weak yen. In comparison, carbon intensity in the US and the EU has decreased by 2.6% each year on average since 2000.
A target for 35% of electricity to come from clean energy sources by 2024 is set out in the Special Program on Climate Change (PECC. Oil remains the largest part of the energy mix, but has fallen from a share of 62% to 45% gas. has been increasingly used to meet growing demand, rising from 26% of the energy mix to 40% in 2014.
In the next three years, renewable energy targets could see $6 billion in investment in wind and. But grid connection issues, unclear rules of the wholesale electricity market reforms and continued retail electricity subsidies create uncertainty for investors. Mandatory reporting, together with the carbon tax, could enable a carbon market in the near future.
This implies that in the last few years until 2030 it will move away from carbon faster than the US did using shale gas. International Carbon Action Partnership, Regulations for Mexico's National Emissions Registry Announced, 2014 Renewable Energy World, The Future of Renewable Power in Mexico, 2015. Energy-intensive sectors may pay a carbon tax of per tonnes of CO2 in the near future (compensation and reliefs carry the price.
284 companies and investors have committed to low-carbon initiatives as part of We Mean Business. South Africa has decarbonized by an average of 1.5% since the turn of the century, similar to that of India. We use the average since the turn of the century, 1.5%, for our business as usual reverse forecast and below.
At the same time, natural gas and renewable energy (wind and solar) will both improve their share of the energy mix by 2 and 3 percentage points, respectively, to 30% and 10%. Renewable energy and natural gas will each gain an additional 2 percentage points of the fuel mix after the CPP, all compared to the baseline scenario. The EPA further predicts that average electricity price increases in the first few years will be in the order of 3%, with some regions of the country facing price increases of up to 6%.
The EPA estimates that these efficiency gains will cost the consumer an average of $985 in initial vehicle costs, but save owners $4,000 in fuel over the life of the vehicle. GDP: Since the turn of the century, GDP has grown by an average of 1.8% per year in constant prices. Overall, the US target appears to be in the middle of the pack in terms of ambition.
Our approach
The challenges of counting carbon
We've worked with clients to understand the major changes disrupting their organizations – and the economy and society as a whole. We've distilled what we've learned into five global shifts that we've seen are having a major impact today and that we think will continue to be important in the decades to come. We want to encourage a debate about how these megatrends and the collisions between them are reshaping the world.
How megatrends are affecting the world today and what it means for the future. For perspectives on the implications, challenges and opportunities of megatrends visit: www.pwc.co.uk/.