Direct dark matter searches:
status and implications
Paolo Gondolo
University of Utah
Direct WIMP searches
• The forbidden fruit
• Confusion of the mind
• Treason and murder
• That which does not kill us makes us stronger
The forbidden fruit
• One naturally obtains the right cosmic
density of WIMPs
Thermal production in hot primordial plasma.The Magnificent WIMP
(Weakly Interacting Massive Particle)
• One can experimentally test the WIMP hypothesis
The same physical processes that produce
the right density of WIMPs make their detection possible
37.2±0.5 pJ/m3 ordinary matter 1 to 5 pJ/m3 neutrinos
202±5 pJ/m3 cold dark matter 524±94 pJ/m3
dark energy
0.04175±0.00004 pJ/m3 photons
Sca tteri ng
f
(—)
f
(—)Production Annihilation
Direct detection
Large scale structure Cosmic density
Indirect detection
Cosmic density
Børge Kile Gjelsten, University of Oslo 44 IDM, Aug 2008
Colliders
The power
of the WIMP
hypothesis
3 kpc
8.3 kpc
Rotation curve (Clemens 1985)
Image by R. Powell using DSS data
Sun
Our galaxy is inside a halo of dark matter particles
1 kpc = 2.06×10¹¹ AU
Galactic dark matter
Dark matter particle
crystal
(or gas or liquid)
Low-background underground detector
CRESST
Dark matter particles that arrive on Earth scatter off nuclei in a detector
The principle of direct detection
Goodman, Witten 1985
Direct dark matter searches
Soudan SuperCDMS
CoGeNT Homestake
LUX
SNOLab DEAP/CLEAN
PICASSO COUPP
Boulby ZEPLIN DRIFT
Modane EDELWEISS Canfranc
ROSEBUDArDM ANAIS
Gran Sasso XENON
CRESST DAMA/LIBRA
DarkSIDE WARP Jinping
PANDA-X TEXONO-CDEX
Kamioka XMASS NEWAGE PICO-LON Yang Yang
KIMS
South Pole DM-ICE
•
XMASS (800 kg LXe, Kamioka, 2011-)•
SuperCDMS (25kg Ge, Soudan, 2012-)•
LUX (350 kg LXe, Homestake, 2012-)•
DarkSide (50 kg LAr, Gran Sasso, 2012-)•
COUPP (60 kg CF3I, SNOLab, 2012-)•
XENON-1T (1 ton LXe, Gran Sasso, 2014-)•
EURECA, DARWIN, ...Background discrimination
From Sanglard 2005 Directional discrimination
Finding the dark matter particles is a fight against background
Gaitskell 2009
Dark Matter, Sept 2007 Rick Gaitskell, Brown University, DOE
DM Direct Search Progress Over Time (2009)
~1 event kg-1 day-1
~1 event 1 tonne-1 yr-1
13
(Gross Masses kg)
ZEPLIN III.1
ZEPLIN III.2
LUX-ZEP 3000kg
LZ 20t CDMS Soudan 2008
LUX 350kg
XENON 100kg
SuperCDMS 25 kg XMASS 800kg
WARP 140kg
SuperCDMS 125 kg XENON 1000kg
σ=10-48
Direct WIMP searches
First publication of an underground experimental search for WIMP cold dark matter (Ahlen et al 1987)
Dark Matter Searches Rick Gaitskell, Brown University, LUX / DOE
Dark Matter Underground Searches - Silver Jubilee in 2012
•
First publication on an underground experimental search for cold dark matter (Ahlen et al.1987. PLB 195, 603-608).
http://www.pnnl.gov/physics/darkmattersymp.stm
Dark Matter Searches Rick Gaitskell, Brown University, LUX / DOE
•
1986 operating a 0.8 kg Ge ionizationdetector at Homestake Mine, SD (adjacent to Ray Davis’s operating Solar Neutrino Experiment)
33 kg-days
1 cts/keVee/kg/day
Sensitivity ~100 Events / kg / day
0.8 kg Ge ionization detector at Homestake Mine, SD
• Filled with 37 kg of CF3I on April 26, 2013
• First bubble May 1, 2013 (radon decay)
• Installation completed May 31, 2013
COUPP-60
• ~3000 kg-days of exposure between 9 and 25 keV threshold
• >1500 neutron source events
• Ultimate goal of 3 year run (50000 kg-days exposure)
Direct WIMP searches
Platonic ideal: a simple binary indicator that only registers
dark-matter-induced nuclear recoils and nothing else
“Almost there with COUPP”
(Gaitskell at IDM2014)
Direct WIMP searches
Background (electron recoil)
David Malling, Uwe Oberlack
Dark Matter Searches Rick Gaitskell, Brown University, LUX / DOE
Reduction in Backgrounds
•
Electron Recoil Events9 LUX-ZEPLIN (Xe 5.6 Tonne Fid.)!
pp solar dominates
Thanks to David Malling, Brown, for preparing slide
Expected event rate is small
Enectali Figueroa-Feliciano / Astroparticle Physics / June 2014
Mass = 20 GeV σN,SI = 10-45 cm2
Channel Number
Measured Banana Spectrum
Hoeling et al Am.J.Phys. 1999, 67, 440.
Expected WIMP Spectrum
The Interaction Rate is Extremely Low!
40K
Expected
WIMP spectrum
~1 event/kg/year
10 zeptobarn
(nuclear recoils)
Enectali Figueroa-Feliciano / Astroparticle Physics / June 2014
Mass = 20 GeV σN,SI = 10-45 cm2
Channel Number
Measured Banana Spectrum
Hoeling et al Am.J.Phys. 1999, 67, 440.
Expected WIMP Spectrum
The Interaction Rate is Extremely Low!
40K
Enectali Figueroa-Feliciano / Astroparticle Physics / June 2014
Mass = 20 GeV σN,SI = 10-45 cm2
Channel Number
Measured Banana Spectrum
Hoeling et al Am.J.Phys. 1999, 67, 440.
Expected WIMP Spectrum
The Interaction Rate is Extremely Low!
40K
Expected
WIMP spectrum
Measured
banana spectrum
~1 event/kg/year
10 zeptobarn
~100 events/kg/second
(nuclear recoils) (electron recoils)
Expected event rate is small
Enectali Figueroa-Feliciano / Astroparticle Physics / June 2014
Mass = 20 GeV σN,SI = 10-45 cm2
Channel Number
Measured Banana Spectrum
Hoeling et al Am.J.Phys. 1999, 67, 440.
Expected WIMP Spectrum
The Interaction Rate is Extremely Low!
40K
Enectali Figueroa-Feliciano / Astroparticle Physics / June 2014
Mass = 20 GeV σN,SI = 10-45 cm2
Channel Number
Measured Banana Spectrum
Hoeling et al Am.J.Phys. 1999, 67, 440.
Expected WIMP Spectrum
The Interaction Rate is Extremely Low!
40K
Expected
WIMP spectrum
Measured
banana spectrum
~1 event/kg/year
10 zeptobarn
~100 events/kg/second
(nuclear recoils) (electron recoils)
“NO BANANAS IN THE LAB”
(Feliciano-Figueroa)
Expected event rate is small
Confusion of the mind
experimental residuals of the single-hit scintillation events rate vs time and energy
DAMA/NaI + DAMA/LIBRA-phase1 Total exposure: 487526 kg×day = 1.33 ton×yr
2-5 keV!
2-6 keV!
A=(0.0179±0.0020) cpd/kg/keV χ2/dof = 87.1/86 9.0 σ C.L.
2-4 keV!
The data favor the presence of a modulated behavior with proper features at 9.2σ C.L.
A=(0.0135±0.0015) cpd/kg/keV χ2/dof = 68.2/86 9.0 σ C.L.
A=(0.0110±0.0012) cpd/kg/keV χ2/dof = 70.4/86 9.2 σ C.L.
Absence of modulation? No
χ2/dof=169/87 ⇒ P(A=0) = 3.7×10⁻⁷
Absence of modulation? No
χ2/dof=154/87 ⇒ P(A=0) = 1.3×10⁻⁵ Acos[ω(t-t0)] ;
continuous lines: t0 = 152.5 d, T = 1.00 y
Absence of modulation? No
χ2/dof=152/87 ⇒ P(A=0) = 2.2×10⁻⁵
Model Independent DM Annual Modulation Result
Bernabei et al (DAMA) 1997-10
9.2σ detection
Drukier, Freese, Spergel 1986
4
FIG. 4: Time evolution of the rate in several energy regions.
The last bin spans eight days. A dotted line denotes the best-fit modulation found. A solid line indicates nominal pre- dictions (see text). These lines overlap for the bottom panels.
the muon flux at SUL varies seasonally by ±2%, and radon levels by a factor ∼4 [24]. Muon-coincident events constitute a few percent of the low-energy spectrum [1], limiting a muon-induced modulated amplitude to<<1%
[6]. Rejection of veto-coincident events does not alter the observed modulation. Radon displacement via pressur- ized LN boil-offgas is continuously maintained at 2 l/min within an aluminum shell encasing the lead shielding [25].
A radon-induced modulation would be expected to affect a much broader spectral region than observed [26].
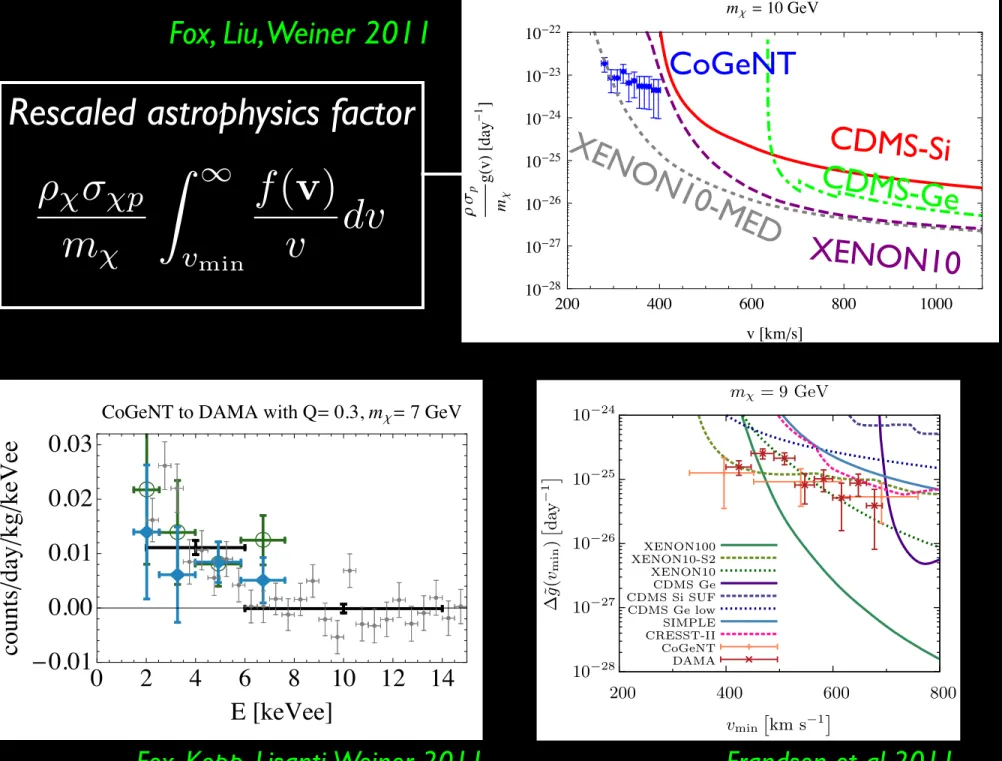
The CDMS collaboration has recently claimed [7] to exclude a light-WIMP interpretation of CoGeNT and DAMA/LIBRA observations. In view of the compatibil- ity of a mχ∼7 GeV/c2, σSI ∼10−4pb WIMP with both CoGeNT (Fig. 1) and CDMS [16], a search for an annual modulation in CDMS data seems in order. Observations from XENON10 [18] and XENON100 [8] have been used to generate a similar rejection of light-WIMP scenarios.
The assumptions in [8, 18] are examined in [17], where no presently compelling case for this exclusion is found.
In conclusion, presently available CoGeNT data favor the presence of an annual modulation in the low-energy spectral rate, for events taking place in the bulk of the detector only. While its origin is presently unknown,
the spectral and temporal information are prima facie congruent when the WIMP hypothesis is examined: in particular, the WIMP mass region most favored by the spectral analysis (Fig. 2) generates predictions for the modulated amplitude in good agreement with observa- tions, modulo the dependence of this assertion on the choice of astrophysical parameters [21–23].
ACKNOWLEDGMENTS
Work sponsored by NSF grants PHY-0653605 and PHY-1003940, The Kavli Foundation and LDRD pro- gram at PNNL. N.F. is supported by the DOE/NNSA SSGF program. We owe much gratitude to the person- nel at SUL for their assistance. We are indebted to D.
Hooper and N. Weiner for many useful exchanges.
∗ Present address: Department of Physics, Stanford Uni- versity, Stanford, CA 94305, USA
† Contact author: [email protected]
‡ Present address: Physics Department, Technische Uni- versit¨at M¨unchen, Munich, Germany
[1] C.E. Aalseth et al., Phys. Rev. Lett. 106 (2011) 131301.
[2] P.S. Barbeau, J.I. Collar and O. Tench, JCAP 09 (2007) 009.
[3] C.E. Aalseth et al., Phys. Rev. Lett. 101 (2008) 251301;
Erratum ibid 102 (2009) 109903.
[4] A.K. Drukier, K. Freese and D.N. Spergel, Phys. Rev.
D33 (1986) 3495.
[5] M.G. Marino, PhD Diss., Univ. of Washington (2010).
[6] CoGeNT collaboration, in preparation.
[7] Z. Ahmed et al., Phys. Rev. Lett. 106 (2011) 131302.
[8] E. Aprile et al., arXiv:1104.2549.
[9] J.N. Bahcall, Phys. Rev. 132 (1963) 362.
[10] P.S. Barbeau, Ph.D. Diss., University of Chicago (2009).
[11] D. Hooper et al., Phys. Rev. D82 (2010) 123509.
[12] R. Bernabei et al., Eur. Phys. J. C56 (2008) 333.
[13] D. Hooper and L. Goodenough, Phys. Lett. B697(2011) 412; D. Hooper and T. Linden, Phys. Rev. D83 (2011) 083517; M.R. Buckley et al., arXiv:1104.3145 and 1103.6035; P.J. Fox et al., arXiv:1104.4127.
[14] N. Bozorgnia, G.B. Gelmini and P. Gondolo, JCAP 1011:019,2010.
[15] D.S. Akerib et al., Phys. Rev. D82 (2010) 122004.
[16] J.I. Collar, arXiv:1103.3481.
[17] J.I. Collar, submitted to arXiv.
[18] J. Angle et al., arXiv:1104.3088.
[19] J.D. Lewin and P.F. Smith, Astrop. Phys. 6 (1996) 87.
[20] K. Freese, J. Frieman and A. Gould, Phys. Rev. D37 (1988) 3388.
[21] M. Kuhlen et al., JCAP 1002 (2010) 030.
[22] P.J. Fox, J. Liu and N. Weiner, arXiv:1011.1915.
[23] C. Kelso and D. Hooper, JCAP 1102:002,2011.
[24] M. Goodman, Procs. of the 26th Intl. Cosmic Ray Conf., Aug. 17-25, Salt Lake City, Utah.
[25] http://cogent.pnnl.gov/gallery.stm
[26] G. Heusser et al., Appl. Radiat. Isot. 43 (1992) 9.
Annually modulated...
Aalseth et al (CoGeNT) 1106.0650
Anglehor et al (CRESST) 2011
G. Angloher et al.: Results from 730 kg days of the CRESST-II Dark Matter Search 15
M1 M2
e/ -events 8.00±0.05 8.00±0.05
↵-events 11.5+2.62.3 11.2+2.52.3
neutron events 7.5+6.35.5 9.7+6.15.1 Pb recoils 15.0+5.25.1 18.7+4.94.7 signal events 29.4+8.67.7 24.2+8.17.2
m [GeV] 25.3 11.6
WN[pb] 1.6·10 6 3.7·10 5
Table 4.Results of the maximum likelihood fit. Shown are the expected total contributions from the backgrounds consid- ered as well as from a possible WIMP signal, for the parameter values of the two likelihood maxima. The small statistical er- ror given for thee/ -background reflects the large number of observed events in thee/ -band. The other errors correspond to a 1 confidence interval as determined by MINOS (see Sec- tion 5.1). The corresponding WIMP mass and interaction cross section are listed for each of the two likelihood maxima.
one event per module according to the choice of the ac- ceptance region, with a negligible statistical uncertainty due to the large number of events in thee/ -band. The lead recoil and the↵-background are similar to our simple estimates given in Section 4. Both these backgrounds are slightly larger than the contribution from neutron scatter- ings. In the context of the latter, the fit assigns roughly half of the coincident events to neutrons from a radioac- tive source and to muon-induced neutrons, respectively.
This translates into about 10 % of the single neutron back- ground being muon-induced.
In both likelihood maxima the largest contribution is assigned to a possible WIMP signal. The main di↵erence between the two likelihood maxima concerns the best-fit WIMP mass and the corresponding cross section, with m = 25.3 GeV in case of M1 andm = 11.6 GeV for the case M2. The possibility of two di↵erent solutions for the WIMP mass can be understood as a consequence of the di↵erent nuclei present in our target material. The given shape of the observed energy spectrum can be explained by two sets of WIMP parameters: in the case of M1, the WIMPs are heavy enough to detectably scatter o↵tung- sten nuclei (cp. Fig. 1), about 69 % of the recoils are on tungsten,⇠25 % on calcium and⇠7 % on oxygen, while in M2, oxygen (52 %) and calcium recoils (48 %) constitute the observed signal and lead to a similar spectral distri- bution in terms of the recoil energy. The two possibilities can, in principle, be discriminated by the light yield dis- tribution of the signal events. However, at the low recoil energies in question, there is considerable overlap between the oxygen, calcium, and tungsten bands, so that we can currently not completely resolve the ambiguity. This may, however, change in a future run of the experiment.
Fig. 11 illustrates the fit result, showing an energy spectrum of all accepted events together with the expected contributions of backgrounds and WIMP signal. The solid lines correspond to the likelihood maximum M1, while the dashed lines belong to M2. The complicated shape
10 15 20 25 30 35 40
Energy [keV]
0 2 4 6 8
accepted events / keV
total WIMP signal γ bck Pb recoil bck α bck neutron bck
Fig. 11. (Color online) Energy spectrum of the accepted events from all detector modules, together with the expected contributions from the considered backgrounds and a WIMP signal, as inferred from the likelihood fit. The solid and dashed lines correspond to the fit results M1 and M2, respectively.
of the expectations is the result of taking into account the energy-dependent detector acceptances. In particular, the di↵erent energy thresholds of the individual detector modules lead to a steep increase of the expectations when an additional module sets in.
We note that neither the expected↵- or lead recoil backgrounds nor a possible neutron background resemble a WIMP signal in terms of the shape of their energy spec- trum. Even if our analysis severely underestimated one of these backgrounds, this could therefore hardly be the explanation of the observed event excess.
On the other hand, the leakage of e/ -events rises steeply towards low energies and one may be tempted to consider a strongly underestimatede/ -background as the source of the observation. However, in addition to the en- ergy spectrum, also the distribution in the light yield pa- rameter needs to be taken into account. Fig. 12 shows the corresponding light yield spectrum of the accepted events, together with the expectations from all considered sources.
Again, the shape of the expectations is the result of the individual detector acceptances being considered. As ex- pected, the contributions from thee/ - and also from the
↵-background quickly decrease towards lower light yields and thus di↵er significantly from the expected distribution of a WIMP signal.
In order to check the quality of the likelihood fit, we calculate ap-value according to the procedure summarized in Section 5.1. We divide the energy-light yield plane into bins of 1 keV and 0.02, respectively, and include the accep- tance region of each module as well as the alpha- and Pb recoil reference regions in the calculation. The two likeli- hood maxima are found to give very similar results, with p-values of about 0.36 and 0.35, respectively. This not very small value forpindicates an acceptable description by our background-and-signal model.
Unexplained
...and unmodulated
3
FIG. 2. Ionization yield versus recoil energy in all detectors included in this analysis for events passing all signal criteria except (top) and including (bottom) the phonon timing crite- rion. The curved black lines indicate the signal region (-1.8 and +1.2 from the mean nuclear recoil yield) between 7 and 100 keV recoil energies, while the gray band shows the range of charge thresholds. Electron recoils in the detector bulk have yield near unity. The data are colored to indicate recoil energy ranges (dark to light) of 7–20, 20–30, and 30–100 keV to aid the interpretation of Fig. 3.
the exposure of this analysis is equivalent to 23.4 kg-days over a recoil energy range of 7–100 keV for a WIMP of mass 10 GeV/c2.
Neutrons from cosmogenic or radioactive processes can produce nuclear recoils that are indistinguishable from those from an incident WIMP. Simulations of the rates and energy distributions of these processes using GEANT4 [22] lead us to expect < 0.13 false candidate events (90% confidence level) in the Si detectors from neutrons in this exposure.
A greater source of background is the misidentifica- tion of surface electron recoils, which may su↵er from re- duced ionization yield and thus contribute events to the WIMP-candidate region; these events are termed “leak- age events”. Prior to looking at the WIMP-candidate region (unblinding), the expected leakage was estimated using the rate of single scatter events with yields con- sistent with nuclear recoils from a previously unblinded dataset [23] and the rejection performance of the timing cut measured on low-yield multiple-scatter events from
133Ba calibration data. Two detectors used in this anal- ysis were located at the end of detector stacks, so scatters on their outer faces could not be tagged as multiple scat- ters. The rate of surface events on the outer faces of these two detectors were estimated using their single-scatter rates from a previously unblinded dataset presented in [23] and the multiples-singles ratio on the interior de- tectors. The final pre-unblinding estimate for misidenti- fied surface electron-recoil event leakage into the signal band in the eight Si detectors was 0.47+0.280.17(stat.) events.
This initial leakage estimate informed the decision to un-
−4 −2 0 2 4 6 8
−10
−5 0 5 10 15 20 25
Normalized Yield
Normalized Timing
FIG. 3. Normalized ionization yield (standard deviations from the nuclear recoil band centroid) versus normalized phonon timing parameter (normalized such that the median of the surface event calibration sample is at -1 and the cut position is at 0) for events in all detectors from the WIMP- search data set passing all other selection criteria. The black box indicates the WIMP candidate selection region. The data are colored to indicate recoil energy ranges (dark to light) of 7–20, 20–30, and 30–100 keV. The thin red curves on the bot- tom and right axes are the histograms of the data, while the thicker green curves are the histograms of nuclear recoils from
252Cf calibration data.
blind. After unblinding, we developed a Bayesian es- timate of the rate of misidentified surface events based upon the performance of the phonon timing cut mea- sured using events near the WIMP-search signal region [23]. Multiple-scatter events below the electron-recoil ionization-yield region from both 133Ba calibration and the WIMP-search data were used as inputs to this model.
Because the WIMP-search sample is sparser compared to the calibration data, the combined estimates are more heavily weighted towards the calibration data leakage es- timates. Additionally the leakage estimate is corrected for the fact that the passage fraction of singles and mul- tiples di↵ers by a factor of 1.7+0.80.6, as measured on low- yield events outside of the nuclear recoil band. The sys- tematic uncertainty on the leakage estimate comes from the uncertainty on this scale factor, the choice of prior in the Bayesian analysis, and the method used to reweigh the energy distribution of surface events from calibration data to reflect the distribution in WIMP search data.
The final model predicts an updated surface-event leak- age estimate of 0.41+0.200.08(stat.)+0.280.24(syst.) misidentified surface electron-recoil events in the eight Si detectors.
Classical confidence intervals provided similar estimates [24].
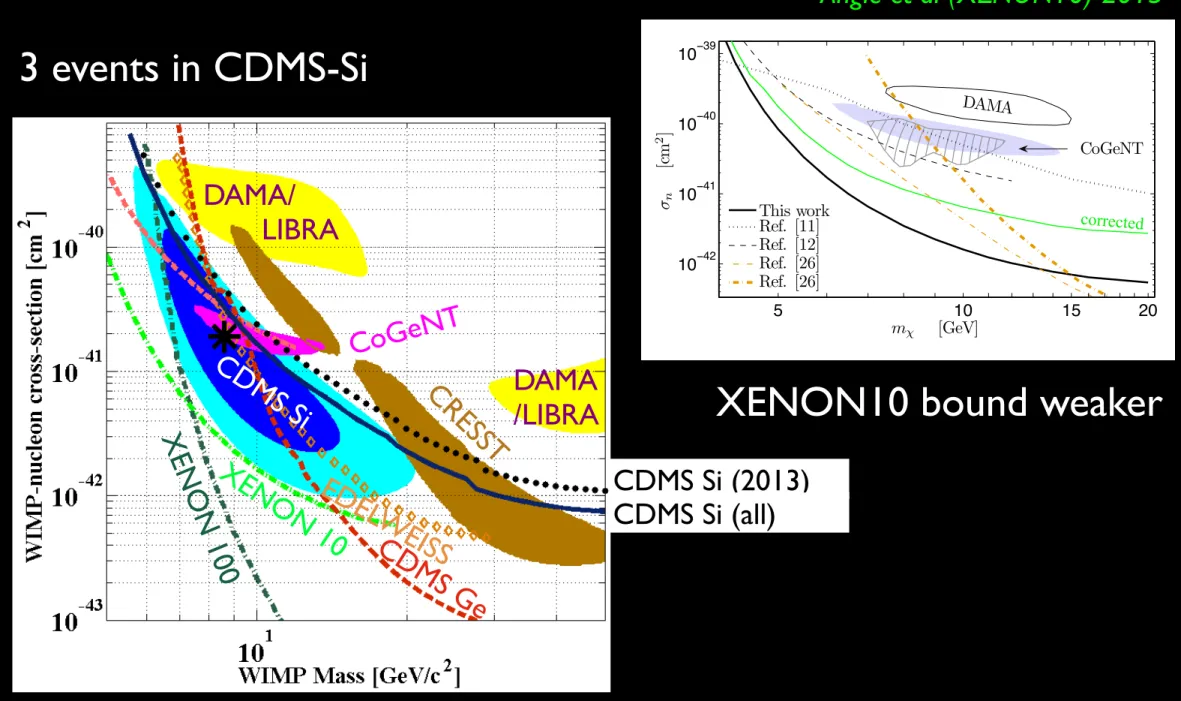
After all WIMP-selection criteria were defined, the sig- nal regions of the Si detectors were unblinded. Three WIMP-candidate events were observed, with recoil en- ergies of 8.2, 9.5, and 12.3 keV, on March 14, July 1, and September 6 of 2008, respectively. Two events were observed in Detector 3 of Tower 4, and the third was ob-
Agnese et al (CDMS) 2013
Evidence for light dark matter particles?
What is new?
• Detector recovered from 3 mo post-fire outage w/o significant changes in performance. It has been continuously taking data ever since. All data are usable (compare to 10%-40% in CDMS low-energy analyses).
• Large exposure allows optimal separation of bulk and surface events down to 0.5 keVee threshold. Rise-time behavior as predicted by simulations and calibrations (PRD 88 (2013) 012002). Smooth variation of fit parameters with energy.
• Paper under review, preprint to appear soon. Data to be released in energy, time-stamp, and rise-time format. A straightforward analysis indicates a persistent annual modulation exclusively at low energy and for bulk events. Best-fit phase consistent with DAMA/LIBRA (small offset may be meaningful). Similar best-fit parameters to 15 mo dataset, but with much better bulk/surface separation (~90% SA for~90% BR)
Dotted: free T Solid: T= 365 d
See also
poster by M. Kos.
Additional four months of unanalyzed data acquired (run is still ongoing)
Collar (CoGeNT) 2013
4
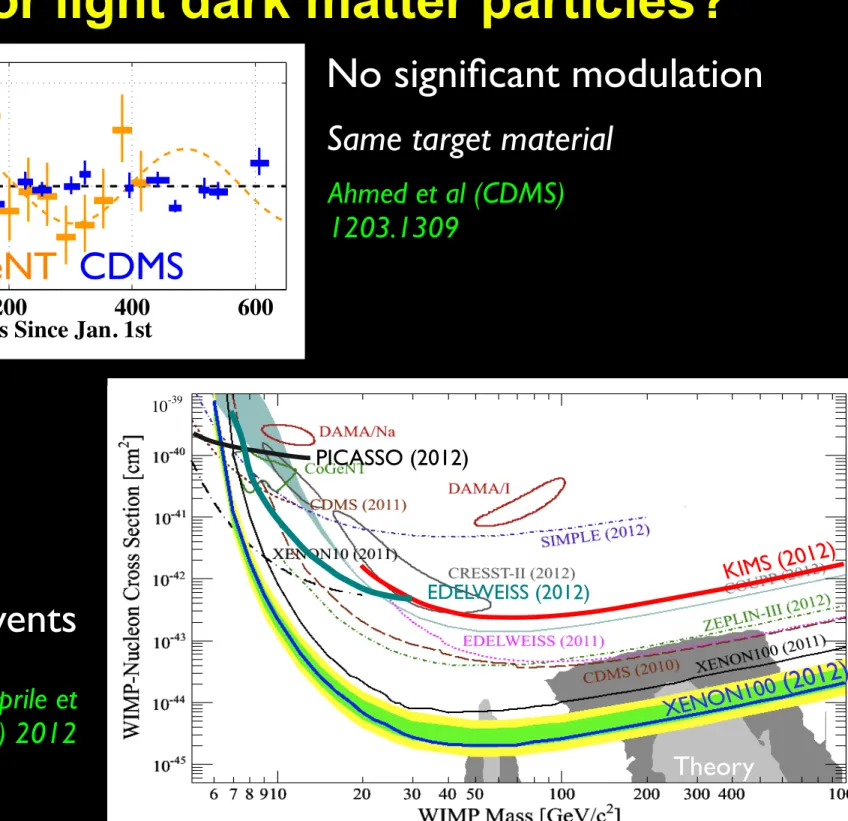
0 200 400 600
−0.5 0 0.5
Days Since Jan. 1st
Rate [kg day keVnr]−1
FIG. 1. (color online) The rate of CDMS II nuclear-recoil band events is shown for the 5.0–11.9 keVnr interval (dark blue), after subtracting the best-fit unmodulated rate, d, for each detector. The horizontal bars represent the time bin extents, the vertical bars show ±1 statistical uncertain- ties (note that one CDMS II time bin is of extremely short duration). The CoGeNT rates (assuming a nuclear-recoil en- ergy scale) and maximum-likelihood modulation model in this energy range (light orange) are shown for comparison. The CDMS exposure starts in late 2007, while the CoGeNT expo- sure starts in late 2009.
rates in this energy range with amplitudes greater than 0.06 [keVnr kg day] 1 are excluded at the 99% C.L.
For comparison, a similar analysis was carried out us- ing the publicly available CoGeNT data [19]. Our analy- sis of CoGeNT data is consistent with previously pub- lished analyses [6, 7, 14]. Figure 3 shows the modu- lated spectrum of both CDMS II and CoGeNT, assum- ing the phase (106 days) which best fits the CoGeNT data over the full CoGeNT energy range. Compatibil- ity between the annual modulation signal of CoGeNT and the absence of a significant signal in CDMS is de- termined by a likelihood-ratio test, which involves cal- culating ⌘ L0/L1, where L0 is the combined max- imum likelihood of the CoGeNT and CDMS data as- suming both arise from the same simultaneous best-fit values of M and , while L1 is the product of the maxi- mum likelihoods when the best-fit values are determined for each dataset individually. The probability distribu- tion function of 2 ln was mapped using simulation, and agreed with the 2 distribution with two degrees of freedom, as expected in the asymptotic limit of large statistics and away from physical boundaries. The simu- lation found only 82 of the 5⇥103 trials had a likelihood ratio more extreme than was observed for the two ex- periments, confirming the asymptotic limit computation which indicated 98.3% C.L. incompatibility between the annual-modulation signals of CoGeNT and CDMS for the 5.0–11.9 keVnr interval.
We extend this analysis by applying the same method to CDMS II single-scatter and multiple-scatter events without applying the ionization-based nuclear-recoil cut.
These samples are both dominated by electron recoils.
Figure 4 shows the confidence intervals for the allowed
0.175
0.35 [keVnr kg day]
−1
π/2 (~Apr.1)
3π/2 (~Oct.1) π
(~Jul.1)
0 (Jan.1)
FIG. 2. (color online) Allowed regions for annual modulation of CoGeNT (light orange) and the CDMS II nuclear-recoil sample (dark blue), for the 5.0–11.9 keVnr interval. In this and the following polar plot, a phase of 0 corresponds to Jan- uary 1st, the phase of a modulation signal predicted by generic halo models (152.5 days) is highlighted by a dashed line, and 68% (thickest), 95%, and 99% (thinnest) C.L. contours are shown.
0 2.27 5 7.3 9.6 11.9
−0.2 0 0.2 0.4 0.6
Recoil Energy [keVnr]
Modulated Rate [kg day keVnr]−1
0 0.50 1.21 1.85 2.51 3.20
Recoil Energy [CoGeNT keVee]
FIG. 3. (color online) Amplitude of modulation vs. energy, showing maximum-likelihood fits for both CoGeNT (light or- ange circles, 68% confidence interval shown with vertical line) and CDMS nuclear-recoil singles (dark blue rectangles, 68%
confidence interval given by rectangle height). The phase that best fits CoGeNT over all energies (106 days) was chosen for this representation. The upper horizontal scale shows the electron-recoil-equivalent energy scale for CoGeNT events.
The 5–11.9 keVnr energy range over which this analysis over- laps with the low-energy channel of CoGeNT has been divided into 3 (CDMS) and 6 (CoGeNT) equal-sized bins.
Ahmed et al (CDMS) 1203.1309
CoGeNT CDMS
No significant modulation
Same target material
Not so many events
XENON100: New Spin-Independent Results
Upper Limit (90% C.L.) is 2 x 10-45 cm2 for 55 GeV/c2 WIMP
Wednesday, July 18, 2012
KIMS (2012) PICASSO (2012)
10-39
EDELWEISS (2012)
XENON100 (2012) Theory
Adapted from Aprile et al (XENON-100) 2012
Evidence for light dark matter particles?
Agnese et al (CDMS) 2013
4 timing that are transformed so that the WIMP accep-
tance regions of all detectors coincide.
After unblinding, extensive checks of the three candi- date events revealed no data quality or analysis issues that would invalidate them as WIMP candidates. The signal-to-noise on the ionization channel for the three events (ordered in increasing recoil energy) was measured to be 6.7 , 4.9 , and 5.1 , while the charge threshold had been set at 4.5 from the noise. A study on pos- sible leakage into the signal band due to 206Pb recoils from 210Po decays found the expected leakage to be neg- ligible with an upper limit of < 0.08 events at the 90%
confidence level. The energy distribution of the 206Pb background was constructed using events in which a co- incident ↵ was detected in a detector adjacent to one of the 8 Si detectors used in this analysis. Further- more, as in the Ge analysis, we developed a Bayesian estimate of the rate of misidentified surface events based upon the performance of the phonon timing cut mea- sured using events near the WIMP-search signal region [22]. Classical confidence intervals provided similar esti- mates [23]. Multiple-scatter events below the electron- recoil ionization-yield region from both 133Ba calibration and WIMP-search data were used as inputs to this model.
The final model predicts an updated surface-event leak- age estimate of 0.41+0.200.08(stat.)+0.280.24(syst.) misidentified surface events in the eight Si detectors.
This result constrains the available parameter space of WIMP dark matter models. We compute upper lim- its on the WIMP-nucleon scattering cross section using Yellin’s optimum interval method [24]. We assume a WIMP mass density of 0.3 GeV/c2/cm3, a most probable WIMP velocity with respect to the galaxy of 220 km/s, a mean circular velocity of Earth with respect to the galactic center of 232 km/s, a galactic escape velocity of 544 km/s [25], and the Helm form factor [26]. Fig. 4 shows the derived upper limits on the spin-independent WIMP-nucleon scattering cross section at the 90% con- fidence level (C.L.) from this analysis and a selection of other recent results. The present data set an upper limit of 2.4⇥ 10 41 cm2 for a WIMP of mass 10 GeV/c2. We are completing the calibration of the nuclear recoil energy scale using the Si-neutron elastic scattering resonant fea- ture in the 252Cf exposures. This study indicates that our reconstructed energy may be 10% lower than the true re- coil energy, which would weaken the upper limit slightly.
Below 20 GeV/c2 the change is well approximated by shifting the limits parallel to the mass axis by ⇠ 7%. In addition, neutron calibration multiple scattering e↵ects improve the response to WIMPs by shifting the upper limit down parallel to the cross-section axis by ⇠ 5%.
A model of our known backgrounds, including both energy and expected rate distributions, was constructed for each detector and experimental run for each of the three backgrounds considered: surface electron recoils, neutron backgrounds, and 206Pb recoils. Simulations of our background model yield a 5.4% probability of a sta- tistical fluctuation producing three or more events in our
FIG. 4. Experimental upper limits (90% confidence level) for the WIMP-nucleon spin-independent cross section as a func- tion of WIMP mass. We show the limit obtained from the ex- posure analyzed in this work alone (black dots), and combined with the CDMS II Si data set reported in [22] (blue solid line).
Also shown are limits from the CDMS II Ge standard [11] and low-threshold [27] analysis (dark and light dashed red), EDEL- WEISS low-threshold [28] (orange diamonds), XENON10 S2- only [29] (light dash-dotted green), and XENON100 [30] (dark dash-dotted green). The filled regions identify possible signal regions associated with data from CoGeNT [31] (magenta, 90% C.L., as interpreted by Kelso et al. including the e↵ect of a residual surface event contamination described in [32]), DAMA/LIBRA [16, 33] (yellow, 99.7% C.L.), and CRESST [18] (brown, 95.45% C.L.) experiments. 68% and 90% C.L.
contours for a possible signal from these data are shown in blue and cyan, respectively. The asterisk shows the maxi- mum likelihood point at (8.6 GeV/c2, 1.9⇥ 10 41 cm2).
signal region.
This model of our known backgrounds was used to in- vestigate the data in the context of a WIMP+background hypothesis. We performed a profile likelihood analysis in which the background rates were treated as nuisance pa- rameters and the WIMP mass and cross section were the parameters of interest. The highest likelihood is found for a WIMP mass of 8.6 GeV/c2 and a WIMP- nucleon cross section of 1.9⇥10 41 cm2. The goodness- of-fit test of this WIMP+background hypothesis results in a p-value of 68%, while the background-only hypoth- esis fits the data with a p-value of 4.5%. A profile like- lihood ratio test including the event energies finds that the data favor the WIMP+background hypothesis over our background-only hypothesis with a p-value of 0.19%.
Though this result favors a WIMP interpretation over the known-background-only hypothesis, we do not be- lieve this result rises to the level of a discovery.
CDMS Si (2013) CDMS Si (all) CDM
S Ge XENON 10
XEN ON
100
DAMA/
LIBRA
DAMA /LIBRA CoGeNT
CRESST CDM
S Si
EDELWEISS
Evidence for light dark matter particles?
ERRATUM: SEARCH FOR LIGHT DARK MATTER IN XENON10 DATA
XENON10 Collaboration
(Dated: May 3, 2013)
In our letter, the 90% CL exclusion limits presented in Fig. 3 were incorrect, due to a software bug. The corrected limits are shown in Fig. 4, keeping all other assumptions and parameters as described in the original work. This leads to a decrease in sensitivity of approximately {⇥2,⇥4,⇥5} at dark matter particle masses of {5,10,20} GeV. The corrected limit calculation is in good agreement with the work of [1] if we make the same astrophysical assumptions.
The original conclusions of the letter are not a↵ected by this correction.
We also point out that the parameterization of the detector energy resolution contained a typo: it should read R(Enr) = (QyEnr) 1/2.
m [GeV]
n[cm2 ]
DAMA
CoGeNT
5 10 15 20
10−42 10−41 10−40 10−39
This work Ref. [11]
Ref. [12]
Ref. [26]
Ref. [26]
corrected
FIG. 1: Previously published (solid curve, labeled “This work”) and corrected (solid green curve, labeled “corrected”) 90% CL exclusion limits obtained from our data. The original figure is otherwise unmodified.
[1] M. T. Frandsen, F. Kahlhoefer, C. McCabe, S. Sarkar and K. Schmidt-Hoberg, arXiv:1304.6066 [hep-ph].
3 events in CDMS-Si
XENON10 bound weaker
Angle et al (XENON10) 2013
.
✓ event rate
◆
=
✓ detector response
◆
⇥
✓ particle physics
◆
⇥ (astrophysics)
DM-nucleus elastic scattering
Dark matter particle
Nuclear recoil
Detector response model
Is a nuclear recoil detectable?
Probability of detecting an event with energy (or number of photoelectrons) E, given an event occurred with recoil energy ER.
Counting efficiency, energy resolution, scintillation response, etc.
.
✓ event rate
◆
=
✓ detector response
◆
⇥
✓ particle physics
◆
⇥ (astrophysics)
.
✓ detector response
◆
= G (E, E
R)
Detector response model
.
✓ event rate
◆
=
✓ detector response
◆
⇥
✓ particle physics
◆
⇥ (astrophysics)
G (E, E
R)
A common model for is a Gaussian with mean value
and standard deviation equal to the energy resolution
(but there are exceptions, e.g., the XENON experiments)
E = Q E
RQuenching factor
Detector response model
.
✓ event rate
◆
=
✓ detector response
◆
⇥
✓ particle physics
◆
⇥ (astrophysics)
Lin et al (TEXONO) 2007
11
0.1 0.15 0.2 0.25 0.3 0.35 0.4 0.45 0.5
10-1 1 10 102
FIG. 3: A compilation of all quenching factor (QF) mea- surements on germanium, with calculations from the TRIM software [6] as well as by the Lindhard model [7] under two parametrizations (k=0.20 and 0.15) overlaid.
of 10−39 cm2 throughout in this Section) at mχ = 5 GeV would increase (become less constraining) from 0.81 to 0.88.
B. Quenching Factor
A compilation of all quenching factor (QF) measure- ments on germanium is given in Figure 3. Overlaid are calculations from the TRIM software [6] as well as by the Lindhard model [7] under two parametrizations (k=0.20 and 0.157). Both schemes have been adopted in various CDM experiments. It can be seen that the TRIM re- sults explain well the QF measurements at both low and high energy. Accordingly, we chose to use this scheme in our analysis. The QF values are less than those evaluated with the Lindhard (k=0.20) model, and hence would give rise to more conservative results.
If Lindhard (k=0.20) would be used, the QF at 1 keV recoil energy will be increased from 0.20 to 0.21. The QF uncertainty estimations of 0.006 in Ref. [2] can ac- count for this deviation. This alternative choice will only have minor effects on the exclusion limits, decreas- ing it (becoming more constraining) from 0.81 to 0.80 at
mχ = 5 GeV
C. Constructing Exclusion Plots
The unbinned “optimal interval method” as formu- lated in Ref. [8] was adopted to derive the exclusion lim- its. The unbinned formalism allows the use of all avail- able information in the background spectra and was used in other CDM experiments like CDMS and XENON. NO background profile was assumed or subtracted, which is also a conservative approach. The sensitivities at low mχ
under this scheme are driven by the absence of counts be- tween 198 eV and 241 eV.
An alternative method would be to place the back- ground events in different energy bins and follow the for- malism of Ref. [9]. For instance, choosing 50-eV bins for E>100 eV (thereby deliberately filling the hole at 200−250 eV), the σSIχN limit at mχ = 5 GeV would in- crease (become less constraining) from 0.81 to 1.20. This reduction in sensitivities is expected since data binning involves loss of information.
We conclude that our choices in these three aspects of the experiment are justified. The sensitivities of the physics results (exclusion upper limits) are dominated by the statistical uncertainties of the background spectra.
The potential effects on them are minor if alternative schemes would have be chosen instead.
∗ Corresponding Author: [email protected];
Tel:+886-2-2789-6789; FAX:+886-2-2788-9828.
[1] F.T. Avignone III, P.S. Barbeau and J.I. Collar, arXiv:
0806.1314v3 (2008).
[2] S.T. Lin et al., TEXONO Collaboration, arXiv:0712.1645 (2007).
[3] F.T. Avignone III, P.S. Barbeau and J.I. Collar, arXiv:
0806.1314v2 (2008).
[4] H.B. Li et al., Reply to arXiv:0806.1341v2 (2008).
[5] H.B. Li et al., Phys. Rev. Lett. 90, 131802 (2003);
H.T. Wong et al., Phys. Rev. D 75, 012001 (2007).
[6] J.F. Ziegler, Transport of Ions in Matter, http://www.srim.org (1998).
[7] J. Lindhard et al., Dan. Vid. Mat.-Fys, Medd. 33, 10 (1963).
[8] S. Yellin, Phys. Rev. D 66, 032005 (2002).
[9] For example, among many others, G. Angloher et al., As- tropart. Phys. 18, 43 (2002).
Compilation of
measurements of the
quenching factor Q
in germanium
Detector response model
.
✓ event rate
◆
=
✓ detector response
◆
⇥
✓ particle physics
◆
⇥ (astrophysics)
Compilation of measurements of the light efficiency factor L
effin liquid xenon
Aprile et al (XENON100), 1104.2549
2 tion light (S1) and ionization electrons, the latter being
detected through the process of proportional scintilla- tion (S2) in the gaseous xenon above the liquid. Both S1 and S2 signals are registered by photomultiplier tubes (PMTs), at the bottom of the LXe target for optimal light collection, and placed above in the gas phase. The interaction vertex is reconstructed in 3 dimensions, with the (x, y)-position determined from the hit pattern of the localized S2 signal on the top PMT array, and the z- coordinate deduced from the drift time between the S1 and S2 signals. This allows to fiducialize the target vol- ume to exploit the excellent self-shielding capabilities of LXe. Due to their di↵erent ionization densities, ERs ( , background) and NRs (WIMP signal or neutron back- ground) have a di↵erent S2/S1 ratio, which is used as discrimination parameter.
The 242 PMTs used in XENON100 are 100-square Hamamatsu R8520-AL PMTs with a quantum efficiency of ⇠30% at the Xe light wavelength of 178 nm, and low intrinsic radioactivity [8]. The measured average energy threshold of the LXe veto is ⇠ 100 keVee.
The TPC is installed inside a vacuum insulated stain- less steel cryostat which is surrounded by a passive shield made of high purity copper, polyethylene, lead and water in order to suppress external backgrounds. A constant flow of high-purity nitrogen boil-o↵ gas keeps the 222Rn level inside the shield < 1 Bq/m3. A 200 W pulse tube refrigerator, installed outside the shield structure, keeps the detector at its operating temperature of 91 C, with excellent stability over time (fluctuations <0.05%). To bring calibration sources (60Co, 137Cs, 241AmBe) close to the target, a copper tube penetrates the shield and winds around the cryostat. XENON100 is installed un- derground at the Italian Laboratori Nazionali del Gran Sasso (LNGS) below an average 3600 m water equivalent rock overburden, which reduces the muon flux by a fac- tor ⇠ 106.
At low energies, the event trigger is provided by the S2 signal. The summed signal of 84 central PMTs is shaped and fed into a low-threshold discriminator. The trigger efficiency has been measured to be > 99% at 300 photo- electrons (PE) in S2.
Three algorithms are used to reconstruct the (x, y) co- ordinates of the events. They yield consistent results out to a radius of 14.2 cm, with the active TPC radius be- ing 15.3 cm. The (x, y) resolution was measured with a collimated source and is <3 mm (1 ). The algorithm based on a Neural Network gives the most homogeneous response and thus is used for event positioning, while the information from the other algorithms is used for consistency checks. The drift time measurement gives a z-position resolution of 0.3 mm (1 ) and allows to dis- tinguish two S2 interaction vertices if separated by more than 3 mm in z. The positions are corrected for non- uniformities of the drift field, as inferred from a finite- element simulation and validated by data.
XENON100 uses continuous xenon purification through a hot getter. The mean electron lifetime ⌧e is indicative of the amount of charge lost to impurities [11].
It increased from 230 µs to 380 µs for the data reported here, as measured weekly with 137Cs calibrations. A linear fit to the ⌧e time evolution yields the z-correction for the S2 signals with negligible systematic uncer- tainty (< 2.5%). (x, y) variations of the S2 signal are corrected using a map obtained with the 662 keVee line from 137Cs.
The spatial dependence of the S1 signal due to the non-uniform light collection is corrected for using a map obtained with the 40 keVee line from neutrons scatter- ing inelastically on 129Xe. It agrees within 3% with maps inferred from data using the 662 keVee line and the 164 keVee line, from neutron-activated 131mXe. The light yield Ly(122 keVee) = (2.20 ± 0.09) PE/keVee at the ap- plied drift field of 530 V/cm in the LXe is determined by a fit to the light yields measured with all available calibration lines [7].
Energy [keVnr]
1 2 3 4 5 6 7 8 910 20 30 40 50 100
Leff
0 0.05 0.1 0.15 0.2 0.25 0.3 0.35
Energy [keVnr]
1 2 3 4 5 6 7 8 910 20 30 40 50 100
Leff
0 0.05 0.1 0.15 0.2 0.25 0.3
0.35 Arneodo 2000 Bernabei 2001 Akimov 2002 Aprile 2005 Chepel 2006 Aprile 2009 Manzur 2010 Plante 2011
FIG. 1: All direct measurements of Le↵ [12, 13] described by a Gaussian distribution to obtain the mean (solid line) and the uncertainty band (shaded blue, 1 and 2 ). Below 3 keVnr, where no direct measurements exist, the trend is logarithmi- cally extrapolated to Le↵ = 0 at 1 keVnr.
The NR energy Enr is inferred from the S1 signal us- ing Enr = (S1/Ly)(1/Le↵)(See/Snr). The scintillation ef- ficiency Le↵ of NRs relative to the one of 122 keVee - rays at zero field is taken as the parametrization shown in Fig. 1, which is strongly supported by measurements from the Columbia group [12] but includes all direct mea- surements of this quantity [13]. Le↵ is logarithmically ex- trapolated below the lowest measured energy of 3 keVnr. The electric field scintillation quenching factors for ERs See = 0.58 and NRs Snr = 0.95 are taken from [14].
From a comparison of the measured background rate with Monte Carlo simulations of the XENON100 elec- tromagnetic background [10], a natKr concentration of (700 ± 100) ppt is inferred for the data reported here, higher than in the 11 days data reported earlier [7].
The additional Kr was introduced by an air leak dur- ing maintenance work on the gas re-circulation pump, prior to the start of the data-taking period. This results in an expected ER background of < 22 ⇥
Q = (S
nr/S
ee)L
e↵New preliminary measurements by LUX down to 2 keVnr
Particle physics model
WIMP-nucleus cross section:
spin-independent, spin-dependent, electric, magnetic, ...
What force couples dark matter to nuclei?
Coupling to nucleon number density, nucleon spin density, ...
WIMP speed
WIMP mass Nucleus recoil energy
.
✓ event rate
◆
=
✓ detector response
◆
⇥
✓ particle physics
◆
⇥ (astrophysics)
.
✓ particle physics
◆
= v
2m
d
dE
Rχ χ
p p
2fp
χ χ
2fn
n

![FIG. 3: A compilation of all quenching factor (QF) mea- mea-surements on germanium, with calculations from the TRIM software [6] as well as by the Lindhard model [7] under two parametrizations (k=0.20 and 0.15) overlaid.](https://thumb-us.123doks.com/thumbv2/123dok_es/12496642.0/24.1200.84.794.97.860/compilation-quenching-surements-germanium-calculations-software-lindhard-parametrizations.webp)
![FIG. 1: All direct measurements of L e↵ [12, 13] described by a Gaussian distribution to obtain the mean (solid line) and the uncertainty band (shaded blue, 1 and 2 )](https://thumb-us.123doks.com/thumbv2/123dok_es/12496642.0/25.1200.106.1160.131.843/direct-measurements-described-gaussian-distribution-obtain-uncertainty-shaded.webp)