THE EFFECTS OF CORPORATE SOCIAL RESPONSIBILITY PERCEPTIONS ON THE VALUATION OF COMMON STOCK
WAYMOND RODGERS HELEN CHOY
ANDRES GUIRAL-CONTRERAS
FUNDACIÓN DE LAS CAJAS DE AHORROS DOCUMENTO DE TRABAJO
Nº 313/2007
De conformidad con la base quinta de la convocatoria del Programa de Estímulo a la Investigación, este trabajo ha sido sometido a eva- luación externa anónima de especialistas cualificados a fin de con- trastar su nivel técnico.
ISBN: 84-89116-07-5
La serie DOCUMENTOS DE TRABAJO incluye avances y resultados de investigaciones dentro de los pro- gramas de la Fundación de las Cajas de Ahorros.
Las opiniones son responsabilidad de los autores.
WAYMOND RODGERS
A. Gary Anderson Graduate School of Management University of California, Riverside, CA 92521
Office phone: (951) 827-2486 Mobile: (949) 300 77 66
Fax: (951) 827-3970 e-mail: [email protected]
HELEN CHOY
A. Gary Anderson Graduate School of Management University of California, Riverside, CA 92521
Office phone: (951) 827-2333 Fax: (951) 827-3970 e-mail: [email protected]
ANDRES GUIRAL-CONTRERAS School of Management University of Alcala, Spain, 28880
Office phone: (34) 91 885-4282 Fax: (34) 91 885-4282 e-mail: [email protected]
November 2006
* Financial support for this research was provided by the Ministry of Education and Culture of Spain (research project SEJ2004-00791ECON, SEJ2006-14021 and postdoctoral grant EX2004-0294).
THE EFFECTS OF CORPORATE SOCIAL RESPONSIBILITY PERCEPTIONS ON THE VALUATION OF COMMON STOCK
Abstract
We examine effects of intangible assets on financial viability and social perceptions on the market valuation of firms. The concepts of corporate financial performance (CFP) and corporate social
performance (CSP) are introduced to account for variation and differences in financial viability, which in turn has an important impact on market to-book of assets. The results, using a sample of the top 100 corporate citizens as complied by KLD Research and Analytics, indicate that the relationship of intangible assets to total assets influences firms’ viability. The results also show that social perceptions have a significant impact on firms’ market valuations.
Introduction
Most attention to the ethical1 dimension of management has been devoted to a philosophical
perspective, focusing on the question of how leaders ought to behave (Brown et al. 2005, p. 17). Further, engagement between managers and stakeholders has become an important theme in corporate
environmental management literature and practice (De Bruijn and Tukker 2002). The literature on stakeholders’ engagement by firms gives little consideration to the influence of stakeholders affect on the market valuation of a firm from a modeling perspective. This paper seeks to address these omissions, examining how and why stakeholders influence market valuation by drawing on a sample of select firms viewed as being corporate responsible citizens.
One way to examine ethical and social responsible organizations over a number of years is to examine its corporate financial performance (CFP) in relationship with corporate social performance (CSP) information. CSP is defined as a voluntary business action that produces social (third party) effects (Schuler and Cording 2006). The interest in this reflection of moral and value system as drivers in
organizations along with CFP is viewed along with today’s rapid growth of sustainable investment (Winnett and Lewis 2000). For example, at least over one trillion in assets are under management in the United States in social and environmentally responsible portfolios (Ethical Investor Newsletter 2001).
Gardberg and Fombrun (2006) indicated that CSP activities are due to an altruistic or instrumental standpoint for the possible benefit to companies. Schuler and Cording (2006) advocated that in order for markets to exhibit some degree of control over CSP, information must be available to stakeholders about the organization’s social practices. Schuler and Cording (2006, p. 556) further stated, “to fully explain the link between CSP and CFP, the decision-making processes of stakeholders must also be illuminated”.
1 Morality or ethics is defined as a set of standards by which humans regulate their behavior in order to achieve the purpose of life. One component of ethical decision making is the actual moral judgment, where the final
determination of right and wrong is made. Everyone makes moral judgments about the goodness and badness of people, the rightness and wrongness of behaviors, and the rights and duties of members of groups. The significant question to be thought of is “Which kinds of behavior are moral or immoral?”.
This research article seeks to use a decision making model in order to depict CSP information as drivers of common stock valuation. Some have argued that although many act unethically because they intend to, others simply do not recognize the moral aspects of the situations in which they are involved and thus do not initiate the moral decision making process (Reynolds 2006, p. 233). Such explanations have been applied to some of the great ethical scandals of our time, including Enron, Worldcom, Tyco, Parmalat, and Ahold (Currall and Epstein 2003, Flowerday and von Solms 2005, Lev 2002) and “imply that by improving managerial moral awareness, future ethical catastrophe can be avoided” (Reynolds 2006, p. 233).
Ethical and social responsible investments (such as “green”, environmental and sustainable mutual funds) are not a new phenomenon; social changes in society due to considerations of applied ethics can be traced over time for thousands of years. The assumption is that ethical, social and environmental
responsible investments will have a more probable influence on individuals’ and organizations’ ethical behavior than what governments’ regulations will have. One explanation for this is a bi-assumption that
“money will talk more effectively”. These beliefs tend to be held by those who argue that ethical and social responsible investments are effective in some sense that goes beyond individual conscience salving (Winnett and Lewis 2000).
Previous studies have suggested that CSP appears to be more highly correlated with accounting-based measures of CFP than with market-based indicators, and CSP reputation indices are more highly
correlated with CFP than are other indicators of CSP (Orlitzky et al. 2003), or that CSP and CFP are inconclusive (McWilliams and Siegal 2001). Our research extends previous work by examining how CSP and CSF are linked in a two stage decision making model. That is, by providing a process approach, we are able to look inside the “black box” in order to determine if CSP and CSF affects both the
intermediary stage and final stage of market valuation of stock. First, this approach advances the literature in that where previous studies indicated conflicting results; this may have been due to different stages of
influence for CSP and CSF information. Second, matching a conceptual model with a covariance
structural model could provide new insights regarding the importance of the interactions of CSP and CSF.
Our study of the top 100 corporate citizens complied by KLD Research and Analytics
(http://www.business-ethics.com) provides important evidence that the relationship between CSP and market-to-book of assets may not be mediated by financial viability that reflects profitability, liquidity and leverage measures, but CSP has a direct impact on market value. We hope that this manuscript motivates research that explores the interactions between CSP and CFP. The next section explains the decision making model used to capture the impact of financial information and corporate social responsibility perceptions on judgments and decisions.
DECISION MAKING MODEL
Much has been debated in terms of whether firms should orient themselves toward a shareholder or stakeholder perspective (Sundaram and Inkpen 2004). The aim of our paper strives to identify if managers and stakeholders identify a common core value such as CSP as it is related to the market valuation of a firm’s stock (Freeman and McVea 2001). Although Mitchell et al. (1997) reviewed the literature and developed a list of 27 different definitions of stakeholders, we hope to draw some coherence in the literature by identifying the ethical and social responsibility dimension as a significant component to the stakeholder literature (De Bruijn and Tukker 2002).
We present a theoretical model that attempts to clarify the multiple ways in which intangible assets and social perceptions can increase or decrease firms’ value. This Throughput Model (Rodgers 1997) captures different pathways and stages that can influence a decision at the individual or organizational level. The model proposed here also provides a broad conceptual framework for examining interrelated processes that impact on decisions effecting organizations (Figure 1). It incorporates the constructs of perception, available information, judgmental processing (analysis of information/perception), and
decision choice as it applies to individuals/organizations (Rodgers 1997). We believe that our analysis can support or disconfirm two broad of “stakeholder contract costs theory” and “good management theory.”
The stakeholder contract costs theory assumes that the benefits of CSP outweigh the costs, whereby stakeholders exercise some social control over a firm (Waddock and Graves 1997). Hence, companies provide resources on CSP activities leading to CSP contributing to CFP. Good management theory implies that managerial skills and strategies are needed for good financial performance (Waddock and Graves 1997). Hence CFP results from CSP. Our model can be tested to determine whether the data support or not support the stakeholder contract costs theory or good management theory.
The central insight of the decision-making model is that CSP information inputs are embedded in a social contract. This insight we depict as “perception” in our model. Judgment (financial viability), the second stage, involves a more detailed analysis of CFP and CSP. Decision choice is the final stage of processing. This stage represents a culmination of information, perception and judgment (see Figure 1).
Information includes the set of financial and non-financial information for reporting purposes by firms. In this model, profitability, liquidity, leverage and intangible information (I) as well as social perception (P), measured by customer, employee and community relations, affects financial viability judgment (J). Intangible information is included in our model since firms report on assets that have been purchased (e.g., brand names, copyrights, patents etc.). However, we claim that this information differs from CSP information since the current accounting rules do not require firms to report CSP (Rodgers 2003).
The judgment stage contains the process firms implement to analyze incoming information (financial and non-financial), as well as the influence from the perception stage (i.e., social perceptions).
The direct path from social perception to judgment implies that CSP contributes to CFP, thereby providing credence to the stakeholder contract costs theory.
Finally, the decision choice stage reflects the market valuation of a firm. Social perception and judgment can affect decision choice (D) of common stock valuation. Social perceptions’ direct influence on decision choice (market-to-book of assets) is an indication that CFP results from CSP. That is, CSP can influence market valuation of common stock.
HYPOTHESES DEVELOPMENT Financial viability and intangibles
Financial profitability and other financial measures provide useful CFP information on a firm’s short-term performance. In evaluating a firm’s long-term performance, however, other non-financial data can provide incremental information. In this paper, we propose a model in which, in addition to financial performance, other information can be valuable in evaluating and predicting a firm’s long-term
performance (see Figure 2). In this model, both the firm’s financial viability and investors’ CSP
perception of the firm’s commitment to meet its social responsibility play a significant role in determining the firm’s market value. Financial viability of a firm is reflected by traditional financial measures such as profitability, liquidity and leverage. However, as argued in prior studies (Amir and Lev 1996, Lev and Sarowin 1999, Demers and Lev 2001, Trueman et al. 2000), financial reports of firms, high-tech firms in particular, reflect a firm’s value with distortion. Investors realize such a distortion and incorporate other non-financial information when they evaluate the value of a firm. In other words, these prior studies suggest that non-financial information is an important determinant of a firm’s market value.
One non-financial information that has widely been identified as “value-relevant” is the intensity of research and development. Current accounting standards (GAAP) require firms to write their
investment in research and development off as expenses. Only a limited number of intellectual properties can be recognized as assets on a firm’s balance sheet (e.g., software). Consequently, the product of these
research activities cannot be recognized as assets on the balance sheet even when they generate revenues for the firm. In other words, assets of firms with intense research and development activities are
understated. Chan, Martin and Kensinger (1990), Shortridge (2004), Joos (2002), Jennings, Robinson, Thompson, and Duvall (1996) and Liu (2006) document that market does incorporate the value of
research and development and other intangibles, such as goodwill, in their valuation models. This relation is depicted by our model predicting that intangible assets have an impact on firm’s financial viability:
Hypothesis 1. A firm’s financial viability depends on the portion of total assets that is intangible.
However, are these intangible assets the only value-relevant information missing from the financial statements? Are there any other assets contributing to a firm’s market valuation but are not recognized by accounting standards as well? In this paper, we examine the effect of these other
“intangible assets”—employee, customer, and community relations—on a firm’s value. To this end, our model conceptualizes that, in addition to the financial viability of a firm, investors incorporate their perception of the firm’s commitment to meet corporate responsibility in their valuation decisions.
Employee, Customer and Community Relations
With the significant growth in high-tech firms, the competition for talents in the labor market has been more intense than ever (Collins and Smith 2006, Ballou et al. 2003). Firms use various long-term compensation schemes, such as stock options and restricted stock grants with several years of vesting period, to retain their employees. Still other firms tried more innovative ways to attract employees. The enormous spending on employee stock options, restricted stocks, and other employee compensation indicates the importance of human resource. Also, from a list of top 100 employers to work for
constructed by Fortune magazine every year, we can learn the extra mile firms are willing to go to ensure their employees are satisfied. Wegmans Food Markets, who topped the 2005 list, states its motto as
“Employees first, customers second”. With such a corporate belief, this retailer was able to keep its annual turnover rate (6%) three times lower than other grocery stores with similar size (19%). Microsoft also made the list because of its generosity towards employee compensation, medical benefits, and the
matching for employee charitable donations. Proctor and Gamble was one of the most innovative in that it paired up senior manager (mostly male) with junior female employees in order for the senior manager to understand issues these junior employees face. All these examples demonstrate the importance of employee satisfaction.
Human resource is an important determinant of a firm’s productivity, profitability, and its long- term survival. Unfortunately, this important “asset” of a firm is not recorded anywhere on a firm’s balance sheet. However, with its significant impact on a firm’s long-term well-being, we anticipate investors account for this employee satisfaction factor in their investment decision and the market incorporates this human resource factor into its pricing of a firm.
In addition to happy employees, it is equally important that a firm’s customers are satisfied with its products and/or services (Luo and Bhattacharya 2006, Maiga and Jacobs 2005). Companies spent millions and millions of dollars to improve their products/services, cater for the needs of customers, and advertise to promote their products to customers. Moreover, they set up customer relations department to cultivate and maintain a long-term relationship with customers. A well-maintained customer relation helps to retain old customers for repetitive businesses, build up customer loyalty, and attract new businesses by the word of mouth. The costs of keeping existing customers are likely to be lower than those of acquiring new customers (Voss and Gruber 2005). Retention of existing customers is particularly important for a company operating in a mature industry (Reichheld 2003). A satisfied customer will come back and purchase goods or services in the future, generating revenues in the long run. These loyal customers will also recommend the product or service to their friends. This saves the firm’s expenditure on marketing. This word-of-mouth type of promotion can be particularly beneficial for firms in mature industries because the large marketing costs of acquiring new customers through advertising and other promotions can make the firm hard to grow profitably (Reichheld 2003).
While these customer-relation efforts have both short- and long-term benefits, only the short-term benefits are recognized as sales on financial statements. On the other hand, all such costs incurred in
improving and promoting the products in the current period are recorded as expenses on the income statement. Without accounting for the customer relation or brand name on the financial reports, these financial statements again understate the “assets” of a firm. If the market realizes the value of brand name and/or customer relation to a firm, investors will incorporate this information in their pricing.
Besides improving relation with current employees and customers, it also helps a company to cultivate its relation with potential employees and customers. One way to achieve this is to have a good community relation. Maintaining a good community relation promotes the image of a company. A good company image contributes to a good brand name. For example, Ford Motor was selected Latina Style magazine’s 2004 Fifty Best Companies based on, among other criteria, its mentoring program and its relationship with the Hispanic community
(http://media.ford.com/newsroom/feature_display.cfm?release=20131). This publicity provides Ford an alternative way to reach customers, employees, and other constituents, in addition to the traditional advertising campaign. By actively participating in community programs, either through charitable donation, sponsorship, and/or setting up policies to encourage employees to volunteer, firms can promote their brand name. We expect this long-term relationship with the community improves investors’
perception of the company and likely leads to an increase in its market value. These arguments lead us to our second hypothesis:
Hypothesis 2. In addition to the financial viability of a firm, investors incorporate their
perception of the firm’s efforts to improve their employee, customer, and community relations in their valuation of the firm.
METHODS
In order to test these hypotheses, we use the employee and customer satisfaction, and community relation indices provided on Business-ethics.com (http://www.business-ethics.com). Each year, the website generates a list of top 100 corporate citizens based on data provided by KLD Research and
Analytics. Business-ethics.com started generating the list in year 2000. The list is constructed based on the points a firm scores in the welfare measures of four stakeholder groups: the customer, employee, community, and stockholders. Over the years, the criteria have gradually expanded to include the welfare of seven stakeholders. However, in order to provide a consistent comparison over years, we include only the initial four stakeholder groups in our analyses. Our sample is composed of 233 observations between 2000 and 2003.
For each stakeholder group, KLD Research and Analytics identified the strengths and concerns of a firm in that area. The number of concerns was then subtracted from the number of strengths to arrive at a net score. This net score was then standardized by the mean net score of each stakeholder category. That is, KLD used the number of standard deviations a firm’s scores was from the mean of each stakeholder category as a measure of the firm’s points received in that category. An overall score for a firm is then computed using the unweighted average of points received in all stakeholder categories. This constitutes the overall social responsibility standing of a firm.
For the customer category, KLD examines whether the firm has a quality management program and its quality, any quality awards the firm has won, customer satisfaction measure, any customer lawsuit pending, etc. In the employee relation category, KLD considers, among other criteria, employees’ wages relative to the industry, benefits, employee empowerment, family-friendly policies, and other policies the firm has in place to accommodate employees’ needs. The factors considered in the community relation category includes whether the company has any foundation, community service projects, employee volunteer programs, etc.
We took the scores a firm receives in the customer, employee, and community categories from the website and rank them relative to other firms that made the top 100 list in the year. We use the relative ranking in each category as a proxy for the quality of its customer, employee, and community relations. In addition, we use the overall social responsibility score a firm receives as a proxy for the general
perception investors have regarding the firm or the image a firm projects to the general public.
Besides the non-financial measures, we include a firm’s financial viability in our analyses. This provides us with a benchmark on how much the non-financial measures contribute to the overall market value of a firm relative to the financial viability. We retrieve the financial data required for the
computation of a firm’s financial viability from Compustat. We use the Zmijewski score (Zmijewski 1984) as a proxy for the financial viability2. This financial viability score measures a firm’s probability of going bankrupt. The higher the score, the higher the probability of a firm going bankrupt is. The score is constructed based on a firm’s profitability, liquidity, and leverage ratios as follows:
ZFC = -4.336 – 4.513 (ROA) + 5.679 (FINL) + 0.004 (LIQ)
where ROA is the return on assets, FINL is the financial leverage, and LIQ is the liquidity measure.
In addition to these traditional measures of a firm’s financial healthiness, we incorporate a firm’s intangible asset in our analysis of a firm’s financial viability. The growing importance of intellectual properties in firms indicates that these intangible assets play a critical role in a firm’s success. As documented in prior studies, investors do account for the intangibles in their valuation of a firm.
However, most prior studies document the effect of research and development, an intangible unrecorded on financial statements. In this study, we investigate the effect, if any, of intangibles that are already recorded as assets on a firm’s financial viability. Given two firms with the same profitability, leverage, and liquidity levels, will they have different financial viability if intangibles constitute a larger portion of one firm’s assets than that of another firm?
We use the goodwill to total assets and intangibles to total assets as measures of the portion of a firm’s assets that is intangible. We then examine what effect these intangibles, if any, has on the financial viability of a firm and the portion of financial viability attributed to the intangibles versus that attributed to the profitability, liquidity and leverage ratios. We use the return on assets (ratio of net income to total assets) and the net income to sales ratio to measure a firm’s profitability. A firm’s liquidity is again
2 Numerous accounting studies have used Zmijewski score for the recognition of financial distressed firms (e.g., Ruiz-Barbadillo et al. 2004, Johnstone and Bedard 2004, Carcello and Nagy 2004).
measured by two indicators: the quick ratio (the ratio of sum of cash, marketable securities, and
receivables to current liabilities) and the ratio of current assets to current liabilities. Leverage is measured by the ratio of total debt to total assets and the ratio of long-term debt to total assets. Finally, the market’s valuation of a firm is measured by the market-to-book of assets.
RESULTS
We used Partial Least Squares (PLS) to analyze our research model depicted in Figure 1. PLS is a latent structural equation modeling technique that allows the researcher to test the relationship within the measures (the measurement model) and the hypothesized relationship among the measures (the structural model) simultaneously (Lohmoller 1989, Wold 1982). It is particularly useful for studying structural models involving multiple latent constructs with multiple indicators.
There are three main advantages of PLS. First, unlike other structural equation models (LISREL, AMOS, EQS, etc.), the assumptions underlying PLS are less stringent (Fornell and Bookstein 1982, Lohmoller 1989, Chin et al. 2003). PLS imposes minimal restrictions on measurement scales, sample size, and residual distributions. That is, since regression coefficients are estimated iteratively in PLS, sample size is normally not a problem. Second, PLS has superior ability to handle causal-predictive analysis in situations of high complexity but low theoretical underpinnings. PLS uses a principal-
component model in which no random error variance or measure-specific variance (i.e., unique variance) is assumed. Parameters are estimated in a manner that maximizes the amount of explained variance in a set of observed measures. Goodness of fit is evaluated on the basis of the percentage of variance explained in the specific regression. Because the PLS approach estimates the latent variables as exact linear combinations of the observed measures, it offers the advantage of exact definition of component scores. Third, PLS can handle and test complex constructs with both reflective and formative factors (Chin 1998). In Figure 1, “profitability”, “liquidity”, “leverage”, “intangibles”, and “social responsibility information” are latent constructs measured by formative indicators of our research model; whereas
“viability”, “social perception”, and “market value” are measured by reflective factors.
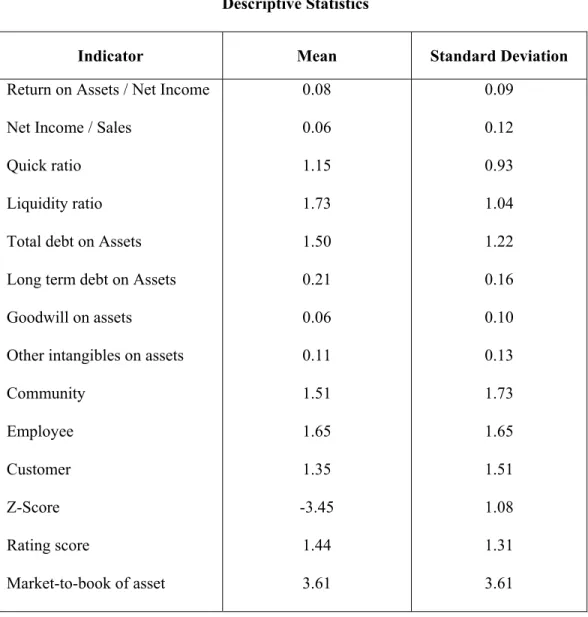
In PLS, loadings of measures of each construct can be interpreted as loadings in a principal components factor analysis. Paths between latent constructs can be interpreted as standardized beta weights in a regression analysis. Because PLS does not make distributional assumptions, traditional parametric procedures of significance testing are not appropriate. Thus, we use bootstrapping resampling procedures to estimate factor loadings and path coefficients in the model (Chin 1998). Table 1
summarizes descriptive statistics for indicators.
Measurement Validation
Our model was estimated using the computer program PLS-Graph version 3.00. The
measurement model evaluates the relationship between indicators and latent constructs by assessing the reliability and validity of the scales measures. Each measure’s reliability is assessed by examining the loading of the indicators on the corresponding construct. All measures have a loading level above 0.70, except for one measure of “leverage” that has a loading of 0.65 (see Table 2). In addition, measurement residuals are small. All loadings have the expected signs (i.e., non-negative) and are statically significant at the 0.001 level (one-tailed). Further, all constructs present a composite reliability (see, Fornell and Larcker 1981) above 0.70, the benchmark level suggested by Nunnally (1978).
Also, convergent and discriminant validity can be evaluated within the PLS model. According to Chin (1998), convergent and discriminant validity is inferred when the PLS indicators (1) load much higher on their hypothesized factor than on other factors (i.e. own-loadings are higher than cross- loadings), and (2) when the square root of each construct’s Average Variance Extracted (AVE) is larger than its correlations with other constructs (the average variance shared between the construct and its indicators is larger than the variance shared between the construct and other constructs).
To test the first condition, the CFA procedure in PLS was performed. That is, an examination of measure loadings on constructs correlations. The correlation matrix in Table 3 shows that no indicator
loads more highly on another construct than it does on the latent construct it is intended to measure.
Convergent validity of a construct is measured by the ratio of the variance of its indicators captured by the construct to the total amount of variance (“average variance extracted” ovc). The total amount of variance includes the variance due to measurement error. As a rule of thumb, a ratio of less than 0.50 implies the convergent validity assumption is violated because more variance is explained by the error than the construct. In our model, average variance extracted (ovc) ranges between 0.65 and 1.00, indicating satisfactory convergent validity for the constructs.
Satisfactory discriminant validity among constructs is obtained when the squared correlation between any two constructs is statistically less than the ovc. This implies that the variance shared between any two constructs is less than the variance shared between a construct and its indicators (see Fornell and Larcker 1981). The low and moderate average squared correlations among constructs in Table 2 show that our model also satisfies the condition for discriminant validity. Another meaningful indicator of the fit of the model with respect to its measurement is the overall communality coefficient (in our model 0.81). This exceeds Falk’s (1987) recommendation that this coefficient should be greater than 0.30.Thus, it can be concluded that the constructs are measured with sufficient precision, that is, the model is both reliable and valid.
The Structural Model
The PLS path coefficients are shown in Figure 2. Consistent with our expectation, companies with high financial viability (i.e. low Zmijewski score) are more profitable (p < .001; R2 = .339), more liquid (p < .001; R2 = .200), and less leveraged (p < .001; R2 = .839) firms. Further, the proportion of intangible assets has a significantly positive impact on the financial viability (p < .001; R2 = .097) latent construct, supporting Hypothesis 1. This result suggests that the larger the portion of total assets that is made up of intangibles, the more susceptible the firm is to bankruptcy, as measured by Zmijewski score.
This result seems to contradict results in prior studies that document a positive effect of unrecorded
intangibles (e.g. research and development) on a firm’s profitability. One potential explanation is that firms with large recorded intangible assets are also those with large unrecorded intangible assets. As Zmijewski score assesses a firm’s bankruptcy probability based on a firms recorded assets and liability, it is likely that these firms with significant unrecorded intangible assets receive high Zmijewski score (i.e.
high bankruptcy probability). Consistent with the results in previous research, the financial viability latent variable has a significantly negative effect on the market value of companies (p < .001). In other words, companies with lower financial distress are those with higher market value.
A firm’s efforts in meeting the needs of its various stakeholders—employees, customers, and the community—has a significant influence on the market’s perception of the firm’s commitment to meet its social responsibility (p < .001; R2 = .909), which in turn, has a significantly positive effect on the firm’s market value (p < .001; R2 = .306). This supports our Hypothesis 2. On the other hand, the social
perception does not have any significant effect on a firm’s financial viability. Thus, the social perception of a firm’s commitment to meet corporate responsibility contributes directly to the firm’s market value, rather than affecting it indirectly via the financial status of the firm.
CONCLUSION, LIMITATIONS AND FUTURE RESEARCH
The decision model used in this study implies that intangible assets (CSP) influencing financial viability (CFP) depict stakeholder contract costs theory. Further, our study indicates that social
perceptions (CSP) can have a direct impact on a firm’s market valuation implying those managerial skills and strategies are indirectly influencing financial performance (i.e., “good management theory”).
Therefore, the decision model helps identify the different aspects of the model that both theories are important in explaining the relationship between CFP and CSP.
In addition, the results of our study support the notion that firms’ viability is dependent on its relationship of intangible assets to total assets. Whereas, previous studies have emphasized that
unrecorded intangibles have a positive effect on firms’ profitability, we believe that additional research
should be conducted in order to test whether firms with large recorded intangible assets are also those with large unrecorded intangible assets as related to bankruptcy measures.
Another major finding in this study underscored the view that social perceptions are influential in determining market valuation of firms. That is, future research may uncover other relationships with other important market factors along with social perceptions in a model setting.
A limitation of this study involves the tenuous relationship between CSP and CFP due to their measurements, as well as the sample used in this study (Griffin and Mahon 1997). In sum, to endure and build long-term value for shareholders, firms must also do well by society. Issues of firms’ sustainability lie in synergies with customers, employees, and the community as well as how the firm integrates with the community in a global context. Social responsibility and community relations could be important to firms’ growth and profitability; however, much work is needed in terms of how to measure and report intangible assets. Overall, our results suggest that taking into account a firm's broader societal strategies leads to a material shift in value when compared to standard financial analysis. Therefore, if social perceptions are unincorporated in financial reporting, then there is value at stake for firms that understand these issues and can adapt them to their own businesses.
References
Amir, E., B. Lev, 1996. Value-relevance of nonfinancial information: The wireless communications industry. J. Account. Econ. 22(1/3) 3-30.
Ballou, B., N. H. Godwin, R. B. Shortridge, 2003. Firm value and employee attitudes on workplace quality. Account. Horizons, 17(4) 329-341.
Brown, M. E., L. K. Treviño, D. A. Harrison, 2005. Ethical leadership: A socio learning perspective for construct development and testing. Organ. Behav. Hum. Dec. 97 117-134.
Carcello, J. V., A. L. Nagy, 2004. Audit firm tenure and fraudulent financial reporting. Auditing- J. Pract.
Th. 23(2) 57-71.
Chan, S. H., J. D. Martin, J. W. Kensinger, 1990. Corporate research and development expenditures and share value. J. Financ. Econ. 26(2) 255-276.
Chin, W. W. 1998. Issues and opinion on structural equation modeling. MIS Quart. 22 7-16.
Chin, W. W., B. L. Marcolin, P. R. Newsted, 2003. A partial least squares latent variable modeling approach for measuring interaction effects: Results from a Monte Carlo simulation study and an electronic mail emotion/adoption study. Inform. Syst. Res. 14: 189-217.
Collins, C. J., K. G. Smith, 2006. Knowledge exchange and combination: The role of human resource practices in the performance of high-technology firms. Acad. Management J. 49(3) 544-560.
Currall, S. C., M. J. Epstein, 2003. The Fragility of Organizational Trust: Lessons From the Rise and Fall of Enron. Organ. Dyn. 32(2) 193-206.
De Bruijn, T., A. Tukker, 2002. Partnership and leadership: Building alliances for a sustainable future.
Dordrecht, Kluwer.
Demers, E., B. Lev, 2001. A rude awakening: Internet shakeout in 2000. Rev. Account. Stud. 6 (2-3) 331- 359.
Ethical Investor Newsletter, 2001. 41: 10-16 (September). http://www.ethicalinvestor.com.au/default.asp.
Falk, R. F. 1987. A primer for soft modeling. University of California Institute of Human Development, Berkeley.
Flowerday, S., R. von Solms, 2005. Real-time information integrity = system integrity + data integrity + continuous assurances. Comput. Security 24(8) 604-613.
Fornell, C., F. L. Bookstein, 1982. Two structural equation models: LISREL and PLS applied to consumer exit-voice theory. J. Marketing Res. 19(4) 440-452.
Fornell, C., D. F. Larcker, 1981. Evaluating structural equation models with unobservable variables and measurement error. J. Marketing Res. 18 39-50.
Freeman, R.E., J. McVea, 2001. A stakeholder approach to strategic management. M. Hitt, E. Freeman, J.
Harrison, eds. Handbook of Strategic Management. Blackwell Publishing, Oxford, U.K., 189-207.
Gardberg, N. A., C. J. Fombrun, 2006. Corporate citizenship: Creating intangible assets across institutional environments. Acad. Management Rev. 31 329-346.
Griffin, J. J., J. F. Mahon, 1997. The corporate social performance and corporate financial performance debat: Twenty-five years of incomparable research, Bus. Soc. 36(1) 5-31.
Jennings, R., J. Robinson, R. B. Thompson II, L. Duvall, 1996. The relation between accounting goodwill numbers and equity values. J. Bus. Financ. Account. 23(4) 513-533.
Joos, P. 2002. Explaining cross-sectional differences in market-to-book ratios in the pharmaceutical industry. Working Paper, University of Rochester.
Johnstone, K. M., J. C. Bedard, 2004. Audit firm portfolio management decisions. J. Accounting Res.
42(4) 659-690.
Lev, B., P. Sarowin, 1999. The boundaries of financial reporting and how to extend them. J. Accounting Res. 37(2) 353-385
Liu, Q. 2006. How good is good news? Technology depth, book-to-market ratio, and innovative events. J.
Accounting Auditing Financ. 21(3) 293-321.
Lohmoller, J. B. 1989. Latent Variable Path Modeling with Partial Least Squares. Springer-Verlag, New York.
Luo, X., C. B. Bhattacharya, 2006. Corporate social responsibility, customer satisfaction, and market value. J. Marketing 70(4) 1-18.
Maiga, A. S., F. A. Jacobs, 2005. Antecedents and consequences of quality performance. Behav. Res.
Account. 17 111-131.
McWilliams, A., D. Siegal, 2001. Corporate social responsibility: A theory of the firm perspective. Acad.
Management Rev. 26 117-127.
Mitchell, R.K., B.R. Agle, D.J. Wood, 1997. Toward a theory of stakeholder identification and influence:
Defining the principle of who and what really counts. Acad. Management Rev. 22 853-886.
Nunnally, J.C. 1978. Psychometric Theory. McGraw Hill, New York.
Orlitzky M., F. L. Schmidt, S. L. Rynes, 2003. Corporate social and financial performance: A met- analysis. Organ. Stud. 24 403-441.
Reichheld, F. 2003. The one number you need to grow. Harvard Bus. Rev. 81(12) 46-54.
Reynolds, S. J. 2006. Moral awareness and ethical predispositions: Investigating the role of individual differences in the recognition of moral issues. J. Appl. Psychol 91 233-243.
Rodgers, W. 1997. Throughput Modeling: Financial Information Used by Decision Makers. Greenwich, CT, JAI Press.
Rodgers W. 2003. Measurement and reporting of knowledge-based assets. J. Intellect. Capital 4 181-190.
Ruiz-Barbadillo, E., N. Gómez-Aguilar, C. Fuentes-Barberá, M. A. Garcí-Benau, 2004. Audit quality and the going-concern decision-making process: Spanish evidence. Eur. Account. Rev. 13(4) 597-620.
Schuler, D.A., M. Cording, 2006. A corporate social performance-corporate financial performance behavioral model for consumers. Acad. Management Rev. 3 540-558.
Shortridge, R.T. 2004. Market valuation of successful versus non-successful RandD efforts in the pharmaceutical industry. J. Bus. Financ. Account. 31(9-10) 1301-1325.
Sundaram, A. K., A. C. Inkpen, 2004. The corporate objective revisited. Organ. Sci. 15 350-363.
Trueman, B., T. J. Wong, X. J., Zhang, 2000. The eyeballs have it: Searching for the value in internet stocks. J. Accounting Res. 38(2) 137-162.
Voss, R., T. Gruber, 2005. Complaint handling at the Schindlerhof Hotel with praise and assessment cards. Management Services 49 16-19.
Waddock, S. A., S. B. Graves, 1997. The corporate social performance-financial performance link.
Strategic Management J. 18(4) 303-319.
Winnett, A., A. Lewis, 2000. You’d have to be to invest in this: Popular economic models, financial journalism, and ethical investment. J. Econom. Psychol. 21 319-339.
Wold, H. 1982. Soft modeling: the basic design and some extensions. K. G. Joreskog, H. Wold, eds.
Systems under Indirect Observation, vol. 2, North-Holland, Amsterdam, 1–54.
Zmijewski, M. E. 1984. Methodological issues related to the estimation of financial distress prediction models. J. Accounting Res. (Supplement) 59-82.
TABLE 1 Descriptive Statistics
Indicator Mean Standard Deviation
Return on Assets / Net Income Net Income / Sales
Quick ratio Liquidity ratio Total debt on Assets Long term debt on Assets Goodwill on assets
Other intangibles on assets Community
Employee Customer Z-Score Rating score
Market-to-book of asset
0.08 0.06 1.15 1.73 1.50 0.21 0.06 0.11 1.51 1.65 1.35 -3.45
1.44 3.61
0.09 0.12 0.93 1.04 1.22 0.16 0.10 0.13 1.73 1.65 1.51 1.08 1.31 3.61
TABLE 2
Measurement Model Parameter Estimates
Constructs and Indicators Loadings T-Statistic
Convergent Validity
(ovc)
Discriminant Validity*
Profitability
(Composite Reliability = 0.859) 0.75 0.11
Return on Assets / Net Income Net Income / Sales
0.98 0.73
71.32 10.65 Liquidity
(Composite Reliability = 0.983) 0.96 0.08
Quick ratio Liquidity ratio
0.98 0.99
29.12 28.57 Leverage
(Composite Reliability = 0.828) 0.71 0.19
Total debt on Assets Long term debt on Assets
0.66 0.99
14.45 1,801 Intangibles
(Composite Reliability = 0.788) 0.88 0.04
Goodwill on assets
Other intangibles on assets
0.77 0.99
6.95 40.98 Social Information
(Composite Reliability = 0.848) 0.65 0.14
Community Employee Customer
0.77 0.83 0.82
22.61 35.69 35.89 Financial Viability
(Composite Reliability = 1.000) 1.00 0.24
Z-Score 1.00 0.00
Social Perception 1.00 0.15
(Composite Reliability = 1.000)
Rating score 1.00 0.00
Investors’ decisions
(Composite Reliability = 1.000) 1.00 0.12
Market-to-book of asset 1.00 0.00
* The entry in each row is the average of the squared correlations of the particular construct with all other constructs.
Profitability Liquidity Leverage Intangibles Social
Information Viability Social Perception
Investors’
Decision
Return on Assets / Net Income 0.98*** 0.01 -0.20*** -0.10* 0.21*** -0.57*** 0.23*** 0.50***
Net Income / Sales 0.73*** -0.01 -0.10 -0.03 0.13** -0.42*** 0.16** 0.37***
Quick ratio 0.01 0.98*** -0.52*** -0.18*** -0.09 -0.43*** -0.07 0.20***
Liquidity ratio 0.01 0.98*** -0.52*** -0.22*** -0.06 -0.43*** -0.05 0.16**
Total debt on Assets -0.14** -0.57*** 0.65*** 0.27*** -0.01 0.60*** -0.01 -0.24***
Long term debt on Assets -0.21*** -0.53*** 0.99*** 0.31*** 0.02 0.91*** 0.01 -0.35***
Goodwill on assets -0.11* -0.08 0.23*** 0.77*** -0.09 0.23*** -0.13** -0.16**
Other intangibles on assets -0.11* -0.22*** 0.31*** 0.98*** -0.11* 0.30*** -0.13** -0.16**
Community 0.20*** -0.19*** 0.11* 0.06 0.76*** 0.01 0.73*** 0.11*
Employee 0.09 -0.02 -0.01 -0.20*** 0.82*** -0.04 0.78*** 0.14**
Customer 0.23*** 0.03 -0.05 -0.14** 0.82*** -0.13** 0.78*** 0.20***
Z-score -0.62*** -0.44*** 0.91*** 0.31*** -0.06 0.99*** -0.08 -0.50***
Rating score 0.24*** -0.06 0.01 -0.14** 0.95*** -0.08 1.00*** 0.26***
Market-to-book of asset 0.51*** 0.18*** -0.35*** -0.17*** 0.19*** -0.50*** 0.26*** 1.00***
*** Pearson correlation coefficient is significant at the 0.01 level (two-tailed). ** Pearson correlation coefficient is significant at the 0.05 level (two-tailed). * Pearson correlation coefficient is significant at the 0.10 level.
Profitability Liquidity Leverage Intangibles Social Information
Profitability 0.870 - - - -
Liquidity 0.015 0.983 - - -
Leverage -0.214 -0.531 0.846 - -
Intangibles -0.125 -0.206 0.314 0.938 -
Social Information 0.221 -0.083 0.023 -0.112 0.806
FIGURE 1
Decision Making Model
P
I
J D
where P = perception of corporate social responsibility (customer, employee and community relations), I =financial (profitability, liquidity and leverage) and non- financial information (intangibles), J = judgment (financial viability), and D = decision choice (valuation of common stock).
FIGURE 2
PLS results and Path Coefficients
Liquidity Information
R2=.200
Leverage Information
R2=.839
Decision Choice R2=.306 Financial
Viability R2=. 097
.224***
Social Perception
R2=.909 .953***
-.041
-.487***
-.582***
-.440***
.916***
.304***
Profitability Information R2=.339
Social Information
Intangibles Information
Liquidity Information
R2=.200
Leverage Information
R2=.839
Decision Choice R2=.306 Financial
Viability R2=. 097
.224***
Social Perception
R2=.909 .953***
-.041
-.487***
-.582***
-.440***
.916***
.304***
Profitability Information R2=.339
Social Information
Intangibles Information
DOCUMENTOS DE TRABAJO
Últimos números publicados
159/2000 Participación privada en la construcción y explotación de carreteras de peaje Ginés de Rus, Manuel Romero y Lourdes Trujillo
160/2000 Errores y posibles soluciones en la aplicación del Value at Risk Mariano González Sánchez
161/2000 Tax neutrality on saving assets. The spahish case before and after the tax reform Cristina Ruza y de Paz-Curbera
162/2000 Private rates of return to human capital in Spain: new evidence F. Barceinas, J. Oliver-Alonso, J.L. Raymond y J.L. Roig-Sabaté 163/2000 El control interno del riesgo. Una propuesta de sistema de límites
riesgo neutral
Mariano González Sánchez
164/2001 La evolución de las políticas de gasto de las Administraciones Públicas en los años 90 Alfonso Utrilla de la Hoz y Carmen Pérez Esparrells
165/2001 Bank cost efficiency and output specification Emili Tortosa-Ausina
166/2001 Recent trends in Spanish income distribution: A robust picture of falling income inequality Josep Oliver-Alonso, Xavier Ramos y José Luis Raymond-Bara
167/2001 Efectos redistributivos y sobre el bienestar social del tratamiento de las cargas familiares en el nuevo IRPF
Nuria Badenes Plá, Julio López Laborda, Jorge Onrubia Fernández
168/2001 The Effects of Bank Debt on Financial Structure of Small and Medium Firms in some Euro- pean Countries
Mónica Melle-Hernández
169/2001 La política de cohesión de la UE ampliada: la perspectiva de España Ismael Sanz Labrador
170/2002 Riesgo de liquidez de Mercado Mariano González Sánchez
171/2002 Los costes de administración para el afiliado en los sistemas de pensiones basados en cuentas de capitalización individual: medida y comparación internacional.
José Enrique Devesa Carpio, Rosa Rodríguez Barrera, Carlos Vidal Meliá
172/2002 La encuesta continua de presupuestos familiares (1985-1996): descripción, representatividad y propuestas de metodología para la explotación de la información de los ingresos y el gasto.
Llorenc Pou, Joaquín Alegre
173/2002 Modelos paramétricos y no paramétricos en problemas de concesión de tarjetas de credito.
Rosa Puertas, María Bonilla, Ignacio Olmeda
175/2003 La Administración tributaria en España. Un análisis de la gestión a través de los ingresos y de los gastos.
Juan de Dios Jiménez Aguilera, Pedro Enrique Barrilao González 176/2003 The Falling Share of Cash Payments in Spain.
Santiago Carbó Valverde, Rafael López del Paso, David B. Humphrey Publicado en “Moneda y Crédito” nº 217, pags. 167-189.
177/2003 Effects of ATMs and Electronic Payments on Banking Costs: The Spanish Case.
Santiago Carbó Valverde, Rafael López del Paso, David B. Humphrey
178/2003 Factors explaining the interest margin in the banking sectors of the European Union.
Joaquín Maudos y Juan Fernández Guevara
179/2003 Los planes de stock options para directivos y consejeros y su valoración por el mercado de valores en España.
Mónica Melle Hernández
180/2003 Ownership and Performance in Europe and US Banking – A comparison of Commercial, Co- operative & Savings Banks.
Yener Altunbas, Santiago Carbó y Phil Molyneux
181/2003 The Euro effect on the integration of the European stock markets.
Mónica Melle Hernández
182/2004 In search of complementarity in the innovation strategy: international R&D and external knowledge acquisition.
Bruno Cassiman, Reinhilde Veugelers
183/2004 Fijación de precios en el sector público: una aplicación para el servicio municipal de sumi- nistro de agua.
Mª Ángeles García Valiñas
184/2004 Estimación de la economía sumergida es España: un modelo estructural de variables latentes.
Ángel Alañón Pardo, Miguel Gómez de Antonio
185/2004 Causas políticas y consecuencias sociales de la corrupción.
Joan Oriol Prats Cabrera
186/2004 Loan bankers’ decisions and sensitivity to the audit report using the belief revision model.
Andrés Guiral Contreras and José A. Gonzalo Angulo
187/2004 El modelo de Black, Derman y Toy en la práctica. Aplicación al mercado español.
Marta Tolentino García-Abadillo y Antonio Díaz Pérez 188/2004 Does market competition make banks perform well?.
Mónica Melle
189/2004 Efficiency differences among banks: external, technical, internal, and managerial Santiago Carbó Valverde, David B. Humphrey y Rafael López del Paso
quicos bayesianos
F. J. Vázquez-Polo, M. A. Negrín, J. M. Cavasés, E. Sánchez y grupo RIRAG 191/2004 Environmental proactivity and business performance: an empirical analysis
Javier González-Benito y Óscar González-Benito
192/2004 Economic risk to beneficiaries in notional defined contribution accounts (NDCs) Carlos Vidal-Meliá, Inmaculada Domínguez-Fabian y José Enrique Devesa-Carpio
193/2004 Sources of efficiency gains in port reform: non parametric malmquist decomposition tfp in- dex for Mexico
Antonio Estache, Beatriz Tovar de la Fé y Lourdes Trujillo 194/2004 Persistencia de resultados en los fondos de inversión españoles
Alfredo Ciriaco Fernández y Rafael Santamaría Aquilué
195/2005 El modelo de revisión de creencias como aproximación psicológica a la formación del juicio del auditor sobre la gestión continuada
Andrés Guiral Contreras y Francisco Esteso Sánchez
196/2005 La nueva financiación sanitaria en España: descentralización y prospectiva David Cantarero Prieto
197/2005 A cointegration analysis of the Long-Run supply response of Spanish agriculture to the com- mon agricultural policy
José A. Mendez, Ricardo Mora y Carlos San Juan
198/2005 ¿Refleja la estructura temporal de los tipos de interés del mercado español preferencia por la li- quidez?
Magdalena Massot Perelló y Juan M. Nave
199/2005 Análisis de impacto de los Fondos Estructurales Europeos recibidos por una economía regional:
Un enfoque a través de Matrices de Contabilidad Social M. Carmen Lima y M. Alejandro Cardenete
200/2005 Does the development of non-cash payments affect monetary policy transmission?
Santiago Carbó Valverde y Rafael López del Paso
201/2005 Firm and time varying technical and allocative efficiency: an application for port cargo han- dling firms
Ana Rodríguez-Álvarez, Beatriz Tovar de la Fe y Lourdes Trujillo 202/2005 Contractual complexity in strategic alliances
Jeffrey J. Reuer y Africa Ariño
203/2005 Factores determinantes de la evolución del empleo en las empresas adquiridas por opa Nuria Alcalde Fradejas y Inés Pérez-Soba Aguilar
204/2005 Nonlinear Forecasting in Economics: a comparison between Comprehension Approach versus Learning Approach. An Application to Spanish Time Series
Elena Olmedo, Juan M. Valderas, Ricardo Gimeno and Lorenzo Escot
206/2005 Interregional migration in Spain: a semiparametric analysis Adolfo Maza y José Villaverde
207/2005 Productivity growth in European banking
Carmen Murillo-Melchor, José Manuel Pastor y Emili Tortosa-Ausina
208/2005 Explaining Bank Cost Efficiency in Europe: Environmental and Productivity Influences.
Santiago Carbó Valverde, David B. Humphrey y Rafael López del Paso
209/2005 La elasticidad de sustitución intertemporal con preferencias no separables intratemporalmente: los casos de Alemania, España y Francia.
Elena Márquez de la Cruz, Ana R. Martínez Cañete y Inés Pérez-Soba Aguilar
210/2005 Contribución de los efectos tamaño, book-to-market y momentum a la valoración de activos: el caso español.
Begoña Font-Belaire y Alfredo Juan Grau-Grau
211/2005 Permanent income, convergence and inequality among countries José M. Pastor and Lorenzo Serrano
212/2005 The Latin Model of Welfare: Do ‘Insertion Contracts’ Reduce Long-Term Dependence?
Luis Ayala and Magdalena Rodríguez
213/2005 The effect of geographic expansion on the productivity of Spanish savings banks Manuel Illueca, José M. Pastor and Emili Tortosa-Ausina
214/2005 Dynamic network interconnection under consumer switching costs Ángel Luis López Rodríguez
215/2005 La influencia del entorno socioeconómico en la realización de estudios universitarios: una aproxi- mación al caso español en la década de los noventa
Marta Rahona López
216/2005 The valuation of spanish ipos: efficiency analysis Susana Álvarez Otero
217/2005 On the generation of a regular multi-input multi-output technology using parametric output dis- tance functions
Sergio Perelman and Daniel Santin
218/2005 La gobernanza de los procesos parlamentarios: la organización industrial del congreso de los di- putados en España
Gonzalo Caballero Miguez
219/2005 Determinants of bank market structure: Efficiency and political economy variables Francisco González
220/2005 Agresividad de las órdenes introducidas en el mercado español: estrategias, determinantes y me- didas de performance
David Abad Díaz
222/2005 Human capital accumulation and geography: empirical evidence in the European Union Jesús López-Rodríguez, J. Andrés Faíña y Jose Lopez Rodríguez
223/2005 Auditors' Forecasting in Going Concern Decisions: Framing, Confidence and Information Proc- essing
Waymond Rodgers and Andrés Guiral
224/2005 The effect of Structural Fund spending on the Galician region: an assessment of the 1994-1999 and 2000-2006 Galician CSFs
José Ramón Cancelo de la Torre, J. Andrés Faíña and Jesús López-Rodríguez
225/2005 The effects of ownership structure and board composition on the audit committee activity: Span- ish evidence
Carlos Fernández Méndez and Rubén Arrondo García
226/2005 Cross-country determinants of bank income smoothing by managing loan loss provisions Ana Rosa Fonseca and Francisco González
227/2005 Incumplimiento fiscal en el irpf (1993-2000): un análisis de sus factores determinantes Alejandro Estellér Moré
228/2005 Region versus Industry effects: volatility transmission Pilar Soriano Felipe and Francisco J. Climent Diranzo
229/2005 Concurrent Engineering: The Moderating Effect Of Uncertainty On New Product Development Success
Daniel Vázquez-Bustelo and Sandra Valle
230/2005 On zero lower bound traps: a framework for the analysis of monetary policy in the ‘age’ of cen- tral banks
Alfonso Palacio-Vera
231/2005 Reconciling Sustainability and Discounting in Cost Benefit Analysis: a methodological proposal M. Carmen Almansa Sáez and Javier Calatrava Requena
232/2005 Can The Excess Of Liquidity Affect The Effectiveness Of The European Monetary Policy?
Santiago Carbó Valverde and Rafael López del Paso
233/2005 Inheritance Taxes In The Eu Fiscal Systems: The Present Situation And Future Perspectives.
Miguel Angel Barberán Lahuerta
234/2006 Bank Ownership And Informativeness Of Earnings.
Víctor M. González
235/2006 Developing A Predictive Method: A Comparative Study Of The Partial Least Squares Vs Maxi- mum Likelihood Techniques.
Waymond Rodgers, Paul Pavlou and Andres Guiral.
236/2006 Using Compromise Programming for Macroeconomic Policy Making in a General Equilibrium Framework: Theory and Application to the Spanish Economy.
Francisco J. André, M. Alejandro Cardenete y Carlos Romero.
238/2006 Trade Effects Of Monetary Agreements: Evidence For Oecd Countries.
Salvador Gil-Pareja, Rafael Llorca-Vivero y José Antonio Martínez-Serrano.
239/2006 The Quality Of Institutions: A Genetic Programming Approach.
Marcos Álvarez-Díaz y Gonzalo Caballero Miguez.
240/2006 La interacción entre el éxito competitivo y las condiciones del mercado doméstico como deter- minantes de la decisión de exportación en las Pymes.
Francisco García Pérez.
241/2006 Una estimación de la depreciación del capital humano por sectores, por ocupación y en el tiempo.
Inés P. Murillo.
242/2006 Consumption And Leisure Externalities, Economic Growth And Equilibrium Efficiency.
Manuel A. Gómez.
243/2006 Measuring efficiency in education: an analysis of different approaches for incorporating non-discretionary inputs.
Jose Manuel Cordero-Ferrera, Francisco Pedraja-Chaparro y Javier Salinas-Jiménez
244/2006 Did The European Exchange-Rate Mechanism Contribute To The Integration Of Peripheral Countries?.
Salvador Gil-Pareja, Rafael Llorca-Vivero y José Antonio Martínez-Serrano 245/2006 Intergenerational Health Mobility: An Empirical Approach Based On The Echp.
Marta Pascual and David Cantarero
246/2006 Measurement and analysis of the Spanish Stock Exchange using the Lyapunov exponent with digital technology.
Salvador Rojí Ferrari and Ana Gonzalez Marcos
247/2006 Testing For Structural Breaks In Variance Withadditive Outliers And Measurement Errors.
Paulo M.M. Rodrigues and Antonio Rubia
248/2006 The Cost Of Market Power In Banking: Social Welfare Loss Vs. Cost Inefficiency.
Joaquín Maudos and Juan Fernández de Guevara
249/2006 Elasticidades de largo plazo de la demanda de vivienda: evidencia para España (1885-2000).
Desiderio Romero Jordán, José Félix Sanz Sanz y César Pérez López 250/2006 Regional Income Disparities in Europe: What role for location?.
Jesús López-Rodríguez and J. Andrés Faíña
251/2006 Funciones abreviadas de bienestar social: Una forma sencilla de simultanear la medición de la eficiencia y la equidad de las políticas de gasto público.
Nuria Badenes Plá y Daniel Santín González
252/2006 “The momentum effect in the Spanish stock market: Omitted risk factors or investor behaviour?”.
Luis Muga and Rafael Santamaría
253/2006 Dinámica de precios en el mercado español de gasolina: un equilibrio de colusión tácita.
Jordi Perdiguero García
255/2006 Environmental implications of organic food preferences: an application of the impure public goods model.
Ana Maria Aldanondo-Ochoa y Carmen Almansa-Sáez
256/2006 Family tax credits versus family allowances when labour supply matters: Evidence for Spain.
José Felix Sanz-Sanz, Desiderio Romero-Jordán y Santiago Álvarez-García
257/2006 La internacionalización de la empresa manufacturera española: efectos del capital humano genérico y específico.
José López Rodríguez
258/2006 Evaluación de las migraciones interregionales en España, 1996-2004.
María Martínez Torres
259/2006 Efficiency and market power in Spanish banking.
Rolf Färe, Shawna Grosskopf y Emili Tortosa-Ausina.
260/2006 Asimetrías en volatilidad, beta y contagios entre las empresas grandes y pequeñas cotizadas en la bolsa española.
Helena Chuliá y Hipòlit Torró.
261/2006 Birth Replacement Ratios: New Measures of Period Population Replacement.
José Antonio Ortega.
262/2006 Accidentes de tráfico, víctimas mortales y consumo de alcohol.
José Mª Arranz y Ana I. Gil.
263/2006 Análisis de la Presencia de la Mujer en los Consejos de Administración de las Mil Mayores Em- presas Españolas.
Ruth Mateos de Cabo, Lorenzo Escot Mangas y Ricardo Gimeno Nogués.
264/2006 Crisis y Reforma del Pacto de Estabilidad y Crecimiento. Las Limitaciones de la Política Econó- mica en Europa.
Ignacio Álvarez Peralta.
265/2006 Have Child Tax Allowances Affected Family Size? A Microdata Study For Spain (1996-2000).
Jaime Vallés-Giménez y Anabel Zárate-Marco.
266/2006 Health Human Capital And The Shift From Foraging To Farming.
Paolo Rungo.
267/2006 Financiación Autonómica y Política de la Competencia: El Mercado de Gasolina en Canarias.
Juan Luis Jiménez y Jordi Perdiguero.
268/2006 El cumplimiento del Protocolo de Kyoto para los hogares españoles: el papel de la imposición sobre la energía.
Desiderio Romero-Jordán y José Félix Sanz-Sanz.
269/2006 Banking competition, financial dependence and economic growth Joaquín Maudos y Juan Fernández de Guevara
270/2006 Efficiency, subsidies and environmental adaptation of animal farming under CAP Werner Kleinhanß, Carmen Murillo, Carlos San Juan y Stefan Sperlich
272/2006 Riesgo asimétrico y estrategias de momentum en el mercado de valores español Luis Muga y Rafael Santamaría
273/2006 Valoración de capital-riesgo en proyectos de base tecnológica e innovadora a través de la teoría de opciones reales
Gracia Rubio Martín
274/2006 Capital stock and unemployment: searching for the missing link
Ana Rosa Martínez-Cañete, Elena Márquez de la Cruz, Alfonso Palacio-Vera and Inés Pérez- Soba Aguilar
275/2006 Study of the influence of the voters’ political culture on vote decision through the simulation of a political competition problem in Spain
Sagrario Lantarón, Isabel Lillo, Mª Dolores López and Javier Rodrigo 276/2006 Investment and growth in Europe during the Golden Age
Antonio Cubel and Mª Teresa Sanchis
277/2006 Efectos de vincular la pensión pública a la inversión en cantidad y calidad de hijos en un modelo de equilibrio general
Robert Meneu Gaya
278/2006 El consumo y la valoración de activos Elena Márquez y Belén Nieto
279/2006 Economic growth and currency crisis: A real exchange rate entropic approach David Matesanz Gómez y Guillermo J. Ortega
280/2006 Three measures of returns to education: An illustration for the case of Spain María Arrazola y José de Hevia
281/2006 Composition of Firms versus Composition of Jobs Antoni Cunyat
282/2006 La vocación internacional de un holding tranviario belga: la Compagnie Mutuelle de Tram- ways, 1895-1918
Alberte Martínez López
283/2006 Una visión panorámica de las entidades de crédito en España en la última década.
Constantino García Ramos
284/2006 Foreign Capital and Business Strategies: a comparative analysis of urban transport in Madrid and Barcelona, 1871-1925
Alberte Martínez López
285/2006 Los intereses belgas en la red ferroviaria catalana, 1890-1936 Alberte Martínez López
286/2006 The Governance of Quality: The Case of the Agrifood Brand Names Marta Fernández Barcala, Manuel González-Díaz y Emmanuel Raynaud
287/2006 Modelling the role of health status in the transition out of malthusian equilibrium Paolo Rungo, Luis Currais and Berta Rivera
288/2006 Industrial Effects of Climate Change Policies through the EU Emissions Trading Scheme Xavier Labandeira and Miguel Rodríguez