10
Documentos de Trabajo
10
Documentos de Trabajo
2007
Pilar García Gómez Ángel López Nicolás
The Evolution
of Inequity in Access to Health Care
in Spain
1987-2001
Gran Vía, 12 48001 Bilbao Tel.: 94 487 52 52
2007-10 19/3/07 12:41 Página 1
The Evolution of Inequity in Access to Health Care in Spain
1987-2001 Pilar García Gómez
1Ángel López Nicolás
1,21 P O M P E U F A B R A U N I V E R S I T Y
2 P O L Y T E C H N I C U N I V E R S I T Y O F C A R T A G E N A
Abstract
This working paper reports an analysis of the evolu- tion of equity in access to health care in Spain over the period 1987-2001, a time span covering the de- velopment of the modern Spanish National Health System. Our measures of access are the probabilities of visiting a doctor, using emergency services and being hospitalised. For these three measures we ob- tain indices of horizontal inequity from microecono- metric models of utilization that exploit the indivi- dual information in the Spanish National Health Surveys of 1987 and 2001. We find that by 2001 the system has improved in the sense that differ- ences in income no longer lead to different access given the same level of need. However, the tenure of private health insurance leads to differences in ac- cess given the same level of need, and its contribu- tion to inequity has increased over time, both be- cause insurance is more concentrated among the rich and because the elasticity of utilization for the three services has increased too.
Resumen
Este documento de trabajo presenta un análisis de la evolución de la equidad en el acceso a la asistencia sanitaria en España en el período 1987-2001, coin- cidiendo con el desarrollo del Sistema Nacional de Salud moderno. Medimos el acceso como las proba- bilidades de acudir a un médico, de hacer uso de los servicios de urgencias y de ingresar en un hospital.
Para estas tres medidas obtenemos índices de ine- quidad horizontal a partir de modelos microeconomé- tricos, que se nutren de los datos individuales de las Encuestas Nacionales de Salud correspondientes a 1987 y 2001. Se observa que el sistema ha mejora- do a lo largo de este período en el sentido de que di- ferencias de renta ya no conllevan diferencias de ac- ceso a igual grado de necesidad. No obstante, la tenencia de seguros sanitarios privados sí implica di- ferencias de acceso a igual grado de necesidad, y su papel en la inequidad ha aumentado con el tiempo por dos motivos: por la mayor penetración de la co- bertura privada entre la población rica y por el au-
Al publicar el presente documento de trabajo, la Fundación BBVA no asume res- ponsabilidad alguna sobre su contenido ni sobre la inclusión en el mismo de documentos o información complementaria facilitada por los autores.
The BBVA Foundation’s decision to publish this working paper does not imply any re- sponsibility for its content, or for the inclusion therein of any supplementary documents or information facilitated by the authors.
La serie Documentos de Trabajo tiene como objetivo la rápida difusión de los resultados del trabajo de investigación entre los especialistas de esa área, para promover así el intercambio de ideas y el debate académico. Cualquier comenta- rio sobre sus contenidos será bien recibido y debe hacerse llegar directamente a los autores, cuyos datos de contacto aparecen en la Nota sobre los autores.
The Working Papers series is intended to disseminate research findings rapidly among specialists in the field concerned, in order to encourage the exchange of ideas and academ- ic debate. Comments on this paper would be welcome and should be sent direct to the authors at the addresses provided in the About the authorssection.
Todos los documentos de trabajo están disponibles, de forma gratuita y en for- mato PDF, en la web de la Fundación BBVA. Si desea una copia impresa, puede solicitarla a través de [email protected].
All working papers can be downloaded free of charge in pdf format from the BBVA Foundation website. Print copies can be ordered from [email protected].
The Evolution of Inequity in Access to Health Care in Spain: 1987-2001
© Pilar García Gómez and Ángel López Nicolás, 2007
© de esta edición / of this edition:Fundación BBVA, 2007
EDITA/ PUBLISHED BY
Fundación BBVA, 2007 Plaza de San Nicolás, 4. 48005 Bilbao
DEPÓSITO LEGAL/ LEGAL DEPOSIT NO.: M-16.012-2007
IMPRIME/ PRINTED BY: Rógar, S. A.
Impreso en España – Printed in Spain
La serie Documentos de Trabajo de la Fundación BBVA está elaborada con papel 100% reciclado, fabricado a partir de fibras celulósicas recuperadas (papel usado) y no de celulosa virgen, cumplien- do los estándares medioambientales exigidos por la legislación vigente.
La serie Documentos de Trabajo, así como información sobre otras publicaciones de la Fundación BBVA, pueden consultarse en: http://www.fbbva.es
The Working Papers series, as well as information on other BBVA Foundation publications,
can be found at: http://www.fbbva.es
C O N T E N T S
1. Introduction . . . 5
2. The Transition of the Spanish Health Care System and Previous Literature on Inequities in Utilization . . . 7
3. Methods . . . 10
3.1. Measuring and decomposing inequalities in health care utilization . 10 3.2. Decomposing inequity over time . . . 13
3.3. Statistical inference . . . 14
3.4. Data and variable definitions . . . 14
4. Empirical Results . . . 16
5. Discussion and Conclusion . . . 21
References . . . 23
About the Authors . . . 25
1. Introduction
S
PANISH society has undergone a major overhaul in the three decades elapsed since the death of Franco. The transformation from dictatorship to a democracy and the devolution of government to the regions have com- bined with the sheer effect of the passage of time to transform an obsolete public sector into one comparable to that of developed countries. The health care system is one of the areas where reforms have been far reaching, and in this paper we aim to evaluate the change over time in one of the indica- tors that serve to assess its performance: the existence and degree of in- equities in health care utilization. In particular we will evaluate whether there have been changes in the distribution of utilization for a given level of health care need. Secondly, we shall decompose the sources of inequal- ity in utilization and explain the observed differences between 1987 and 2001. The choice of these two time periods is motivated by the fact that the most comprehensive pack of reforms for the health care system was systematized and put forward by the 1986 General Health Act, among whose main goals there are the wish to eliminate socio-economic health inequalities in access, as expressed in its Artículo 3 and to correct in- equalities in health Artículo 12. We shall use data from the 1987 Encuesta Nacional de Salud (Centro de Investigaciones Sociológicas [CIS], 1987) to assess the degree of income related utilization inequality in the Spanish population shortly after this important law. We choose the 2001 edition of the same survey (CIS, 2001) in order to deal with comparable informa- tion. The comparison of two cross sections of the Spanish population has a limited ability to reflect the causal effect of a multi-faceted package of re- forms. Nevertheless, our contention is that the implementation of these reforms should change the joint distribution of utilization and socio-eco- nomic characteristics after controlling for health care needs, and in this paper we set out to measure such change.Our results show that by 2001 the system has improved in the sense that differences in income no longer lead to different access given the same level of need. However, the tenure of private health insurance leads to diffe- rences in access given the same level of need, and its contribution to in- equity has increased over time, both because insurance is more concentrated
among the rich and because the elasticity of utilization for the three services has increased too.
Section 2 briefly summarizes the main characteristics of the health sys- tem and the reforms that have taken place in the recent past and provides a brief review of previous relevant studies. Section 3 presents the methodol- ogy that we adopt for the measurement of inequities in health care utiliza- tion and the explanation of their changes over time. Section 4 presents the empirical results and section 5 discusses the implications of our results.
pilar garcía gómez and ángel lópez nicolás
2. The Transition of the Spanish Health Care System and
Previous Literature on Inequities
in Utilization
A
T the end of the dictatorship in 1975, the Spanish health system was based on a social security scheme paid by employers and employees and com- plemented by a network of health care centers owned by different organiza- tions. One of the characterizing features of the pre-democratic system was a strong bias towards hospital care. While the 70’s had witnessed the creation of a public network of modern hospitals, primary and preventive services in the public network were underdeveloped: general practitioners were typi- cally available for two and a half hours per day at isolated outlets which lacked administrative and diagnostic support (European Observatory on Health Care Systems [EOHCS], 2000). The arrival of democracy unleashed the latent demand for a better health care system and important legislative and managerial changes ensued. The Ministry of Health was created in 1977 and the 1978 Constitution consecrated public coverage for all citizens.Momentum gathered after 1983 when the government started a set of re- forms to integrate the different networks. By 1986 the General Health Act transformed the social security system into a National Health System.
Thus, there are two main structural reforms with a potential impact on socio-economic inequalities in access to health care occurred during the period studied in this paper. Firstly, the system finally was consolidated as a tax-funded, universal coverage National Health System within which individ- uals are entitled to a comprehensive set of benefits including not only pri- mary and specialized inpatient and outpatient care, but also subsidized med- icines with zero co-payments for specific groups such as pensioners or disabled persons and reduced co-payments for drugs for chronic diseases in- cluding AIDS. Secondly, primary care has been totally reformed by means of
substituting the obsolete outlets mentioned above by team based practices staffed by doctors and nurses who have received specific training in family medicine and whose activities not only included curative care, but also pre- ventive care, health promotion, follow up of patients and services targeted to particular population groups such as the mentally ill, drug users etc. The implementation of the primary care reform all over Spain was slow: while it was planned as far back as 1984 and turned into law in 1986, only 50% of the population was covered by the new system in 1992 and the proportion reached 81% by 2000 (European Observatory on Health Care Systems, 2000). This is in fact the most important reform taking place during the pe- riod under study. For these reasons it seems appropriate to evaluate the change between 1987 and 2001.
In this study we intend to pay special attention to the role of private health insurance (PHI) as a determinant of inequities in health care. PHI in Spain essentially provides duplicate or doublecoverage in the sense that it cov- ers services that are concurrently provided by the public network. Nev- ertheless there are some features, such as the possibility of by-passing the GP before consulting a specialist or the access to better hospital amenities, which confer PHI a degree of supplementarity in the sense of Mossialos and Thomson (2002). The concern about the equity effects of PHI in Spain is justified by the fact that expenditure on PHI has received public subsidies in the form of tax bonuses. Prior to 1999 the subsidy operated via personal in- come tax: individuals received a 15% rebate on insurance premia (as well as on any other expenditure on health care). Currently, it operates via corpo- rate tax: premia are considered tax free in kind salary and companies can substract from profits the cost of collective policies (thus obtaining a 35%
tax bonus on their cost). These subsidies might potentially induce unde- sired effects in terms of equity, because PHI alters the patterns of utilization, as shown by Rodríguez and Stoyanova (2004). Moreover, for the particular case of specialist visits, Jones, Koolman and Van Doorslaer (2007) and Van Doorslaer, Koolman and Puffer (2002) have obtained evidence that sup- ports the notion that PHI in Spain actually generates pro-rich inequity in ac- cess.
Apart from the studies cited above, there is a growing body of litera- ture on the evaluation of the reforms in the Spanish National Health system since the Health Act of 1986 in terms of inequities in utilization. The pio- neering work of Rodríguez, Calonge and Reñé (1993) offered evidence, with data from 1987, on the degree of inequity in public health care con- sumption as measured by the expenditure devoted to doctor visits and hos- pitalizations in the public network. A similar method was followed by Abáso-
pilar garcía gómez and ángel lópez nicolás
lo (1998) with data for 1993. More recently, Urbanos (1999, 2001) has con- sidered the dynamics of inequity and analyzed data for 1987, 1993, 1995 and 1997 within a unified methodological framework. Urbanos actually con- siders consumption data (number of visits and inpatient days) as well as an expenditure aggregate and her results suggest a decrease in inequity during the period 1993-1995. Moreover, for 1997 she finds that the inequity indices for visits to GPs and specialist and inpatient days are not statistically signifi- cant. In contrast, she finds that there is a significant degree of pro-rich in- equity in emergency visits. These results contrast with the results by Van Doorslaer, Koolman and Puffer (2002), who find a significant degree of pro- rich inequity in specialist visits and pro-poor inequality in GP visits using data from the 1996 Spanish wave of the ECHP. Van Doorslaer and Koolman (2004) again find that there is a significant degree of pro-poor inequity in both the probability of visiting and the conditional number of visits to a GP whereas there is pro-rich inequity in both the probability of contacting a specialist and the conditional number of visits. Van Doorslaer, Koolman and Masseria (2004) obtain point estimates that would suggest evidence of pro- rich inequity in hospital admissions using data from the ECPH, but the null of no statistical significance cannot be rejected from these estimates.
This paper contributes in a series of fronts to the existing literature.
First, unlike Rodríguez, Calonge and Reñé (1993) and Urbanos (1999, 2001), we do not restrict the analysis to publicly provided health care. As discussed above, the reason is that privately provided health care and PHI have received public subsidies during the period considered. Secondly, most of the existing studies do not address the equity effects of PHI, and this pa- per offers some methodological advantages with respect to those that do so, such as Van Doorslaer, Koolman and Puffer (2002), which will be discussed later on. A third contribution consists in using two comparable health sur- veys with rich information on health status spanning 14 years since the Gen- eral Health Act. Despite the obvious limitations of all before-after evalua- tions, this is a plausible empirical strategy to approximate the effects of the evolution of the system on equity.
the evolution of inequity in access to health care in spain: 1987-2001
3. Methods
3.1. Measuring and decomposing inequalities in health care utilization
The operational concept of inequity used in the recent literature is socio- economic inequality in utilization not justified by socio-economic inequal- ities in need. Therefore it is necessary to compute measures of socio-econom- ic inequality in utilization, decompose these measures and subsequently decide which components might be justified by unequal needs. The litera- ture on health inequalities has recently adopted a standard tool for the mea- surement of socio-economic inequalities in health or health care utilization:
the concentration index (CI) (Waggstaff, Van Doorslaer and Paci, 1989).
The concentration index has a similar interpretation to the more familiar Gini index for pure inequality. In fact, the two inequality measures differ in the fact that the ranking variable is a measure of socio-economic status (usu- ally income) (CI) rather than health/utilization (Gini). The CIranges be- tween –1 and 1. A value of –1 would mean that all health/health care utiliza- tion is concentrated in the poorest person, whereas a value of 1 would result if all health/utilization were concentrated in the richest person. A value of zero would mean that health/utilization is equally distributed over income in the sense that the pth percentage of the population ranked by income has exactly the pthpercentage of total health/utilization for any p.
Suppose we are interested in calculating the CIfor a measure of health care utilization on income using individual data from the population of interest. Let yidenote a measure of utilization for the ithindividual, i= 1, 2, ... N, and R’idenote the cumulative proportion of the population ranked by income up to the ithindividual (their relative income rank).
The CIof utilization on income is given by (see e.g. Van Doorslaer and Jones, 2003),
CI =
(
2 y¯)
cov (yi, R’i) (3.1)where y¯ = E (yi).
We consider three types of health care utilization: visits to doctors, use of emergency services and hospitalisations. For each of these services, our measure of access consists in the probability of utilization at least once with- in a given time period. In the case of visits to doctors the time period is fif- teen days whereas for the other two services, the time period is one year. For 2001, we are able to consider separately the probabilities of having visited a GP or a specialist, since the survey provides information on the speciality of the doctor in the last visit. While the health surveys offer information on the number of events for each of the three services, we abstain from consider- ing measures of equity in the number of events. This is motivated by the fact that the distributions for the numbers of events are concentrated on 0 and 1. For instance, less than 5% (6% for 2001) of individuals report more than one visit to the doctor and less than 2% (1% for 2001) report more than two. The case of hospitalizations is even more extreme in this sense, as only for 2001 we do find individuals reporting more than one event, and these individuals make up for less than 2% of the sample. Furthermore, the studies that have considered both the probability of contact and the condi- tional number of events have found that, where there are inequities, these operate in the same direction for both dimensions of utilization (Van Doorslaer et al., 2004).
For each of the three types of health care, we specify a Linear Proba- bility Model (LPM) in the following way
yji= aj+
S
k bkjxki+ eij (3.2)where yi= 1(individual ireports at least one episode of health care j). It fol- lows that
P(yji= 1) = aj+
S
k bkjxki (3.3)Our choice for the LPM is justified on the grounds that the linearity in parameters is particularly useful for our purposes of decomposing in- equalities in the probability of utilization (this property has been exploited by Van Doorslaer et al. (2004) in their study of inequity in the utilization of inpatient services). In particular, as shown by Waggstaff, Van Doorslaer and Watanabe (2003), if the probability of utilization is described by equation (3.3), then an inequality index for the probability of utilization is given by
CIj=
S
k(
bkjP¯x¯kij)
CI ’k=S
k hkjCI ’k (3.4)the evolution of inequity in access to health care in spain: 1987-2001
The term in brackets is the elasticity of P with respect to xk evaluated at the population means and CI’kdenotes the concentration index of xk against income. Thus this inequality measure can be usefully broken down into the contributions of individual explanatory variables. Moreover, if we define the estimated health elasticity with respect to determinant kas
hkj≡ bkjx¯k
(3.5) P¯j
then we can rewrite the decomposition in a way such that the CIis just a weighted sum of the inequality in each of its determinants, with the weights equal to the elasticities, as expressed in the last part of equation (3.4). As mentioned by Van Doorslaer and Koolman (2004), the decomposition also clarifies how each correlate of health contributes to total income-related uti- lization inequality: this contribution is the result of (i) its impact on health, and (ii) how unequally distributed over income it is.
Measures of horizontal inequity are easily obtained from the decom- position of income related inequality in utilization (Van Doorslaer et al., 2004; Gravelle, 2003). All that is required is an agreement on what variables in the model of utilization can be considered as legitimate determinants of unequal access from a normative point of view. Assume that the vector x= (x1, ... xk) can be partitioned into non-need and need variables x= (xnn,xn) = (x1, x2, ... xk1, xk1 + 1... xk). An index of horizontal inequity is given by the part of socio-economic inequality in utilization not justified by socio-economic inequalities in need. That is
HIj= CIj– CInj = CInnj = k = 1
S
K hkjCI ’k– k = kS
K1+1
hkjCI ’k=
S
k1
k = 1
hkjCI ’k (3.6) This method differs in an important way from the method of indirect standardizationby Waggstaff and Van Doorslaer (1996). The method of indirect standardization consists in first computing the concentration index of actual utilization and then substracting from it the concentration index of predicted utilization, where predicted utilization is obtained from the es- timation of an econometric model for utilization as a function of need vari- ables. This procedure has been criticised on the grounds that the omission of variables which, despite not qualifying as need indicators from a norma- tive point of view are nevertheless associated to utilization, can lead to biased estimation (Schokkaert and Van de Voorde, 2004; Gravelle, 2003). This is particularly relevant for the purposes of this study. Since we wish to evaluate the impact of PHI on utilization, and since PHI tenure is strongly associated
pilar garcía gómez and ángel lópez nicolás
to income and other socio-economic characteristics, omission of income—a non need variable—from the utilization equation can lead to biased esti- mates for the impact of PHI. The existing studies for the case of Spain most- ly rely on the indirect standardization method. Indeed, only Van Doorslaer et al. (2004) use the method discussed above, but their analysis does not consider the effect of PHI.
In relation to the point discussed in the previous paragraph, we must note that the literature on utilization generally treats PHI as an endogenous variable (see Vera-Hernández 1999 for the case of Spain). This is motivated by the recognition that unobserved factors that affect the purchase of PHI are correlated with unobserved factors that affect utilization (adverse selec- tion bias). Our steps to address this issue consist in enriching the specifica- tion for utilization with an ample set of health status indicators in an at- tempt to capture all relevant risk factors. This should purge the estimate for the effect of PHI from biases arising from the omission from the utilization equations of health factors that simultaneously drive the propensity to pur- chase PHI. In any case, the results obtained by Jones, Koolman and Van Doorslaer (2007) reveal that correlation between unobservables seems to operate in the way of making low risk/low utilization individuals more likely to purchase PHI. In these circumstances, should our strategy not fully purge the estimate for the PHI effect from adverse selection bias, this estimate would provide a lower bound for the true effect.
3.2. Decomposing inequity over time
The previous section shows how horizontal inequity in utilization can be ex- pressed as the contribution of non-need variables to an index of socio-eco- nomic inequality in utilization. It is then straightforward to use the ap- proach proposed by Waggstaff, Van Doorslaer and Watanabe (2003) in order to decompose the difference in inequity between two periods. The method is a derivation of the well known Oaxaca decomposition whereby the difference between the CI’s of the population at period tand period t– 1 can be written as
Then, the contribution of any variable to the difference in inequity is given by:
DCInnk= hkt(CI’kt– CI’kt– 1) + CI’kt– 1(hkt– hkt– 1) (3.8)
the evolution of inequity in access to health care in spain: 1987-2001
DHIj= CInntj – CInntj – 1=
S
k1
k = 1
hkt(CI’kt– CI’kt– 1) +
S
k1
k = 1
CI’kt– 1kt– 1(hkt– hkt– 1) (3.7)
In practice, we shall compute the differences in inequity (and contri- butions toward such difference) between 2001 and 1987. Moreover, in or- der to assess the relative importance of the inequality versus the health elas- ticity component in the contribution of each variable, we also compute the relative excess elasticity compared to year 1987, i.e. (hk2001 – hk1987)/ ⁄hk1987⁄, and the relative excess inequality, (CIk2001– CIk1987) / ⁄CIk1987⁄
3.3. Statistical inference
Many of the statistics that we are going to report are non-linear functions of the data whose sampling distributions are hard to obtain. For this reason we shall use bootstrapping methods in order to derive standard errors. The bootstrap estimates for standard errors are computed following the five-step approach used by Van Doorslaer and Koolman (2004). The number of rep- lications has been set to 500.
3.4. Data and variable definitions
We use the 2001 and the 1987 editions of the Encuesta Nacional de Salud (CIS, 1987, 2001). These are nation wide surveys collecting information on health and socioeconomic characteristics of individuals. The surveys contain separate adults (16+) and children samples. The analysis in this paper is based on the adult samples. The sampling scheme is a multi-stage stratified process whereby primary strata are Autonomous Communities (2001 edition) or Provinces (1987 edition). Within primary strata, sub-stra- ta are defined according to residence area population size. Within substra- ta, municipalities (primary sampling units) and sections (secondary sam- pling units) are selected according to a proportional random sampling scheme. Finally, individuals are randomly selected from the sections. The survey documentation includes weighting factors that correct for the fact that the number of observations within the primary strata is not proportion- al to actual population. We use these weights whenever a nationwide sta- tistic is computed. The information contained in the data files do not al- low the identification of all the primary sampling units (because
municipalities with a population below 100,000 are not identified). Simi- larly, information about the secondary sampling units is omitted so it is impossible to control for cluster effects at either the municipality level or the section level.
pilar garcía gómez and ángel lópez nicolás
The ranking variable is equivalised total monthly income earned by the household (income hereafter). In the ENS this is measured as a categor- ical variable with 12 response categories in 1987 and 6 response categories in 2001. In order to obtain a continuous measure for income and also over- come the fact that for both editions there is a substantial proportion of item non-response, we specify an interval regression model using a wide range of explanatory variables referring both to the respondent and the head of hou- sehold. These variables are relationship between interviewee and head of household, education of head of household, occupation of head of house- hold, employment status of head of household, tenure of private health in- surance, age and sex of the head of household and regional dummies. Ex- cept for the upper quantiles, the distributions for the predictions of income compare well with data from the continuous household expenditure survey (ECPF) of 1987 and data from the Spanish sample of the 2001 wave of the European Community Household Panel. The evolution of income inequal- ity as measured by the Gini index also compares well with external sources.
The initial 1987 ENS sample included 29,647 individuals. From the initial sample, 5 observations were dropped as income could not be predic- ted, and after deleting those not responding to one of the relevant ques- tions the final sample contains 29,185 observations in the visits to doctors es- timation, 28,849 in hopitalisation and 29,122 in use of emergency services.
On the other hand, the initial 2001 ENS sample included 21,067 individuals from all the Autonomous Communities, although the observations from Ceuta and Melilla were dropped as there were not individuals from these two regions in the 1987 sample. From the remaining 20.748, after deleting those not responding to one of the relevant questions the final sample con- tains 20,644 in the visits to doctor estimation, 20,635 in hospitalization, 20,636 in emergency visits, 20,644 in GP visits, 20,644 in specialist visits.
the evolution of inequity in access to health care in spain: 1987-2001
4. Empirical Results
A
S discussed in section 3.1, we specify and estimate LPM for the probabil- ity of visiting a doctor during the last fortnight, hospitalization over the last 12 months and emergency services utilization over the last 12 months. The explanatory variables in the models are:i) the logarithm of equivalent household income;
ii) 14 age-sex categories corresponding to age groups 16-19, 20-24, 25- 29, 30-34, 35-39, 40-44, 45-49, 50-54, 55-59, 60-64, 65-69, 70-74, 75-79, 80+ for men and women (the omitted category corresponds to a woman aged be- tween 16 and 19);
iii) 4 marital status categories: single, married, divorced, widowed (sin- gle or divorced are the omitted categories);
iv) 5 categories of self assessed health: very good (omitted category), good, fair, bad, very bad;
v) 5 chronic illness: cholesterol, high blood pressure, diabetes, bron- chitis or asthma, heart diseases and allergy;
vi) whether daily activities or leisure had been limited by any of the chronic diseases in the last 12 months;
vii) whether daily activities or leisure had been limited because of pain in the last two weeks;
viii) whether the individual had to stay in bed for more than half day in the last two weeks;
ix) whether the individual had an accident in the last year;
x) tenure of private insurance.
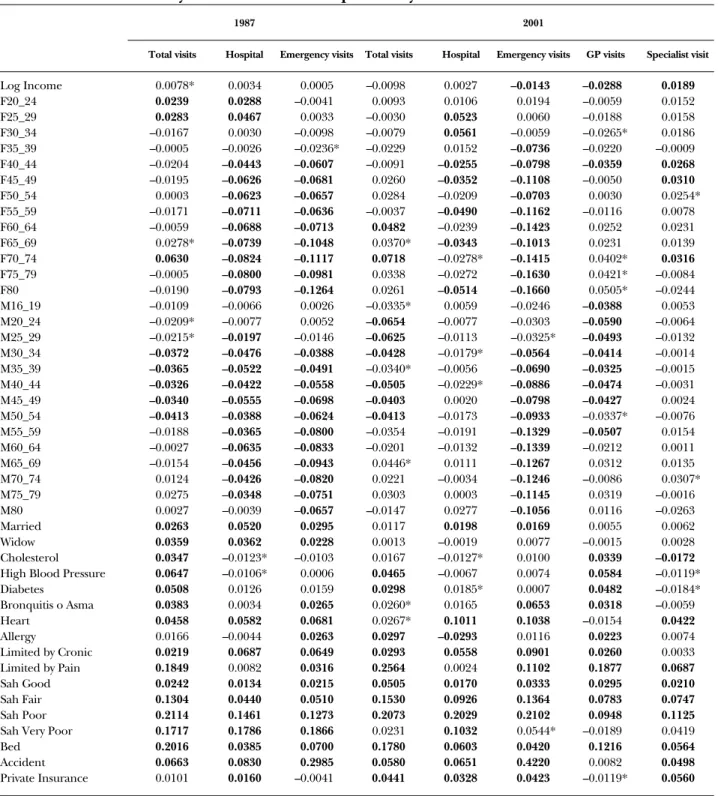
Table 4.1 contains the parameter estimates for the equations corre- sponding to each of the services by OLS. The estimates for the models permit the calculation of the inequality measures presented in table 4.2. Note that in both 1987 and 2001, the utilization of the three types of services (vis-
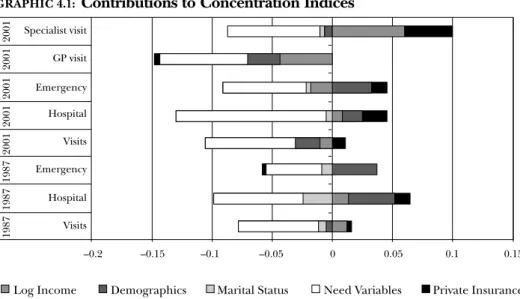
its to doctors, emergencies and hospitalizations) is unequally pro-poor distrib- uted. The concentration indices are statistically significant and the point esti- mates are greater for 2001, revealing that the degree of pro-poor inequal- ity is exacerbated over time. Graphic. 4.1 presents the contribution of each
the evolution of inequity in access to health care in spain: 1987-2001
TABLE 4.1: Linear Probability Model results for the probability of doctor utilization in 1987 and 2001
1987 2001
Total visits Hospital Emergency visits Total visits Hospital Emergency visits GP visits Specialist visit
Log Income 0.0078* 0.0034 0.0005 –0.0098 0.0027 –0.0143 –0.0288 0.0189
F20_24 0.0239 0.0288 –0.0041 0.0093 0.0106 0.0194 –0.0059 0.0152
F25_29 0.0283 0.0467 0.0033 –0.0030 0.0523 0.0060 –0.0188 0.0158
F30_34 –0.0167 0.0030 –0.0098 –0.0079 0.0561 –0.0059 –0.0265* 0.0186
F35_39 –0.0005 –0.0026 –0.0236* –0.0229 0.0152 –0.0736 –0.0220 –0.0009
F40_44 –0.0204 –0.0443 –0.0607 –0.0091 –0.0255 –0.0798 –0.0359 0.0268
F45_49 –0.0195 –0.0626 –0.0681 0.0260 –0.0352 –0.1108 –0.0050 0.0310
F50_54 0.0003 –0.0623 –0.0657 0.0284 –0.0209 –0.0703 0.0030 0.0254*
F55_59 –0.0171 –0.0711 –0.0636 –0.0037 –0.0490 –0.1162 –0.0116 0.0078
F60_64 –0.0059 –0.0688 –0.0713 0.0482 –0.0239 –0.1423 0.0252 0.0231
F65_69 0.0278* –0.0739 –0.1048 0.0370* –0.0343 –0.1013 0.0231 0.0139
F70_74 0.0630 –0.0824 –0.1117 0.0718 –0.0278* –0.1415 0.0402* 0.0316
F75_79 –0.0005 –0.0800 –0.0981 0.0338 –0.0272 –0.1630 0.0421* –0.0084
F80 –0.0190 –0.0793 –0.1264 0.0261 –0.0514 –0.1660 0.0505* –0.0244
M16_19 –0.0109 –0.0066 0.0026 –0.0335* 0.0059 –0.0246 –0.0388 0.0053
M20_24 –0.0209* –0.0077 0.0052 –0.0654 –0.0077 –0.0303 –0.0590 –0.0064
M25_29 –0.0215* –0.0197 –0.0146 –0.0625 –0.0113 –0.0325* –0.0493 –0.0132
M30_34 –0.0372 –0.0476 –0.0388 –0.0428 –0.0179* –0.0564 –0.0414 –0.0014
M35_39 –0.0365 –0.0522 –0.0491 –0.0340* –0.0056 –0.0690 –0.0325 –0.0015
M40_44 –0.0326 –0.0422 –0.0558 –0.0505 –0.0229* –0.0886 –0.0474 –0.0031
M45_49 –0.0340 –0.0555 –0.0698 –0.0403 0.0020 –0.0798 –0.0427 0.0024
M50_54 –0.0413 –0.0388 –0.0624 –0.0413 –0.0173 –0.0933 –0.0337* –0.0076
M55_59 –0.0188 –0.0365 –0.0800 –0.0354 –0.0191 –0.1329 –0.0507 0.0154
M60_64 –0.0027 –0.0635 –0.0833 –0.0201 –0.0132 –0.1339 –0.0212 0.0011
M65_69 –0.0154 –0.0456 –0.0943 0.0446* 0.0111 –0.1267 0.0312 0.0135
M70_74 0.0124 –0.0426 –0.0820 0.0221 –0.0034 –0.1246 –0.0086 0.0307*
M75_79 0.0275 –0.0348 –0.0751 0.0303 0.0003 –0.1145 0.0319 –0.0016
M80 0.0027 –0.0039 –0.0657 –0.0147 0.0277 –0.1056 0.0116 –0.0263
Married 0.0263 0.0520 0.0295 0.0117 0.0198 0.0169 0.0055 0.0062
Widow 0.0359 0.0362 0.0228 0.0013 –0.0019 0.0077 –0.0015 0.0028
Cholesterol 0.0347 –0.0123* –0.0103 0.0167 –0.0127* 0.0100 0.0339 –0.0172
High Blood Pressure 0.0647 –0.0106* 0.0006 0.0465 –0.0067 0.0074 0.0584 –0.0119*
Diabetes 0.0508 0.0126 0.0159 0.0298 0.0185* 0.0007 0.0482 –0.0184*
Bronquitis o Asma 0.0383 0.0034 0.0265 0.0260* 0.0165 0.0653 0.0318 –0.0059
Heart 0.0458 0.0582 0.0681 0.0267* 0.1011 0.1038 –0.0154 0.0422
Allergy 0.0166 –0.0044 0.0263 0.0297 –0.0293 0.0116 0.0223 0.0074
Limited by Cronic 0.0219 0.0687 0.0649 0.0293 0.0558 0.0901 0.0260 0.0033
Limited by Pain 0.1849 0.0082 0.0316 0.2564 0.0024 0.1102 0.1877 0.0687
Sah Good 0.0242 0.0134 0.0215 0.0505 0.0170 0.0333 0.0295 0.0210
Sah Fair 0.1304 0.0440 0.0510 0.1530 0.0926 0.1364 0.0783 0.0747
Sah Poor 0.2114 0.1461 0.1273 0.2073 0.2029 0.2102 0.0948 0.1125
Sah Very Poor 0.1717 0.1786 0.1866 0.0231 0.1032 0.0544* –0.0189 0.0419
Bed 0.2016 0.0385 0.0700 0.1780 0.0603 0.0420 0.1216 0.0564
Accident 0.0663 0.0830 0.2985 0.0580 0.0651 0.4220 0.0082 0.0498
Private Insurance 0.0101 0.0160 –0.0041 0.0441 0.0328 0.0423 –0.0119* 0.0560
Note:values significantly different from zero (at P< 0.05) in bold typeface. * (at P< 0.10).
group of variables to the overall CI. These figures reveal that a very large por- tion of the CIis explained by need, which is concentrated among the poor.
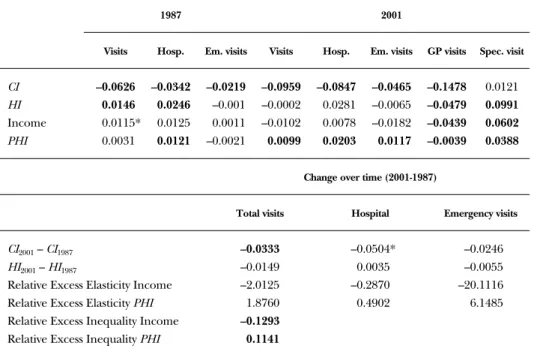
The second row of table 4.2 presents the inequity measure for each of the services as defined in section 3.1. For each of the services, HI(inequity
pilar garcía gómez and ángel lópez nicolás
GRAPHIC 4.1: Contributions to Concentration Indices
Specialist visit GP visit Emergency Hospital Visits Emergency Hospital Visits
19871987198720012001200120012001
Log Income Demographics
–0.2 –0.15 –0.1 –0.05 0 0.05 0.1 0.15
Marital Status Need Variables Private Insurance
TABLE 4.2: Concentration indices, inequity indices and changes over time
1987 2001
Visits Hosp. Em. visits Visits Hosp. Em. visits GP visits Spec. visit
CI –0.0626 –0.0342 –0.0219 –0.0959 –0.0847 –0.0465 –0.1478 0.0121 HI 0.0146 0.0246 –0.001 –0.0002 0.0281 –0.0065 –0.0479 0.0991 Income 0.0115* 0.0125 0.0011 –0.0102 0.0078 –0.0182 –0.0439 0.0602 PHI 0.0031 0.0121 –0.0021 0.0099 0.0203 0.0117 –0.0039 0.0388
Change over time (2001-1987)
Total visits Hospital Emergency visits
CI2001– CI1987 –0.0333 –0.0504* –0.0246
HI2001– HI1987 –0.0149 0.0035 –0.0055
Relative Excess Elasticity Income –2.0125 –0.2870 –20.1116
Relative Excess Elasticity PHI 1.8760 0.4902 6.1485
Relative Excess Inequality Income –0.1293 Relative Excess Inequality PHI 0.1141
Note:values significantly different from zero (at P< 0.05) in bold typeface. * (at P< 0.10).
index) is the part of the CI(inequality index) explained by income and ten- ure of private health insurance (i.e. the non-need and non-demographic var- iables in our specifications for the probability of utilization).
Note that in 1987 the HIindices for total visits and hospitalizations re- veal a significant degree of pro-rich inequity. In these cases, both income and tenure of PHIcontribute positively to the HIindex. This means, in 1987, that while overall utilization is concentrated among the poor, rich in- dividuals and/or individuals who enjoyed private health insurance (who tend to be richer than average) had more chances of using these health ser- vices than poor individuals and/or individuals without PHIat the same level of need. In contrast, the HIindices for the three services are statistically not different from zero in 2001, implying that for a given level of need, there are neither pro-rich nor pro-poor differences in the chances of utilization explained by income or insurance status.
In order to analyze with more detail the changes over time for these indices it is useful isolate the sources of their changes. As discussed in sec- tion 3.2, the contribution of each covariate to the index is given by the prod- uct of the elasticity of the probability of utilization and the concentration in- dex of the covariate. So, it might be the case that the impact of income, say, on the chances of using a particular service do not change but income be- comes better distributed. This would lead, ceteris paribus, to a reduction in the contribution of income to the degree of pro rich inequality in the chances of utilization. The bottom panel of table 4.2 presents the relevant de- compositions for the two non-need covariates that we have used in the speci- fication. The table offers a clear indication of the direction in which the re- levant magnitudes have evolved over time. First note that the distribution of equivalised household income has become more equal. Relative to 1987, the concentration index of log equivalised household income is 13%
smaller in 2001. The tenure of PHI, however, has evolved in the
opposite direction. Relative to 1987, the distribution of PHIis 11% more pro-rich.
Doctor visits: as seen in table 4.2, the HIfor the probability of visiting a doctor is positive and significant in 1987, with both income and PHIcontrib- uting positively. In 2001 the HIindex is not statistically significant, but this is the result of two antagonistic effects. While in 2001 the contribution of in- come is negative (and not significant), the contribution of PHIis still positive and significant. In the bottom panel of the table we can see that the change in the contribution of income is driven by a 200% reduction in the size of the elasticity of the probability of utilization (as well as the decrease in in- come inequality). In contrast, as well as becoming more concentrated among
the evolution of inequity in access to health care in spain: 1987-2001
the rich, the tenure of PHIexerts a greater impact on the probability of uti- lization. The relative change in elasticity is 180%.
Hospitalizations: the case of hospitalizations is similar to doctor visits.
There is a reduction in the contribution of income driven by a 28% reduc- tion in elasticity (plus the reduction in income inequality) but the PHIelas- ticity of the probability of utilization actually increases by 50%. In 2001 the contribution of PHIis statistically significant, but the lack of significance of the income contribution renders the HIinsignificant.
Emergencies:the HIindex is not statistically significant either in 1987 or 2001. But while in 1987 the contributions of income and PHIare both insig- nificant, in 2001 the contribution of PHIis positive and significant. This change is driven by a six fold increase in the size of the PHIelasticity of the probability of utilization as well as PHIbecoming more concentrated among the rich.
In addition to these three services, we have obtained evidence for the GPvisits and specialist visits separately for the year 2001 (unfortunately the data for 1987 does not distinguish between GPvisits and specialist visits).
The results are consistent with the evidence obtained by Van Doorslaer et al.
(2004), Rodríguez and Stoyanova (2004) and Jones, Koolman and Van Doorslaer (2007). That is, GPvisits are concentrated among the poor. This is not only due to need being concentrated among the poor, since the HI index is negative and significant. That is, the poor and those without PHI have more chances of visiting the GPthan the rich and/or PHIholders with the same level of need. Of course, this imbalance is compensated by the existence of a good degree of pro-rich inequity in the probability of visiting a specialist. Indeed, the inequity index for the probability of visiting a spe- cialist in 2001 is greater than any of the other HIindices presented in table 4.2. Note that roughly two fifths of this index is accounted by the contribu- tion of PHI.
pilar garcía gómez and ángel lópez nicolás
5. Discussion
and Conclusion
T
HE results presented in the previous section suggest that the Spanish health system seems to have achieved the goal of ensuring equal access to doctors, hospitals and emergency services for equal need. In fact, the reason why the HIindices for the three services are not statistically significant in 2001 is because the contribution of income is negative (total visits and emergencies) and or insignificant (all three services). With the necessary ca- veats derived from the fact that this is a pure before-after evaluation exer- cise, and at least as far as the point estimates suggest, it seems that the re- forms during the period 1987-2001 have reduced the income elasticity for the probabilities of utilization of the three services. Coupled with a reduc- tion in pure income inequality, this means that income, by 2001, does not lead to differences in utilization for the same level of need. This is clearly an improvement with respect to 1987, a year for which our estimates show a posi- tive and significant contribution of income to inequity in the access to doctors.On a closer look, however, we note that the contribution of PHIto inequality in utilization is positive and significant for the three services. The data reveal that tenure of PHIhas become more concentrated among the rich and, simultaneously, our estimates suggest an increase in the PHIelastic- ity of the probability of utilization for the three services. This leads to a pos- itive and significant contribution of PHIto our measure of inequity in 2001 for the three services. Moreover, if we consider the chances of visiting a spe- cialist in 2001, the data reveal a substantial degree of inequity with positive contributions of both income and PHI.
The implications of these findings for the policy goals stated in the Health Act of 1986 depend, firstly, on whether we can interpret the esti- mates for the contribution of PHIas a non-need variable, as we have done implicitly in our calculations. Are the estimates reflecting unmeasured need or are they reflecting improved access? As Jones, Koolman and Van
Doorslaer (2007) point out in the former case PHIshould not be included within the inequity index, but in the latter case PHIcan be normatively con- sidered an inequity-driving factor. Our choice for the latter interpretation
relies on the fact that the information contained in the National Health Sur- veys allows specifications where the assumption of conditional exogeneity for the tenure of PHIcan be justified. Moreover, Jones, Koolman and Van Doorslaer (2007) find that any remaining selection on unobservables seems to operate in the way of making low risks more likely to have PHI. This means that assignation of PHIto a randomly chosen individual might cause an increase in utilization larger than what our estimates suggest.
The second consideration is whether public policy should be concerned with the inequity effect of PHI. After all, the services afforded by PHIare privately provided. But the crucial point here is that these services are par- tially publicly financed through the tax bonuses to PHI. Must the public purse subsidize better access to some citizens? If so, does it matter that these citizens tend to be richer than the average? Obviously, equity is not the only relevant issue when assessing the adequacy of PHIsubsidies. Other consid- erations include the wish to support a private sector that might introduce competition in the health care market, or the wish to deviate demand to private outlets in order to decongest the public network. Concerning the latter, the evidence for the Spanish case (López-Nicolás and Vera-Hernán- dez, 2004) suggests that the subsidies are far from self-financing: their study shows that for each euro given away as a subsidy to the purchase of PHI, the public health care network experiences a reduction in utilisation worth 0,12
€. Similar evidence is available for the UK (Emmerson, Frayne and Good- man, 2001), where tax bonuses were eliminated recently.
While the overall picture obtained in this paper is that the Spanish National Health Service has advanced in the line of making access equita- ble, further research must find evidence to justify the subsidies to PHI, an element of the system that this research reveals to generate a significant de- gree of inequity.
pilar garcía gómez and ángel lópez nicolás
References
ABÁSOLOALESSON, I. (1998): “Equidad horizontal en la distribución del gasto público en sani- dad por grupos socioeconómicos en Canarias. Un estudio comparado con el conjunto es- pañol”,Hacienda Pública Española,147, 3-28.
CENTRO DEINVESTIGACIONESSOCIOLÓGICAS, Encuesta Nacional de Salud 1987.
— Encuesta Nacional de Salud 2001.
EMMERSON, C., C. FRAYNEand A. GOODMAN(2001): “Should Private Medical Insurance be Subsidized?”, Health Care UK. King’s Fund.
EUROPEANOBSERVATORY ONHEALTHCARESYSTEMS(2000): Health Care Systems in Transition.
Spain.
GRAVELLE, H. (2003): “Measuring Income Related Inequality in Health: Standardisation and the Partial Concentration Index”, Health Economics,12(10), 803-819.
JONES, A., X. KOOLMANand E. VANDOORSLAER(2007): “The Impact of Supplementary Private Health Insurance on the Use of Specialists in European Countries”, Annales d’Economie et de Statistiques, vol. 83.
LÓPEZNICOLÁS, A. and M. VERAHERNÁNDEZ(2004): “Are Tax Subsidies for Private Medical In- surance Self-Financing? Evidence from a Microsimulation Model for Outpatient and Inpa- tient Episodes”, University Pompeu Fabra, Economics and Business Working Paper #632.
MOSSIALOS, E. and S. M. S THOMSON(2002): “Voluntary Health Insurance in the European Union: a Critical Assessment”, International Journal of Health Services, 32(1), 19-88.
RODRÍGUEZ, M. and A. STOYANOVA(2004): “The Effect of Private Insurance Access on the Choice of GP Specialist and Public/Private Provider in Spain”, Health Economics,13(7), 689-704.
RODRÍGUEZ, M., S. CALONGEand J. REÑÉ(1993): “Spain”, in F. Rutten, E. Van Doorslaer and A.
Wagstaff (editors), Equity in the Finance and Delivery of Health Care. An international perspec- tive, Oxford University Press, New York.
SCHOKKAERT, E. and C. VAN DERVOORDE(2004): “Risk Selection and the Specification of the Risk Adjustment Formula”, Journal of Health Economics, 23(6), 1,237-1,259.
URBANOS, R. (2001): “Measurement of Inequity in the Delivery of Public Health Care: Evi- dence from Spain (1997)”, Fedea, Documento de Trabajo 2001-15.
— (1999): “Análisis y evaluación de la equidad horizontal interpersonal en la prestación pú- blica de servicios sanitarios. Un estudio del caso español para el periodo 1987-1995”, PhD. Thesis, Universidad Complutense de Madrid.
VANDOORSLAER, E. and A. JONES(2003): “Inequalities in Self-Reported Health: Validation of a New Approach to Measurement”, Journal of Health Economics, 22(1), 61-87.
— and X. KOOLMAN(2004): “Explaining the Differences in Income-Related Health Inequali- ties Across European Countries”, Health Economics, 13(7), 609-628.
— KOOLMANX. and F. PUFFER(2002): “Equity in the Use of Physician Visits in OECD Coun- tries: has Equal Treatment for Equal Need Been Achieved?”, in Measuring up: improving health systems performance in OECD countries, OECD, Paris.
— KOOLMANX. and A. JONES(2004): “Explaining Income-Related Inequalities in Doctor Uti- lisation in Europe”, Health Economics,13(7), 629-648.
KOOLMANX. and C. MASSERIA(2004): “Equity in the Delivery of Inpatient Care in the Euro- pean Union. A Pooled Analysis”, Ecuity Project III Working Paper #13, Department of Health Policy and Management, Erasmus University, Rotterdam.
VERA-HERNÁNDEZ, M. (1999): “Duplicate Coverage and the Demand for Health Care: The Case of Catalonia”, Health Economics,8(7), 579-598.
WAGGSTAFF, A., E. VANDOORSLAERand N. WATANABE(2003): “On Decomposing the Causes of Health Sector Inequalities with an Application to Malnutrition Inequalities in Vietnam”, Journal of Econometrics, 112(1), 207-223.
WAGGSTAFF, A. and E. VANDOORSLAER(1996): “Measuring and Testing for Inequity in the De- livery of Health Care”, School of Social Sciences, University of Sassex (mimeo)
WAGGSTAFF, A., E. VANDOORSLAERand P. PACI(1989): “Equity in the Finance and Delivery of Health Care: Some Tentative Cross-Country Comparisons”, Oxford Review of Economic Po- licy,5(1), 89-112.
pilar garcía gómez and ángel lópez nicolás
A B O U T T H E A U T H O R S *
PILAR GARCÍA GÓMEZholds an MSc in economics from the University of York and is a researcher at Centre de Recerca en Economia i Sa- lut (CRES). She is currently researching for her PhD thesis at Pompeu Fabra University. She has written several articles in the area of health economics.
E-mail: [email protected]
ÁNGEL LÓPEZ NICOLÁSholds a PhD in economics from the European University Institute (Florence). He is an associate professor of ap- plied economics at Pompeu Fabra University, currently in second- ment at the Polytechnic University of Cartagena, and a researcher at CRES. He has published several articles and book chapters in the areas of demand analysis, health economics and applied microecono- metrics.
E-mail: [email protected]
Any comments on the contents of this paper can be addressed to Ángel López at [email protected].
* This paper derives from the project “La dinámica del estado de salud y los factores socieconómicos a lo largo del ciclo vital. Implicaciones para las po- líticas públicas”, which is supported by the BBVA Foundation. We are grate- ful to Guillem López, Vicente Ortún, David Casado, Andrew Jones, Xander Koolman, Eddy van Doorslaer and participants at the 2004 ECuity II meeting in Helsinki for useful comments and suggestions. The views expressed in this paper are those of the authors and not necessarily those of the funders or the authors’ employers.
D O C U M E N T O S D E T R A B A J O
NÚMEROS PUBLICADOS
DT 01/02 Trampa del desempleo y educación: un análisis de las relaciones entre los efectos desincentivadores de las prestaciones en el Estado del Bienestar y la educación
Jorge Calero Martínez y Mónica Madrigal Bajo
DT 02/02 Un instrumento de contratación externa: los vales o cheques.
Análisis teórico y evidencias empíricas
Ivan Planas Miret
DT 03/02 Financiación capitativa, articulación entre niveles asistenciales y descentralización de las organizaciones sanitarias
Vicente Ortún-Rubio y Guillem López-Casasnovas
DT 04/02 La reforma del IRPF y los determinantes de la oferta laboral en la familia española
Santiago Álvarez García y Juan Prieto Rodríguez
DT 05/02 The Use of Correspondence Analysis in the Exploration of Health Survey Data
Michael Greenacre
DT 01/03 ¿Quiénes se beneficiaron de la reforma del IRPF de 1999?
José Manuel González-Páramo y José Félix Sanz Sanz
DT 02/03 La imagen ciudadana de la Justicia
José Juan Toharia Cortés
DT 03/03 Para medir la calidad de la Justicia (I): Abogados
Juan José García de la Cruz Herrero
DT 04/03 Para medir la calidad de la Justicia (II): Procuradores
Juan José García de la Cruz Herrero
DT 05/03 Dilación, eficiencia y costes: ¿Cómo ayudar a que la imagen de la Justicia se corresponda mejor con la realidad?
Santos Pastor Prieto
DT 06/03 Integración vertical y contratación externa en los servicios generales de los hospitales españoles
Jaume Puig-Junoy y Pol Pérez Sust
DT 07/03 Gasto sanitario y envejecimiento de la población en España
Namkee Ahn, Javier Alonso Meseguer y José A. Herce San Miguel
DT 01/04 Métodos de solución de problemas de asignación de recursos sanitarios
Helena Ramalhinho Dias Lourenço y Daniel Serra de la Figuera
DT 01/05 Licensing of University Inventions: The Role of a Technology Transfer Office
Inés Macho-Stadler, David Pérez-Castrillo y Reinhilde Veugelers
DT 02/05 Estimating the Intensity of Price and Non-