Once-Monthly Oral Ibandronate Improves Biomechanical Determinants of Bone Strength in Women With Postmenopausal Osteoporosis
E. Michael Lewiecki, Tony M. Keaveny, David Kopperdahl, Harry K. Genant, Klaus Engelke, Thomas Fuerst, Alan Kivitz, Richard Y. Davies, Lorraine A.
Fitzpatrick
New Mexico Clinical Research & Osteoporosis Center, Albuquerque, NM, USA (E.M.L.); University of California, Berkeley, CA, USA (T.M.K.); O.N. Diagnostics, Berkeley, CA, USA (T.M.K., D.K.); University of California, San Francisco, CA, USA (H.K.G.); Synarc, Inc, San Francisco, CA, USA (H.K.G., T.F.); Synarc, Inc, Hamburg, Germany and Institute of Medical Physics, University of Erlangen, Germany (K.E.); Altoona Arthritis and Osteoporosis Center, Duncansville, PA, USA (A.K.); and GlaxoSmithKline, King of Prussia, PA, USA (R.Y.D., L.A.F.) Corresponding author:
E. Michael Lewiecki, MD, FACP, FACE Osteoporosis Director
New Mexico Clinical Research & Osteoporosis Center 300 Oak Street NE
Albuquerque, NM 87106 Tel. (505) 855-5525 FAX (505) 884-4006 E-mail [email protected]
E.M.L. receives research grants from Amgen, Eli Lilly, Roche, GlaxoSmithKline, Merck, Novartis, Pfizer, Procter & Gamble, and Wyeth, owns stock in Procter &
Gamble, is an advisory board member for Amgen, Eli Lilly, Merck, Novartis, Procter & Gamble, Roche, GlaxoSmithKline, Servier, Wyeth, and Upsher-Smith, and is on speakers’ bureaus and receives honoraria from Eli Lilly, Novartis,
J Clin Endocrin Metab. First published ahead of print October 7, 2008 as doi:10.1210/jc.2008-1807
Roche, and GlaxoSmithKline. T.M.K. has equity ownership in and is the consulting Chief Science Officer of O. N. Diagnostics. He receives research grants from GlaxoSmithKline (to O. N. Diagnostics via Synarc, Inc), Pfizer, Eli Lilly, Novartis, Procter & Gamble, Merck, and Amgen, and consults for Merck, Lilly, Amgen, Pfizer, and Novartis. D.K. has equity ownership in and is Director of Research & Development of O. N. Diagnostics. H.K.G. is a Board of Directors member and stockholder of Synarc, Inc and is an advisory board and speaker’s bureau member (receiving honoraria) for GlaxoSmithKline. K.E. is an employee and stockholder of Synarc, Inc. T.F. and A.K. have nothing to declare. R.Y.D.
and L.F. are employees and stockholders of GlaxoSmithKline.
Word count: 3599
Running head: Ibandronate Effects on Bone Quality
Key words: osteoporosis, ibandronate, quantitative computed tomography, finite element analysis, hip structural analysis
Précis: Once-monthly oral ibandronate for 12 months in postmenopausal
osteoporosis improves hip and spine BMD measured by QCT and DXA and bone strength estimated by FEA.
ClinicalTrials.gov registration: NCT00148915
Portions of this work have been presented to the International Society for Clinical Densitometry (San Francisco, CA, USA, March 12–15, 2008), International Bone Density Workshop (Foggia, Italy, June 15–19, 2008), and American Society for Bone and Mineral Research (Montreal, Quebec, Canada, September 12–16,
Abstract.
Context. Bone strength and fracture resistance are determined by bone mineral density (BMD) and structural, mechanical, and geometric properties.
Design, Setting, and Objectives. This randomized, double-blind, placebo-
controlled outpatient study evaluated effects of once-monthly oral ibandronate on hip and lumbar spine BMD and calculated strength using quantitative computed tomography (QCT) with finite element analysis (FEA) and dual-energy x-ray absorptiometry (DXA) with hip structural analysis (HSA).
Participants were women aged 55–80 years with BMD T-scores ≤−2.0 to ≥−5.0 (N=93).
Intervention. Oral ibandronate 150 mg/mo (n=47) or placebo (n=46) was administered for 12 months.
Outcome measures. The primary endpoint was total hip QCT BMD change from baseline; secondary endpoints included other QCT BMD sites, FEA, DXA areal BMD, and HSA. All analyses were exploratory, with post hoc P values.
Results. Ibandronate increased integral total hip QCT BMD and DXA areal BMD more than placebo at 12 months (treatment differences: 2.2%, P=0.005; 2.0%, P=0.003). FEA-derived hip strength-to-density ratio and femoral, peripheral, and trabecular strength increased with ibandronate versus placebo (treatment
differences: 4.1%, P<0.001; 5.9%, P<0.001; 2.5%, P=0.011; 3.5%, P=0.003, respectively). Ibandronate improved vertebral, peripheral, and trabecular strength and anteroposterior bending stiffness versus placebo [7.1% (P<0.001), 7.8%
(P<0.001), 5.6% (P=0.023), and 6.3% (P<0.001), respectively]. HSA-estimated
femoral narrow neck cross-sectional area and moment of inertia and outer diameter increased with ibandronate versus placebo (respectively 3.6%, P=0.003; 4.0%, P=0.052; 2.2%, P=0.049).
Conclusions. Once-monthly oral Ibandronate for 12 months improved hip and spine BMD measured by QCT and DXA and strength estimated by FEA of QCT scans.
INTRODUCTION
Bone strength and fracture resistance in the hip and spine are determined by bone mineral density (BMD) and bone structural, mechanical, and geometric properties, collectively termed bone quality (1–3). Multiple studies have shown that therapeutic areal BMD improvements, measured by dual-energy X-ray absorptiometry (DXA), have a significant though nonlinear relationship with antifracture efficacy (reviewed in reference 4). Spatial BMD distribution, three- dimensional (3D) geometry, and bone turnover may exert effects not measured by areal BMD changes (5).
Trabecular and cortical bone are affected differently by postmenopausal osteoporosis (6), contribute variably to bone strength at different skeletal sites (3), and show distinguishable pharmacotherapeutic responses (7–9). High turnover in postmenopausal trabecular bone reduces its volume, density,
structural integrity, and strength, increasing the probability and severity of spine and hip fracture (5, 10–13). Postmenopausal cortical bone shows age-dependent thinning and weakening, endocortical surface losses, and increased porosity, increasing hip fracture risk (14). Bisphosphonates improve bone strength in
animals by preserving horizontal trabeculae (15) and increasing trabecular and cortical BMD (7). Histomorphometry in bisphosphonate–treated patients reveals increased trabecular volume and density (8, 16, 17). Reduced nonvertebral and hip fracture incidence with bisphosphonates (18–21) reflects action at
predominantly cortical sites.
DXA areal BMD is used to diagnose osteoporosis by World Health Organization criteria and follow up treated patients. Novel imaging techniques, such as quantitative computed tomography (QCT), complement DXA by distinguishing trabecular and cortical 3D BMD changes in osteoporosis and its treatment (4). In animals, baseline areal BMD is linearly related to hip and vertebral failure under load (4); bisphosphonate-induced areal BMD changes predict strength improvements (7). In human cadaveric studies, both areal and QCT BMD predict femoral and vertebral breaking strength (4). In patients, vertebral QCT BMD distinguishes between fractured and fracture-free
populations (2, 22) and increases with osteoporosis treatments (22, 23). Bone geometric parameters can also be assessed from QCT (24). Hip and spine QCT BMD and geometric parameters significantly improve in vitro failure load
predictions compared with DXA areal BMD (1, 4).
Finite element analysis (FEA), which calculates bone strength from QCT data, strongly predicts in vitro femoral and vertebral breaking strength (4, 25, 26).
Age-adjusted spine FEA differentiates patients with vertebral fractures from those without (2); hip FEA predicts new hip fractures in men (27) and hip fracture
locations and mechanisms in men and women (25). The FEA strength-to-density
ratio relates bone strength to BMD and can reveal when treatment increases strength beyond its BMD effect (3, 9).
Hip structural analysis (HSA) reconstructs femoral cross-sections from DXA data to determine geometric contributions to bone strength (28, 29). As areal BMD declines with age, compensatory changes such as increased outer diameter partially maintain hip mechanical properties, but cannot overcome endosteal resorption, resulting in cortical thinning and mechanical instability (28).
Contributions of bone reshaping and cortical thinning to fracture risk are not captured by traditional DXA results (28) but have been probed by HSA in population-based (29) and bisphosphonate studies (30).
Prospective fracture trials for osteoporosis treatments are resource- intensive; new surrogate markers of fracture risk and treatment efficacy are urgently needed (4). Structural and biomechanical parameters mechanistically related to fracture merit exploration as potential efficacy markers complementary to areal BMD. This study used two noninvasive imaging technologies—QCT and DXA—and two novel analytical methods—FEA of QCT data and HSA of DXA data—to evaluate structural effects of ibandronate at the hip and spine in postmenopausal women with osteoporosis. This is the first placebo-controlled bisphosphonate study to report FEA strength changes in both the hip and spine.
Objective
This study evaluated the effects of once-monthly oral ibandronate on hip 3D BMD and bone strength in postmenopausal women; lumbar spine BMD and strength were also assessed.
Patients and Methods Study design and ethics
This 1-year randomized, double-blind, placebo-controlled, parallel-group study was conducted in 13 US centers according to Good Clinical Practice and the Declaration of Helsinki. Planned enrollment was 100 women (50/group).
Ethical committee approval was obtained for each site. All participants gave written informed consent.
The primary outcome measurement was total hip QCT BMD change from baseline to 12 months. Secondary outcomes included hip and spine FEA
strength, hip and lumbar spine DXA areal BMD, hip HSA, lumbar spine QCT BMD, and serum C-terminal cross-linking telopeptide of type I collagen (sCTX) and bone-specific alkaline phosphatase (BSAP) changes in relation to bone quality measurements.
Participant selection
Women aged 55–80 years (≥12 months without menses or ≥6 weeks post- oophorectomy) with BMD T-scores ≤−2.0 (lumbar spine, total hip, or femoral neck) and ≥−5.0 (all sites) were eligible. Vertebral fractures, hip implants, major gastrointestinal lesions, diseases or medications affecting bone metabolism, or history of non-basal-cell cancer resulted in exclusion.
Treatment
Participants were randomized 1:1 to receive oral ibandronate 150 mg or placebo once monthly for 12 months; all received 1000 mg/day calcium and 400
Assessments
DXA. Lumbar spine and hip DXA scans were performed at screening and Month 12 or early termination. Screening scans were read locally for BMD eligibility, then centrally analyzed at Synarc, Inc for baseline and posttreatment BMD.
CT scan acquisition. Two adjacent lumbar vertebrae (L1–L2, or if either was nonevaluable, T12–L1 or L2–L3) and the left hip were CT-scanned at baseline and final visits. Spine scans used 120 kV, 100 mAs, 1 mm slice
thickness, reconstruction field of view 360 mm, and a medium body kernel. The proximal femur was scanned from above the femoral head to a point 1 cm distal to the lesser trochanter. Femoral scans used 170 mAs and two tomographic reconstructions with different fields of view (QCT, 200 mm; FEA, 400 mm); other settings were the same as for the spine. Patients were scanned atop a phantom (Mindways Software Inc, Austin, TX, USA) to calibrate CT values to BMD.
QCT. Central 3D QCT was analyzed collaboratively by Synarc, Inc and the University of Erlangen Institute of Medical Physics. This analysis combined 3D automated segmentation (31) with anatomic coordinate systems (31, 32) to define volumes of interest (VOIs). In each VOI, integral, trabecular, and cortical BMD were determined. QCT geometric parameters were also determined.
The proximal femur was separated as for DXA into neck, trochanter, and intertrochanter VOIs (Figure 1). Spinal VOIs were nested subsets: the total vertebral body VOI, the osteo VOI (excluding the posterior portion), and the cylinder VOI (a trabecular region within the osteo VOI). Each spinal VOI was
subdivided into superior, middle, and inferior sections. Midsection results for total vertebral body and cylinder VOI are included here; other subsections are
reported elsewhere (33).
Compartments within each VOI included cortical, all cortical bone defined by automatic segmentation of the periosteal and endosteal surfaces (31),
trabecular, all trabecular bone within a volume determined by uniformly eroding the endosteal surface to a depth of 1.5 mm, and integral, all bone within the periosteal surface.
FEA. Finite element models of each patient’s lumbar vertebrae were generated from digitized QCT scans using custom software (O.N. Diagnostics, Berkeley, CA, USA) and published methods (2, 9). Each vertebra image (omitting posterior elements) was placed into a coordinate system and converted into a mesh of 1 x 1 x 1 mm3 8-node finite elements. Calibrated QCT BMD of each element was converted into anisotropic material properties (9, 26). The model simulates and has been validated against an in vitro compressive-strength test (26). Each bone was virtually compressed to failure using nonlinear FEA.
Vertebral strength was read from the force-deformation curve at 2% deformation.
To maximize precision in longitudinal FEA comparisons, custom registration algorithms aligned each patient’s follow-up model to her baseline model.
The main spine FEA outcome was vertebral strength. Strength-to-density ratio (vertebral strength divided by average BMD) and anteroposterior bending stiffness (simulating 1º pure rotation of each vertebral endplate) were also determined. Trabecular strength was isolated by recomputing vertebral strength
after removing the outer 2 mm of bone (peripheral compartment: thin cortical shell and adjacent bone). Peripheral strength was the difference between vertebral and trabecular strength. Geometric strength was computed by
assigning an arbitrary reference density throughout the model (9). Homogenized strength was determined by assigning the average density of each vertebra throughout the vertebra (9).
Hip FEA followed a similar approach, described in detail elsewhere (34), using cubical 8-node elements (1.5 mm/side) and modeling bone material as isotropic but having asymmetric tension–compression strength properties.
Boundary conditions simulating sideward falling (femoral diaphysis angled 15º from the ground with 15º internal rotation) were derived from prior cadaveric and FEA studies (25, 35).
The main hip FEA outcome was femoral strength. To avoid domination by more distal cortical density, the hip strength-to-density ratio calculation included only bone proximal to the base of the lesser trochanter. Controlled parameter studies examined peripheral, trabecular, and geometric strength. The peripheral compartment contained all bone of apparent density >1 g/cm3 and all bone within 3 mm from the periosteal surface regardless of density. The trabecular
compartment comprised all bone not in the peripheral compartment, i.e.
trabecular bone >3 mm from the periosteal surface. Peripheral strength was determined by assigning a reference density to the trabecular compartment.
Trabecular strength was determined by assigning a reference density to the
peripheral compartment. Geometric strength was determined by applying an arbitrary reference density to all elements (9).
HSA. HSA computed geometric parameters from DXA data at cross sections of the narrow neck, intertrochanter region, and proximal femoral shaft (2 cm distal to midpoint of lesser trochanter) (29).
Bone turnover markers. sCTX and BSAP were assessed at baseline and Months 3, 6, 9, and 12. After an overnight fast, blood was drawn between 8 and 10 am before scheduled study drug dosing and automatically analyzed by a 2- site monoclonal antibody assay for sCTX (Elecsys, Roche Diagnostics,
Mannheim, Germany) and immunochemiluminescence for BSAP (Ostase, Access, Beckman Coulter, Fullerton, CA, USA).
Statistical analysis
All analyses were exploratory and utilized post hoc P values not adjusted for multiple comparisons; no formal comparisons were conducted. Imaging parameters were generally normally distributed. Statistical analyses were undertaken by GlaxoSmithKline Biostatistics and Programming (Philadelphia, PA, USA).
Mean percent change from baseline in QCT BMD, FEA, DXA areal BMD, and HSA parameters were summarized by descriptive statistics. Treatment differences were determined using an analysis of covariance model adjusting for center and baseline value. Within- and between-group changes were determined from this model as least-squares (LS) means and 95% confidence intervals (CIs).
Scatterplots relating changes in DXA areal BMD to changes in FEA strength
parameters were created, and Spearman’s correlation coefficients were calculated.
When describing within-group changes in efficacy parameters, the word
“significant” denotes a change whose associated 95% confidence interval excludes zero.
Bone turnover marker levels were summarized by median percent change from baseline and interquartile ranges; scatterplots of the relationship between short-term changes (3 months) in biomarkers and longer-term changes (12 months) in QCT and FEA measures were created, and Spearman’s correlation coefficients were calculated.
RESULTS
Participants’ characteristics
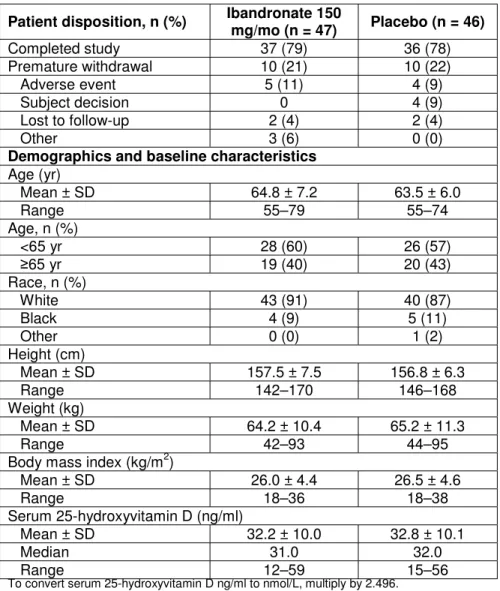
Ninety-eight women were randomized; 93 qualified for the intent-to-treat (ITT) population (Table 1). Baseline fracture risk factors were characterized in the ITT population. Maternal fracture history was reported by 23% of ibandronate
recipients and 30% of placebo recipients; personal fracture history, by 19% and 26%, respectively. Current smokers comprised 11% of ibandronate recipients and 15% of placebo recipients. More ibandronate than placebo recipients were former smokers: 38% vs. 17%. Four women per group reported falling in the past year. 85% of ibandronate recipients and 83% of placebo recipients were ≥80%
compliant with medication. Baseline QCT, FEA, and DXA measurements appear in Table 2.
QCT findings
Hip BMD. Thirty-nine ibandronate and 32 placebo recipients had
evaluable hip QCT BMD change-from-baseline results (Figures 2A and 2B). The primary endpoint, integral total hip QCT BMD, increased 2.2% more from
baseline with ibandronate than placebo (P=0.005) (Figure 2A). Ibandronate also increased QCT BMD significantly versus placebo in the trabecular total hip (treatment difference, 4.4%, P=0.017), integral femoral neck (1.9%, P=0.012), and integral and trabecular trochanter (respectively 3.0%, P=0.003, and 7.0%, P=0.036; Figure 2A). In within-group changes from baseline (Figure 2B), placebo patients showed mean 12-month declines in hip BMD parameters (Figure 2A), which were significant at the integral femoral neck. Ibandronate patients, in contrast, maintained or increased mean hip BMD parameters over 12 months, showing significant within-group increases in integral and trabecular total hip and trochanter BMD (Figure 2B). Geometric QCT parameters, such as cortical
thickness, smallest cross-sectional neck area, or moments of inertia of the central neck, showed no significant treatment differences (data not shown).
Spine BMD. Forty-one ibandronate and 35 placebo recipients had
evaluable lumbar spine QCT BMD change-from-baseline results (Figures 2C and 2D). Significant between-treatment differences favoring ibandronate occurred in the integral and trabecular total vertebral body (respectively 4.4%, P=0.001 and 4.2%, P=0.024) and the integral total vertebral body midsection (4.0%, P=0.011;
Figure 2C). These treatment differences reflected ibandronate-induced within- group increases in lumbar spine BMD at 12 months (significant for the integral
total vertebral body and integral vertebral body midsection) versus maintained or nonsignificantly declining BMD parameters with placebo (Figure 2D).
FEA results
Hip strength. Thirty-six ibandronate and 35 placebo recipients had
evaluable change-from-baseline hip FEA strength measurements (Figure 3A and 3B). Ibandronate increased all hip FEA parameters versus placebo (treatment strength differences: femoral, 5.9%, P<0.001; peripheral, 2.5%, P=0.011;
trabecular, 3.5%, P=0.003; geometric, 1.5%, P=0.017; strength-to-density ratio, 4.1%, P<0.001; Figure 3A). Within-group femoral and trabecular strength and strength-to-density ratio declined significantly over 12 months with placebo but were maintained by ibandronate (Figure 3B).
Spine strength. Thirty-nine ibandronate and 38 placebo recipients had evaluable change-from-baseline spine FEA strength parameters (Figures 3C and 3D). Ibandronate increased all spine FEA parameters except geometric strength and strength-to-density ratio versus placebo (treatment differences: vertebral strength, 7.1%, P<0.001; trabecular strength, 5.6%, P=0.023; peripheral strength, 7.8%, P<0.001; homogenized strength, 8.3%, P<0.001; vertebral anteroposterior bending stiffness, 6.3%, P<0.001; Figure 3C). In within-group changes (Figure 3D), placebo recipients experienced significant mean 12-month declines in vertebral, trabecular, and homogenized strength and vertebral anteroposterior bending stiffness. Ibandronate recipients showed 12-month increases in these parameters, which were significant for vertebral, peripheral, and homogenized strength and vertebral anteroposterior bending stiffness (Figure 3D).
DXA findings
Hip areal BMD. Forty-five ibandronate and 41 placebo recipients had evaluable change-from-baseline DXA data. Total hip areal BMD increased 2.0%
more with ibandronate than placebo (95% CI, 0.7% to 3.3%; P=0.003); greater trochanter and intertrochanter areal BMD also showed significant treatment differences favoring ibandronate (respectively 3.3%, 95% CI 1.4% to 5.2%, P=0.001; 1.7%, 95% CI 0.3% to 3.0%, P=0.017). Femoral neck and Ward’s triangle areal BMD changes did not differ significantly between groups.
Spine areal BMD. Lumbar spine areal BMD increased 4.3% more with ibandronate than placebo (95% CI, 2.3% to 6.2%; P<0.001), reflecting mean percent changes from baseline of 4.0% (95% CI, 2.5% to 5.6%) with ibandronate and −0.2% (95% CI, −1.7% to 1.3%) with placebo.
Correlations.Individual patients’ areal BMD changes from baseline were moderately correlated with FEA parameter changes, with Spearman’s correlation coefficients of 0.43 for total spine areal BMD vs. vertebral strength, 0.39 for total hip areal BMD vs. femoral strength, 0.30 for femoral neck areal BMD vs. femoral strength, and 0.36 for greater trochanter areal BMD vs. femoral strength.
Moderate correlations existed between changes in total hip areal BMD and integral hip QCT BMD (R=0.45), integral femoral neck QCT BMD (R=0.50), and integral trochanter QCT BMD (R=0.41).
Hip structural analysis
Forty-two ibandronate and 37 placebo recipients had evaluable change- from-baseline HSA results. In the femoral narrow neck, cross-sectional area
(CSA), outer diameter, and cross-sectional moment of inertia (CSMI) increased with ibandronate versus placebo (treatment differences respectively 3.6%, P=0.003; 2.2%, P=0.049; 4.0%, P=0.052). Other HSA parameters and regions did not differ significantly between treatments (data not shown). Within-group changes showed significant ibandronate-induced increases from baseline in narrow neck CSA, outer diameter, and endosteal diameter as well as
intertrochanter CSMI and CSA. Placebo patients showed mean within-group declines in most HSA parameters, which were significant for narrow neck CSA and average cortical thickness.
Bone turnover markers
Ibandronate induced greater absolute decreases from baseline than placebo at each 3-month timepoint in the bone resorption marker sCTX and the bone formation marker BSAP (Figure 4). sCTX median changes at 12 months were −62.8% (ibandronate) vs. +2.7% (placebo); corresponding BSAP changes were −34.1% (ibandronate) vs. −6.7% (placebo). Patients’ biomarker changes correlated modestly with their FEA femoral and vertebral strength changes (sCTX: R=−0.48 femoral, −0.54 vertebral; BSAP: R=−0.44 femoral, −0.46
vertebral). Correlations with hip QCT BMD were numerically lower (sCTX: −0.36 to −0.41 for trabecular BMD parameters vs. −0.17 to −0.23 for cortical
parameters; BSAP: −0.16 to −0.33 trabecular vs. −0.17 to −0.29 cortical.)
DISCUSSION
Reported here is the first clinical trial combining the 3D techniques of QCT and FEA and the 2D techniques of DXA and HSA to assess densitometric and structural effects of bisphosphonate treatment (once-monthly oral ibandronate) on both the hip and spine in postmenopausal osteoporosis. Ibandronate
increased hip and spine integral and trabecular BMD significantly versus
placebo. Femoral and vertebral whole bone strength determined by FEA of QCT data improved with ibandronate, as did trabecular compartment strength.
Peripheral and homogenized strength in the spine showed large and significant treatment differences favoring ibandronate; thus, ibandronate strengthened vertebrae through effects on cortical and adjacent trabecular bone and on spatial bone density distribution. Strength-to-density ratio and geometric strength
significantly improved with ibandronate for the hip but not the spine, indicating some unique structural effects on the hip. Ibandronate’s HSA effects were confined largely to the femoral narrow neck. Other femoral sites showed trends toward HSA improvement, suggesting insufficient statistical power to
demonstrate 12-month HSA change.
Trabecular effects drove ibandronate-induced hip QCT BMD increases.
Placebo recipients lost integral and trabecular BMD in femoral regions at 12 months, while ibandronate recipients maintained or increased these parameters.
This pattern was expected because the postmenopausal bone turnover increase causes trabecular bone loss (10), and the trabecular compartment responds to bisphosphonate suppression of turnover (15-17). Indeed, our ibandronate group
showed pronounced sCTX and BSAP suppression at 3, 6, 9, and 12 months. In spine QCT, ibandronate-induced increases in the osteo and cylinder VOIs were smaller than expected, indicating nonuniform response in the vertebral trabecular compartments. Ibandronate affected primarily trabecular regions outside the vertebral center. Density gains toward the vertebral periphery are expected to improve resistance to bending and twisting forces, as our FEA results
demonstrated.
Ibandronate’s effects on FEA strength parameters indicated improved fracture resistance because the virtual loadings used in FEA simulated common modes of hip and vertebral fracture. Femoral and vertebral strength increases reflected significant ibandronate effects on both peripheral and trabecular strength. Femoral strength declined significantly from baseline to 12 months (within-group change of −4.0%) in the placebo group, whereas it was maintained in the ibandronate group (mean increase of 2.0%, with 95% CI including zero). A robust increase in the FEA strength-to-density ratio at the hip but not the spine indicated that ibandronate improved femoral strength beyond its effect on BMD (3). In the Forteo Alendronate Comparator Trial (FACT) study, in contrast,
alendronate or teriparatide increased the strength-to-density ratio at the spine (9) but not the hip (23). Sequential treatment with 1 year of parathyroid hormone followed by 1 year of alendronate in the Parathyroid Hormone and Alendronate (PaTH) study resulted in a significant femoral strength increase (5.6%, P<0.05) from baseline (34).
In spine FEA, vertebral peripheral strength increases with ibandronate compare well to in vitro studies indicating cortical load-bearing in the midvertebral region (36). Since the trabecular density effects of ibandronate were localized outside the vertebral center, effects conferring peripheral FEA strength may concentrate in the pericortical trabecular bone of the vertebral midsection.
Vertebral strength declined by 3.0% over 12 months in placebo patients, as compared with the 0.83% annual vertebral strength decrease determined in a previous cadaveric study (37). Thus, even with vitamin D and calcium
supplementation, untreated postmenopausal women in our study lost vertebral strength faster than previously estimated. Ibandronate recipients, in contrast, significantly increased vertebral strength at 12 months.
Ibandronate’s HSA effects were confined to the narrow neck, where the CSA, outer diameter, and CSMI increased with ibandronate versus placebo.
Other HSA parameters and regions did not differ between groups. This observation was consistent with our 3D geometric analysis of QCT data. In contrast, a 12-month risedronate study in women with breast cancer (30) and a 3-year study of postmenopausal hormone treatment with or without alendronate showed bisphosphonate effects on multiple HSA parameters (38). The effect size on narrow neck CSA with 1 year of monthly oral ibandronate (3.6%, P<0.001) compares well with published results for 18 months of teriparatide (3.5%) (39) or 3 years of alendronate plus hormone therapy (6.9%) (38). Retrospective HSA analysis of DXA data from the BONE study showed significant improvement with 2.5 mg/day oral ibandronate for 3 years versus placebo in CSA, CSMI, cortical
thickness, and buckling ratio at all 3 HSA sites, suggesting that ibandronate improves hip structure with long-term use (40).
CONCLUSIONS
Once-monthly ibandronate treatment for 12 months significantly increased integral total hip QCT BMD, the primary endpoint, versus placebo in
postmenopausal women. Significant QCT BMD treatment differences in favor of ibandronate also occurred in integral and trabecular bone at multiple hip and spine sites. Ibandronate improved multiple FEA indices of hip and spine strength, reversing 12-month vertebral strength losses seen with placebo and maintaining femoral strength. DXA areal BMD increased with ibandronate in the total hip, trochanter, and lumbar spine. Ibandronate effects on HSA indices were specific to the femoral narrow neck. Our analysis with QCT, FEA, DXA, and HSA
indicates that once-monthly oral ibandronate significantly improved hip and spine BMD as measured by QCT and DXA and bone strength as estimated by FEA of the QCT scans.
ACKNOWLEDGMENTS
This study was sponsored by Roche and GlaxoSmithKline.
The authors acknowledge the editorial assistance of Kim Coleman Healy, PhD, of Envision Pharma, Southport, CT, USA, in the preparation of this manuscript.
Dr. Keaveny has a financial interest in O.N. Diagnostics, and both he and the company may benefit from the results of this research.
REFERENCES
1. Bousson V, Le Bras A, Roqueplan F, Kang Y, Mitton D, Kolta S, Bergot C, Skalli W, Vicaut E, Kalender W, Engelke K, Laredo JD 2006 Volumetric quantitative computed tomography of the proximal femur:
relationships linking geometric and densitometric variables to bone strength. Role for compact bone. Osteoporos Int 17:855-864
2. Melton LJ, 3rd, Riggs BL, Keaveny TM, Achenbach SJ, Hoffmann PF, Camp JJ, Rouleau PA, Bouxsein ML, Amin S, Atkinson EJ, Robb RA, Khosla S 2007 Structural determinants of vertebral fracture risk. J Bone Miner Res 22:1885-1892
3. Hernandez CJ, Keaveny TM 2006 A biomechanical perspective on bone quality. Bone 39:1173-1181
4. Bouxsein MR, Delmas PD 2008 Considerations for the development of surrogate endpoints for antifracture efficacy of new treatments in
osteoporosis: a perspective. J Bone Miner Res 23:1155-7
5. Hernandez CJ. 2008. How can bone turnover modify bone strength independent of bone mass? Bone 42:1014-20
6. Sornay-Rendu E, Boutroy S, Munoz F, Delmas PD 2007 Alterations of cortical and trabecular architecture are associated with fractures in postmenopausal women, partially independent of decreased BMD measured by DXA: the OFELY study. J Bone Miner Res 22:425-433 7. Bauss F, Dempster DW 2007 Effects of ibandronate on bone quality:
preclinical studies. Bone 40:265-273
8. Gasser JA, Ingold P, Venturiere A, Shen V, Green JR 2008 Long-term protective effects of zoledronic acid on cancellous and cortical bone in the ovariectomized rat. J Bone Miner Res 23:544-551
9. Keaveny TM, Donley DW, Hoffmann PF, Mitlak BH, Glass EV, San Martin JA 2007 Effects of teriparatide and alendronate on vertebral strength as assessed by finite element modeling of QCT scans in women with osteoporosis. J Bone Miner Res 22:149-157
10. Hernandez CJ, Gupta A, Keaveny TM 2006 A biomechanical analysis of the effects of resorption cavities on cancellous bone strength. J Bone Miner Res 21:1248-1255
11. Genant HK, Delmas PD, Chen P, Jiang Y, Eriksen EF, Dalsky GP, Marcus R, San Martin J 2007 Severity of vertebral fracture reflects deterioration of bone microarchitecture. Osteoporos Int 18:69-76
12. Eriksen EF, Hodgson SF, Eastell R, Cedel SL, O'Fallon WM, Riggs BL 1990 Cancellous bone remodeling in type I (postmenopausal)
osteoporosis: quantitative assessment of rates of formation, resorption, and bone loss at tissue and cellular levels. J Bone Miner Res 5:311-319 13. Tsangari H, Findlay DM, Fazzalari NL 2007 Structural and remodeling indices in the cancellous bone of the proximal femur across adulthood.
Bone 40:211-217
14. Epstein S 2007 Is cortical bone hip? What determines cortical bone properties? Bone 41:S3-8
15. Borah B, Dufresne TE, Chmielewski PA, Gross GJ, Prenger MC, Phipps RJ 2002 Risedronate preserves trabecular architecture and increases bone strength in vertebra of ovariectomized minipigs as measured by three-dimensional microcomputed tomography. J Bone Miner Res 17:1139-47
16. Recker RR, Weinstein RS, Chesnut CH, 3rd, Schimmer RC, Mahoney P, Hughes C, Bonvoisin B, Meunier PJ 2004 Histomorphometric
evaluation of daily and intermittent oral ibandronate in women with
postmenopausal osteoporosis: results from the BONE study. Osteoporos Int 15:231-237
17. Recker RR, Delmas PD, Halse J, Reid IR, Boonen S, Garcia-
Hernandez PA, Supronik J, Lewiecki EM, Ochoa L, Miller P, Hu H, Mesenbrink P, Hartl F, Gasser J, Eriksen EF 2008 Effects of
intravenous zoledronic acid once yearly on bone remodeling and bone structure. J Bone Miner Res 23:6-16
18. McClung MR, Geusens P, Miller PD, Zippel H, Bensen WG, Roux C, Adami S, Fogelman T, Diamond T, Eastell R, Meunier PJ, Reginster JY, Hip Intervention Program Study Group 2001 Effect of risedronate on the risk of hip fracture in elderly women. Hip Intervention Program Study Group. N Engl J Med 344:333-40
19. Silverman SL, Watts NB, Delmas PD, Lange JL, Lindsay R 2007 Effectiveness of bisphosphonates on nonvertebral and hip fractures in the
first year of therapy: the risedronate and alendronate (REAL) cohort study.
Osteoporos Int 18:25-34
20. Watts NB, Worley K, Solis A, Doyle J, Sheer R 2004 Comparison of risedronate to alendronate and calcitonin for early reduction of fracture risk: results from a managed care administrative claims database. J Manag Care Pharm 10:142-51
21. Harris ST, Blumentals WA, Miller PD 2008 Ibandronate and the risk of non-vertebral and clinical fractures in women with postmenopausal osteoporosis: results of a meta-analysis of phase III studies. Curr Med Res Opin 24:237-45
22. Engelke K, Adams JE, Armbrecht G, Augat P, Bogado CE, Bouxsein ML, Felsenberg D, Ito M, Prevrhal S, Hans DB, Lewiecki EM 2008 Clinical use of quantitative computed tomography and peripheral
quantitative computed tomography in the management of osteoporosis in adults: the 2007 ISCD Official Positions. J Clin Densitom 11:123-162 23. Keaveny TM, Hoffmann PF, Kopperdahl DL, Donley DW, Krohn K,
Glass EV, Mitlak BH 2007 Comparison of the effects of teriparatide and alendronate on parameters of total hip strength as assessed by finite element analysis: results from the Forteo and Alendronate Comparison Trial [abstract 1089]. J Bone Miner Res 22 Suppl 1:S26
24. Prevrhal S, Shepherd JA, Faulkner KG, Gaither KW, Black DM, Lang TF 2008 Comparison of DXA hip structural analysis with volumetric QCT.
J Clin Densitom 11:232-236
25. Keyak JH 2001 Improved prediction of proximal femoral fracture load using nonlinear finite element models. Med Eng Phys 23:165-173 26. Crawford RP, Cann CE, Keaveny TM 2003 Finite element models
predict in vitro vertebral body compressive strength better than quantitative computed tomography. Bone 33:744-750
27. Orwoll ES Marshall LM, Nielson CM, Cummings SR, Lapidus J,
Cauley JA, Ensrud K, Lane N, Hoffmann PF, Kopperdahl DL, Keaveny TM 2008 Finite element analysis of the proximal femur and hip fracture risk in older men. J Bone Miner Res, in press.
28. Bonnick SL 2007 HSA: beyond BMD with DXA. Bone 41:S9-12
29. Beck TJ, Looker AC, Ruff CB, Sievanen H, Wahner HW 2000 Structural trends in the aging femoral neck and proximal shaft: analysis of the Third National Health and Nutrition Examination Survey dual-energy X-ray absorptiometry data. J Bone Miner Res 15:2297-2304
30. van Londen GJ, Perera S, Vujevich KT, Sereika SM, Bhattacharya R, Greenspan SL 2008 Effect of risedronate on hip structural geometry: a 1- year, double-blind trial in chemotherapy-induced postmenopausal women.
Bone 43:274-278
31. Mastmeyer A, Engelke K, Fuchs C, Kalender WA 2006 A hierarchical 3D segmentation method and the definition of vertebral body coordinate systems for QCT of the lumbar spine. Med Image Anal 10:560-577
32. Kang Y, Engelke K, Fuchs C, Kalender WA 2005 An anatomic coordinate system of the femoral neck for highly reproducible BMD measurements using 3D QCT. Comput Med Imaging Graph 29:533-541 33. Engelke K, Fuerst T, Enslin MB, Davies RY, Fitzpatrick LA, Ethgen D,
Genant HK 2008 Regional differences of spinal BMD changes after one year once-monthly ibandronate as measured by 3D QCT [presentation 08- 3]. Paper presented at the International Bone Density Workshop, June 15–19, 2008, Foggia, Italy
34. Keaveny TM, Hoffmann PF, Singh M, Palermo L, Bilezikian JP,
Greenspan SL, Black DM 2008 Femoral bone strength and its relation to cortical and trabecular changes after treatment with PTH, alendronate, and their combination as assessed by finite element analysis of QCT scans. J Bone Miner Res: Electronically published ahead of print August 6, 2008
35. Pinilla TP, Boardman KC, Bouxsein ML, Myers ER, Hayes WC 1996 Impact direction from a fall influences the failure load of the proximal femur as much as age-related bone loss. Calcif Tissue Int 58:231-235 36. Eswaran SK, Gupta A, Adams MF, Keaveny TM 2006 Cortical and
trabecular load sharing in the human vertebral body. J Bone Miner Res 21:307-314
37. Mosekilde L, Mosekilde L 1990 Sex differences in age-related changes in vertebral body size, density and biomechanical competence in normal individuals. Bone 11:67-73
38. Greenspan SL, Beck TJ, Resnick NM, Bhattacharya R, Parker RA 2005 Effect of hormone replacement, alendronate, or combination therapy on hip structural geometry: a 3-year, double-blind, placebo-controlled clinical trial. J Bone Miner Res 20:1525-1532
39. Uusi-Rasi K, Semanick LM, Zanchetta JR, Bogado CE, Eriksen EF, Sato M, Beck TJ 2005 Effects of teriparatide [rhPTH (1-34)] treatment on structural geometry of the proximal femur in elderly osteoporotic women.
Bone 36:948-958
40. Fuerst T, Beck TJ, Gaither K, Kothari M, Genant HK 2006 Effect of oral ibandronate on hip structure: results from the BONE study [abstract
Su323]. J Bone Miner Res 21 Suppl 1:S287.
Figure Legends
Figure 1. VOIs for QCT studies.
A and B: proximal femur; A, axial view; B, coronal view. The periosteal and endosteal surfaces, visualized as contours, define the cortical compartments.
Peeling the endosteal surface by 1.5 mm towards the inside of the bone defines the corresponding trabecular VOI. For clarity, the peeled surfaces are not shown.
C and D: lumbar spine. C, axial view showing cylindrical, osteo, and total vertebral body VOIs; D, coronal view. For the total vertebral body, the integral VOI is outlined in heavy black solid lines, the cortical compartment is the VOI between the heavy black and outer dashed surfaces, and the trabecular compartment is the VOI inside the inner dashed surface, which is peeled from the outer dashed surface to a depth of 1.5 mm.
Figure 2. BMD determined by QCT. A and B: proximal femur. A, treatment differences (ibandronate [IBN] minus placebo) in mean percent changes from baseline to 12 months (least-squares means and 95% CI). B, within-group mean percent changes from baseline to 12 months (least-squares means and 95% CI).
Significant increases are denoted by asterisks; significant decreases are denoted by daggers. C and D: lumbar spine. C, treatment differences (ibandronate [IBN]
minus placebo) in mean percent changes in spine BMD determined by QCT from baseline to 12 months (least-squares means and 95% CI). D, within-group mean
percent changes from baseline to 12 months (least-squares means and 95% CI).
Significant increases are denoted by asterisks.
Figure 3. Strength parameters estimated by FEA. A and B: proximal femur. A, treatment differences (ibandronate [IBN] minus placebo) in mean percent
changes from baseline to 12 months (least-squares means and 95% CI). B, within-group mean percent changes from baseline to 12 months (least-squares means and 95% CI). Significant increases from baseline denoted by asterisks;
significant decreases from baseline denoted by daggers. C and D: lumbar spine.
C, treatment differences (ibandronate [IBN] minus placebo) in mean percent changes in spine strength assessed by FEA from baseline to 12 months (least- squares means and 95% CI). D, within-group change from baseline to 12 months (least-squares means and 95% CI). Significant increases from baseline denoted by asterisks; significant decreases from baseline denoted by daggers.
Figure 4. Serum bone turnover marker levels over time in the intent-to-treat population by treatment group (median percentage changes from baseline, with interquartile ranges). Top panel: sCTX; bottom panel:
serum BSAP. ET = early termination; IBN = ibandronate.
Table 1. Patient disposition and baseline characteristics (intent-to-treat population)
Patient disposition, n (%) Ibandronate 150
mg/mo (n = 47) Placebo (n = 46)
Completed study 37 (79) 36 (78)
Premature withdrawal 10 (21) 10 (22)
Adverse event 5 (11) 4 (9)
Subject decision 0 4 (9)
Lost to follow-up 2 (4) 2 (4)
Other 3 (6) 0 (0)
Demographics and baseline characteristics Age (yr)
Mean ± SD 64.8 ± 7.2 63.5 ± 6.0
Range 55–79 55–74
Age, n (%)
<65 yr 28 (60) 26 (57)
≥65 yr 19 (40) 20 (43)
Race, n (%)
White 43 (91) 40 (87)
Black 4 (9) 5 (11)
Other 0 (0) 1 (2)
Height (cm)
Mean ± SD 157.5 ± 7.5 156.8 ± 6.3
Range 142–170 146–168
Weight (kg)
Mean ± SD 64.2 ± 10.4 65.2 ± 11.3
Range 42–93 44–95
Body mass index (kg/m2)
Mean ± SD 26.0 ± 4.4 26.5 ± 4.6
Range 18–36 18–38
Serum 25-hydroxyvitamin D (ng/ml)
Mean ± SD 32.2 ± 10.0 32.8 ± 10.1
Median 31.0 32.0
Range 12–59 15–56
To convert serum 25-hydroxyvitamin D ng/ml to nmol/L, multiply by 2.496.
Table 2. Baseline QCT, FEA, and DXA measurements (means ± SD).
Ibandronate 150
mg/mo (n = 47) Placebo (n = 46) QCT-derived BMD (g/cm3)
Total hip n = 45 n = 45
Integral 242 ± 44 249 ± 35
Trabecular 84 ± 32 91 ± 24
Cortical 548 ± 81 555 ± 73
Femoral neck n = 45 n = 45
Integral 282 ± 52 296 ± 47
Trabecular 105 ± 39 115 ± 33
Cortical 547 ± 74 564 ± 73
Trochanter n = 45 n = 45
Integral 194 ± 35 201 ± 31
Trabecular 63 ± 31 72 ± 21
Cortical 441 ± 65 447 ± 69
Total vertebral body n = 41 n = 35
Integral 172 ± 26 179 ± 26
Trabecular 104 ± 23 109 ± 23
Vertebral body midsection n = 41 n = 35
Integral 145 ± 27 150 ± 26
Osteo VOI midsection n = 41 n = 35
Trabecular 94 ± 23 99 ± 24
Cortical 330 ± 68 331 ± 63
Cylinder VOI midsection n = 41 n = 35
Trabecular 90 ± 23 96 ± 23
FEA strength
Hip n = 42 n = 44
Femoral strength (N) 2410 ± 606 2528 ± 638 Trabecular strength (N) 2659 ± 478 2760 ± 539 Peripheral strength (N) 2543 ± 405 2489 ± 375 Geometric strength (N) 548 ± 100 527 ± 110 Strength-to-density
ratio (N·cm3/mg)
10.5 ± 1.7 10.8 ± 1.8
Spine n = 46 n = 45
Vertebral strength (N) 4195 ± 1215 4017 ± 902 Trabecular strength (N) 1790 ± 797 1669 ± 566 Peripheral strength (N) 2406 ± 498 2349 ± 465 Geometric strength (N) 2814 ± 388 2753 ± 423 Homogenized strength
(N)
5101 ± 1255 4910 ± 960 Strength-to-density
ratio (N·cm3/mg)
26.9 ± 4.4 26.2 ± 3.7 Anteroposterior
bending stiffness (KN/rad)
2.0 ± 0.6 1.8 ± 0.4
DXA areal BMD (g/cm2) n = 47 n = 46
Total hip 0.748 ± 0.10 0.759 ± 0.10
Femoral neck 0.622 ± 0.09 0.636 ± 0.09
Greater trochanter 0.548 ± 0.08 0.545 ± 0.08 Intertrochanter 0.896 ± 0.14 0.911 ± 0.14
Total spine 0.789 ± 0.10 0.786 ± 0.09
N, Newtons; KN/rad, kilonewtons per radian.
1.
Integral total hip
Integral trochanter Integral femoral neck
Trabecular total hip
Trabecular trochanter
Cortical total hip
Cortical femoral neck
Cortical trochanter Trabecular femoral neck
0 2
0.7 2.2 3.7
0.5 1.9 3.4
1.1 3.0 5.0
0.8 4.4 8.0
–1.2 0.5 2.2
–1.5 0.3 2.2
–0.7 1.3 3.3
–1.3 2.7 6.8
0.5 7.0 13.6
4 6 8 10
2a.
12%
10%
8%
6%
4%
2%
0%
-2%
-4%
-6%
-8%
Ibandronate
*
*
*
*
† Placebo
Total hip
Integral T rabecular Cortical Integral T rabecular Cortical Integral T rabecular Cortical
Femoral neck Trochanter
2b.
Integral total vertebral body
Integral mid section of vertebral body Trabecular total vertebral body
Trabecular cylinder VOI mid section Trabecular osteo VOI mid section
Cortical osteo VOI mid section
–2 0 2 4 6 8 10
1.8 4.4
7.0
0.6 4.2
7.9
1.0 4.0
7.0
–1.6 2.3
6.2
–2.1 2.2
6.4
–1.7 4.4
10.5
2c.
12%
10%
8%
6%
4%
2%
0%
-2%
-4%
-6%
Ibandronate Placebo
Total Vertebral Vertebral Body Osteo VOI Cylinder VOI
* *
Integral T rabecular Integral T rabecular Cortical
2d.
Femoral strength
Trabecular strength
Strength-to-density ratio Peripheral strength
0 2 4 6 8 10
% change
2.7 5.9 9.0
0.6 2.5 4.5
1.3 3.5 5.7
Geometric strength
0.3 1.5 2.7
1.9 4.1 6.2
3a.
6%
4%
2%
0%
-2%
-4%
-6%
-8%
*
†
†
†
Ibandronate Placebo
Femoral strength T rabecular strength Peripheral strength Geometric strength Strength-to-density ratio
3b.
Vertebral strength
Vertebral AP bending stiffness Trabecular strength
Peripheral strength
3.5 7.1
10.7
4.3 7.8
11.2
2.9 6.3
9.7
0.8 5.6
10.3
Strength-to-density ratio Geometric strength
Homogenized strength
4.9 8.3
11.6
–0.4 1.6
3.6 –0.3 0.4
1.0
3c.
Ibandronate Placebo 10%
8%
6%
4%
2%
0%
-2%
-4%
-6%
-8%
-10%
V ertebral strength T rabecular strength Peripheral strength Geometric strength Homogenized strength Strength-to-density ratio Anteroposterior bending stif fness
*
* *
*
†
†
† †
3d.
-80 -60 -40 -20 0
0 20
BASELINE MONTH 3 MONTH 6 MONTH 9
Visit
Percent change from baseline
-80 -60 -40 -20 20
MONTH 12/ET*
Percent change from baseline
4.
● ● ● ● ●
▲
▲
▲ ▲ ▲
●
● ●
●
●
▲ ▲
▲ ▲
▲