IPO Watch Europe surveys stock market listings in Europe and provides a comparison with the world’s major markets
IPO Watch Europe Review of 2010
www.pwc.co.uk
Contents
Foreword 4
European IPOs by quarter 8
IPOs by stock exchange 9
Major EU-regulated and exchange-regulated markets 12
Other European markets 14
International IPOs 16
Major IPOs in 2010 19
Value of equity trading on European exchanges 20
Market capitalisation of companies on European exchanges 21
IPOs by sector 23
Global perspective 24
Comparison with Greater China 26
Comparison with the US 27
Comparison with Japan 28
Comparison with the Middle East 29
Comparison with Latin America 30
Developments in European regulation and markets 31
About IPO Watch Europe 32
About the Capital Markets Group in London 33
Capital Markets network 34
Foreword Europe rebounds in 2010 from a dismal 2009
Europe hosted 380 IPOs in 2010 rocketing from the 126 transactions in 2009. The total offering amount rose almost fourfold from €7,112m in 2009 to
€26,286m in 2010. Individual transaction values also weighed in heavier than the previous year.
In terms of offering value, Europe ended up in third place on the global stage, lagging slightly behind the US which raised €29bn but dwarfed by Greater China which raised €98bn. Japan, Latin America and the Middle East came fourth, fifth and sixth for value,
respectively. Having dipped significantly in 2009, Europe saw the largest increase in volume (202%) and second largest for value (270%) in our global analysis.
In 2009 only two European IPOs topped the €1bn mark for money raised, but in 2010 this number rose to seven in an environment where investors were still hedging their bets as to whether the climate was right to bankroll IPOs.
Notably these major transactions were widely spread across European exchanges. For example, the largest European transactions in the year were those of Enel Green Power, which raised
€2,264m in Spain and Italy; and the privatisation of the state-owned insurance company PZU which raised
€1,990m in Poland. IPOs in Oslo (Gjensidige Forsikring), Spain
(Amadeus) and Denmark (Pandora) also make the top six. EU-regulated markets led the charge in Europe, and accounted for all of the growth over 2009 in offering value. Exchange-regulated markets, which include AIM and Alternext, saw a leap in the volume of
transactions but the success in attracting the high volume of admissions was dented by the low value transactions.
This meant that the funds raised across such exchanges dropped in 2010 compared to 2009.
London returns to the top of the European pile
Against this backdrop, the general increase in activity on London’s Main Market meant that London led the European capital markets with 114 IPOs raising €10,519m. London’s market share by offering value jumped from 23% in 2009 to 40% in 2010, while its market share by volume increased from 20% in 2009 to 30% in 2010.
London IPO activity suffered more markedly than that on the other major European exchanges in the economic crisis. From the doldrums of 2009, London has now rallied more quickly than those exchanges, returning to the top of the European markets. This return was largely based upon
international transactions, including all of Europe’s top five international IPOs.
Greater China’s ‘super-jumbo’
offerings leave Europe trailing
It was another strong year for Greater China with almost €100bn of offerings including two ‘super-jumbo’ deals, AgBank and AIA, which together generated more new money than all European IPOs in the year.
Greater China was bullish across the board with strong performance in Shanghai and Shenzen, but Hong Kong still led the way. Hong Kong also attracted some substantial international deals for the first time in 2010 with Rusal and L’Occitane likely to be followed by Prada and others in 2011.
This could be seen as the fledgling signs of a challenge to London’s and New York’s dominance of international transactions. We expect to continue to see growth in Asia though the markets in this region are likely to be evolving.
This will be due to very specific types of companies being interested in listing in the region and other key exchanges, such as London and the US, re-asserting their international credentials.
In recent years, the world’s capital markets have been exposed to some of the most destructive financial
conditions in living memory
but, in Europe and globally,
those markets are now
showing genuine signs of
recovery.
Statoil Fuel in Norway. We expect that this trend will continue in 2011.
Specifically, we forecast a number of financial service companies will be offloading parts of their businesses through IPOs to comply with regulatory restrictions – either as part of the bailout deals or otherwise.
In addition, mining giants including Rio Tinto, Anglo American and Vedanta all announced potential demerger plans, which could also spur IPO activity. This trend is being fuelled by the desire to raise capital for strategic opportunities and to raise profile in markets which
Companies from emerging markets will continue to access the key international IPO centres
More international deals into Hong Kong are expected this year. However, appetite from organisations based in emerging markets to list on large well-recognised exchanges remained robust. If they did not list solely in their home markets, major Indian, Chinese and Russian organisations especially have an attraction for key international exchanges such as London and the US.
For example, in 2010, 27% of US IPOs and 23% of Europe’s were from emerging markets companies. We expect more emerging market deals from India, Indonesia, Russia,
Kazakhstan and possibly China. Issuers will continue to consider which exchange will be best positioned to deliver the highest valuations and liquidity, while supporting international expansion.
Privatisations and corporate divestments should continue to fuel the IPO market
Some of 2010’s largest IPOs were privatisations. This included two major Polish transactions and all the large Chinese IPOs. A more uncommon privatisation – or rather re-privatisation – was General Motors in the USA, which returned to the capital markets
following the restructuring of the automobile company.
We anticipate more privatisations on the horizon in 2011 as European
governments take steps to reduce their levels of borrowing. Furthermore, a number of emerging market countries have opened up or renewed their privatisation programmes, the most notable examples – which will no doubt provide some more notable IPOs in 2011-2012 – being Russia, Mongolia and Kazakhstan.
On a global level, there was also a key trend in 2010 for demergers and spin- offs from large multinational companies.
Examples included AIA in Hong Kong, African Barrick Gold in London and
We anticipate more privatisations on the horizon in 2011 as European governments take steps to reduce their levels of borrowing.
Figure 2: Offering value €m
0 2006 100,000
80,000
60,000
40,000
20,000
2007 2008 2009 2010
Offering value (€m)
87,828 80,449 13,953 7,112 26,286
Figure 1: Volume of IPOs
0 2006 1,000
800
600
400
200
2007 2008 2009 2010
Volume of IPOs
806 771 295 126 380
represent a better geographical fit for certain groups’ operations; together with the need to maximise shareholder value by spinning-off non-core parts of a diversified multinational.
Continuing consolidation of the world’s exchanges appears inevitable
The exchanges themselves are seeing transaction activity – with London recently announcing its planned merger with Toronto, and NYSE Euronext and the Deutsche Börse announcing their potential combination. There is also the planned merger of the Singapore and Australian Securities Exchanges and the possible admission of foreign issuers to the Shanghai International Board. Both of these latter moves, if they are
approved, are likely to ensure continuing dynamism in the Asian region.
There certainly appears no alternative to further consolidation of exchanges in Europe and globally.
Positive signs of recovery for 2011 but no immediate return to boom time
We have seen that some large IPOs did complete in 2010, but there was a fair share of negative investor reaction, adverse comment in the press and deals being pulled or postponed. We note that several of those high profile IPOs in the year that gathered significant negative press comment, when viewed over the year as a whole, have out-performed their sectors.
All the signs point to some degree of recovery. Our outlook remains “cautious but optimistic” as activity remains well down on the record levels seen in 2006 and 2007. It must be stressed that while transaction pipelines remain relatively strong, several exchanges’ actual results were significantly bolstered by a handful of high value fundraisings rather than sustained recovery across the board.
While Greater China should have another strong year in 2011, the absence of ‘super-jumbo’ listings may mean that 2011 does not see the same value of IPOs as 2010. Hong Kong will continue to market itself to international companies and represents a growing competitive threat to London and New York – but only for certain companies. Barring any unexpected financial or political shocks, the momentum built in the fourth quarter of 2010 should continue into 2011 for Europe’s IPO markets. In addition to domestic deals, there should be a return of international transactions into London from emerging economies.
European markets have a good pipeline of candidates (both domestic and emerging market) but much will depend on the confidence of investors particularly against a background of sovereign debt worries across Europe and the political unrest in several countries in the Middle East and North Africa.
Partner, Capital Markets Group, UK Richard Weaver
Head of Capital Markets Group, UK Tom Troubridge
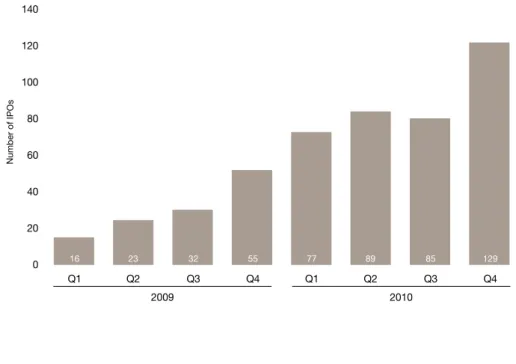
European IPOs by quarter
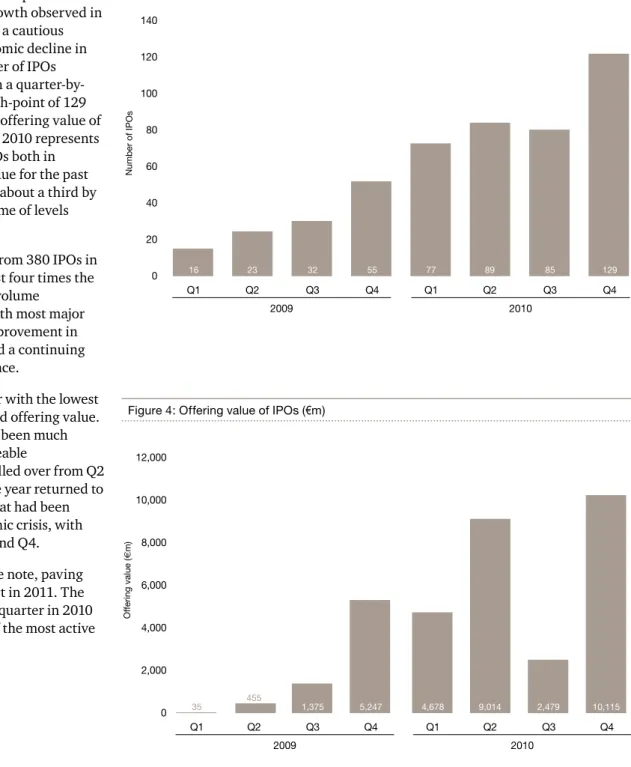
IPO activity across the European exchanges has gradually improved in 2010, continuing the growth observed in late 2009 and reflecting a cautious recovery from the economic decline in recent years. The number of IPOs continued to increase on a quarter-by- quarter basis, with a high-point of 129 IPOs in Q4 2010 and an offering value of
€10,115m. Although Q4 2010 represents the highest point for IPOs both in number and offering value for the past two years, it is still only about a third by value and a half by volume of levels achieved in Q4 2007.
With €26,286m raised from 380 IPOs in 2010, Europe saw almost four times the offering value and IPO volume
experienced in 2009, with most major markets enjoying an improvement in economic conditions and a continuing rise in business confidence.
Q3 2010 was the quarter with the lowest IPOs both by number and offering value.
The quarter would have been much quieter if a couple of sizeable
transactions had not spilled over from Q2 2010 into early July. The year returned to the traditional profile that had been disrupted by the economic crisis, with peaks in activity in Q2 and Q4.
2010 ended on a positive note, paving the way for a strong start in 2011. The number of IPOs in each quarter in 2010 exceeded the number of the most active quarter in 2009.
Figure 3: Volume of IPOs Figure 1: Text
Might not need
footnotes etc 0 140
120
100
80
60
40
20
Q1 Q2 Q3 Q4
Q1 Q2 Q3 Q4
Number of IPOs
2010 2009
129 85
89 77
55 32
23 16
Figure 4: Offering value of IPOs (€m)
0 12,000
10,000
8,000
6,000
4,000
2,000
Q1 Q2 Q3 Q4
Q1 Q2 Q3 Q4
Offering value (€m)
2010 2009
10,115 2,479
9,014 4,678
5,247 1,375
35 455
IPOs by stock exchange
Europe hosted 380 IPOs in 2010, more than treble 2009’s figure of 126 transactions. The total offering amount rose almost fourfold from €7,112m in 2009 to €26,286m in 2010. Transaction values were on the rise: in 2009 only two IPOs topped the €1bn mark for money raised, but in 2010 this number rose to seven. These signs indicate some recovery but it is muted, with activity remaining well down on the record levels seen in 2006 and 2007. Several exchanges’ results were significantly impacted by a handful of high value transactions.
Athens, Luxembourg and Euronext were the only exchanges that did not see improvement in the year. The Athens Stock Exchange has seen low activity for some time reflecting the depth of the economic problems in Greece. In
IPOs by stock exchange
2010 2009
Stock exchange Company IPOs Offering value (€m) Company IPOs Offering value (€m)
London Stock Exchange Group1 122 12,650 31 1,797
London Stock Exchange 114 10,519 25 1,660
Borsa Italiana 8 2,131 6 137
WSE 112 3,810 38 1,594
Oslo Børs & Axess 16 2,445 2 91
Deutsche Börse 23 2,413 5 53
NASDAQ OMX 24 2,029 11 66
BME (Spanish Exchanges) 12 1,562 3 19
Luxembourg 36 797 22 1,575
NYSE Euronext 32 417 9 1,907
SIX Swiss Exchange 4 163 4 –
Athens Stock Exchange – – 1 10
Europe total2 380 26,286 126 7,112
1. The London Stock Exchange Group comprises the London Stock Exchange and Borsa Italiana.
2. IPOs by market are shown gross of dual listings; however these are netted off in the Europe total number and offering values.
contrast, Luxembourg and Euronext saw volume growth in 2010 but did not host any large transactions to match those they experienced in 2009, when Euronext hosted Delta Lloyd and CFAO (which raised €1,016m and €806m respectively) and Luxembourg hosted four GDR transactions raising in excess of €200m each.
London led the European capital markets in term of value with 114 IPOs raising
€10,519m. Its market share by offering value jumped from 23% in 2009 to 40%
in 2010, while its market share by volume increased from 20% in 2009 to 30% in 2010. Although London did not host the largest IPO in 2010, it did host three of the year’s top 10 IPOs and generally saw an increase in average offering value, contributing to the larger than proportional rise in market share by
value. Indian utilities company Essar Energy raised €1,485m, Jersey-based investment company Vallar raised
€822m, and Mail.Ru Group, the Russian media organisation, raised €669m – all on London’s Main Market. These transactions further emphasise how successful London has continued to be in attracting international companies to its markets. Furthermore, London IPO activity suffered more markedly than that on the other major European exchanges in the economic crisis, and from the lows of 2009 London has rebounded more quickly than those exchanges, returning to the top of the European markets.
Tracey Pierce, Director of Equity Primary Markets, London Stock Exchange Group:
“As this latest edition of IPO Watch shows, there was a significant uptick in new issues on our markets through 2010, as confidence began to return to the market after the particularly difficult economic and market conditions of 2008 and 2009.
“2010 injected some very positive signs of life into the IPO market, including a number of major wins for the London Stock Exchange, with our markets attracting UK household names as well as high profile international listings from India, Russia, Asia and the Middle East, reflecting the increasingly international ambitions of businesses from those regions.
“We believe these new floats are just the beginning of a growing, healthy, long term pipeline of issuers, looking to join our markets. Our global business development teams remain very active, working across all four corners of the globe. We know that there are many other companies interested in the access to capital and international profile that joining the London markets can provide, and we look forward to supporting them fund the growth of their businesses over the next few years.”
The Warsaw Stock Exchange (WSE) came second for the number and value of IPOs in 2010, having topped the capital markets for the number of IPOs in 2009.
Its 112 IPOs raised €3,810m, almost tripling volume and more than doubling value from its 2009 figures. Despite these healthy figures, the WSE’s market share by number of IPOs fell slightly from 30% in 2009 to 29% and its market share by value dropped from 22% in 2009 to 14% in 2010. The WSE is characterised by a mix of a few high- value transactions involving state- controlled businesses undergoing privatisation, and a large amount of very low-value transactions, generally raising less than €1m apiece. In 2010, the WSE’s Main Market hosted two of the year’s largest IPOs, both privatisations:
insurance organisation PZU raised
€1,990m and utilities company Tauron Polska Energia raised €1,026m.
Ludwik Sobolewski, President, Warsaw Stock Exchange:
“Maintaining a lively interest in
companies becoming public and listed lies
at the core of the WSE’s strategy. We believe that being an active stock exchange and working directly with potential issuers is a feature of a modern capital market. The WSE itself became a listed company in November 2010, and this has only enhanced our ability and
competencies to talk with potential and existing issuers and to understand their needs and problems. The future will be marked by our efforts to strengthen our position as a regional leader, and I expect this to be confirmed by a systematic growth in the number of foreign issuers present on Warsaw’s two equity markets – the Main Floor and NewConnect.”
By hosting 2010’s fourth largest IPO, Oslo ranked third by value across Europe’s exchanges. Its 16 IPOs raised
€2,445m in 2010, both marked increases from 2009 when two IPOs raised €91m.
The exchange has seen its market share for volume double to 4% and its share for value grow almost tenfold to 9%.
Norwegian insurance company, Gjensidige Forsikring, raised €1,356m, accounting for more than half of money raised on the exchange in the year.
Inge A. Myhrvold, Vice President, Head of Issuer Sales, Oslo Børs:
“2010 proved to be a recovery year for Oslo as a total of 16 IPOs were introduced to our two markets, combined with record levels of equity being raised. Oslo has worldwide leading positions within certain industry sectors, and several new companies from the Oil & Gas and Food & Beverage sectors respectively were introduced to the market last year. However, the IPOs of Gjensidige Forsikring (insurance), Statoil Fuel &
Retail and Seawell (oilfield services) were the individual highlights, with Gjensidige as one of the overall largest in Europe during 2010.”
The Deutsche Börse ranked fourth by value but sixth by volume in 2010. By raising €2,413m through its 23 IPOs, it achieved nearly 50 times the money raised from nearly five times the volume of IPOs observed in 2009. Market share by volume rose from 4% in 2009 to 6% in 2010 while market share by value rose considerably from less than 1% in 2009 to 9% in 2010. Kabel Deutschland was the year’s tenth largest IPO, raising €660m on Deutsche Börse’s Prime Market.
Alexander Höptner, Executive Vice President Markets Services, Deutsche Börse:
“Starting with a strong first quarter the market couldn’t maintain the momentum due to the crisis of some European member states which affected the capital markets.
However, it was a very good market for capital increases and again volume could be increased to over €18 billion (€16.2 billion in 2009). This shows investors are quite cautious with their investments in the primary market, but reflects on the other hand that equities could be placed even in difficult market conditions. The Entry Standard performed well with the best placement volume for the past three years and we expect this growth to continue with more IPOs in the regulated market as well as in the Entry Standard in 2011.”
The Borsa Italiana’s eight IPOs raised
€2,131m in 2010, fifteen times the money raised in 2009. The vast majority of value came from a joint listing with the BME (Spanish Exchanges) which was also the year’s largest IPO in Europe.
Italian utilities company Enel Green Power raised €2,264m in total, with
€2,067m raised in Italy, accounting for 97% of money raised on the Borsa Italiana. The impact of this single large transaction and the otherwise low level of activity on the Borsa Italiana’s market shares for volume and value was that they moved in opposite directions, with the volume share down from 5% in 2009 to 2% to 2010 while the value share rose from 2% in 2009 to 7% in 2010.
Luca Peyrano, Head of
Continental Europe – Primary Markets, Borsa Italiana:
“Even though much ground needs to be covered to repair the impact of the economic and financial crisis, we see a good outlook for 2011’s IPO activity.
Indeed, we have recently seen an upturn with a large cap admission to Borsa Italiana. Enel Green Power, a renewable energy company, registered high market interest and was the largest offer in Europe in the last three years. Furthermore, the AIM Italia market provided six new listings in 2010 and we witnessed an increase in appetite of international investors for SMEs, which leads us to a positive outlook on up and coming IPO activity.”
NASDAQ OMX hosted 24 IPOs in 2010, more than double the 11 hosted in 2009.
However, the value of those IPOs rose over thirty times from €66m in 2009 to
€2,029m in 2010. Continuing the trend of single large transactions impacting overall exchange activity, approximately 60% of the money raised on the
exchange is down to the year’s sixth largest IPO, jewellery manufacturer and retailer Pandora.
Jenny Rosberg, Deputy President, NASDAQ OMX Nordic:
“2010 has seen an improvement for listings in Europe and the number of new
companies that has chosen to list on NASDAQ OMX has increased by more than 100% compared to 2009. Overall, the market has developed strongly in 2010 and in terms of listing activity Copenhagen hosted one of Europe’s largest IPOs of the year with Pandora raising €1,227m.
“We look forward to continuing to support new and existing clients in raising investor interest in 2011. With the progress in 2010, market valuations are starting to look interesting, and investors are looking for new, attractive opportunities to invest in companies, and as always, great investment cases”.
BME (Spanish Exchanges) raised
€1,562m through 12 IPOs in 2010. This is in comparison to three IPOs raising only €19m in 2009. This quadrupling of activity saw the exchange’s market share by volume rise from 2% in 2009 to 3% in 2010, while the huge increase in offering value accounted for an improvement from a 2% market share by value in 2009 to a 6% share in 2010. In addition to co-hosting Enel Green Power, BME (Spanish Exchanges) also hosted the year’s fifth largest transaction, technology company Amadeus, which raised €1,317m.
Domingo José García Coto, Head of Research, Bolsas y Mercados Españoles (BME Spanish Exchanges):
“The return of activity on the IPO market was felt across all markets of the Spanish stock exchange in 2010, with 12 new companies joining the different segments of the Spanish stock market. Two large companies, Amadeus and Enel Green Power, started trading on the main market
and 10 small companies joined the Mercado Alternativo Bursátil (MAB) for growth companies, designed by BME to help small and medium companies to tap the stock market.”
The Luxembourg exchange hosted the third largest number of IPOs in 2010 with 36 transactions raising €797m. This was a 61% increase in terms of volume from 2009’s figure of 22 IPOs but a 51%
decrease in money raised, compared to
€1,575m in 2009. In 2009, the exchange hosted four of the year’s largest IPOs but did not feature in 2010’s top ten list, though it should be noted that 2009 overall saw so few major transactions in Europe that while they all featured in the top ten for the year, all four together did not raise €1bn amongst them. The exchange has seen its market share for volume fall from 17% to 9% and its market share of value plummet from 22% to 3%.
Hubert Grignon Dumoulin, Head of Issuers and Market Regulation, Luxembourg Stock Exchange:
“The IPO activity by volume on the Luxembourg Stock Exchange has increased in 2010 compared to 2009 as the exchange attracted 36 IPOs compared to 22 in 2009. The Luxembourg Stock Exchange is still benefiting from its long experience in GDR listings from Asian companies, with a global amount of
€797m raised, due to the continuing IPO activity in this region of the world.”
NYSE Euronext performance was generally steady, with the exchange coming fourth in Europe for the number of transactions in 2010, but lower offering values resulted in a fall to ninth by value. Euronext hosted 32 IPOs that together raised €417m, whereas in 2009, nine IPOs raised €1,907m. This has meant that its market share by volume has remained relatively constant at 8%
while its market share by value suffered a massive fall from 27% to under 2%.
Euronext hosted two out of the top three IPOs in 2009 but did not appear in the top ten list in 2010.
Ronald Kent, Group Executive Vice President and Head of International Listings, NYSE Euronext:
“In 2010, NYSE Euronext’s efforts to facilitate access to capital markets for SMEs, notably through NYSE Alternext, boosted the number of companies going public with 32 new listings compared to nine in 2009. Although uncertainty persists, even more companies from a diverse range of countries and sectors are now revisiting their organisational readiness to undertake the process of going public and to benefit from the profile and liquidity that a listing on our markets provides.”
The SIX Swiss exchange held four IPOs in 2010, the same amount as 2009.
However, no money was raised in 2009 whereas 2010 saw €163m raised on the Main Market.
Marco Estermann, Director, Head of Issuer Relations, SIX Swiss Exchange:
“2010 started well with a promising pipeline and the listing of two companies within three days in April 2010. Given the increase in volatility following the default of Greece and the subsequent Euro-crisis, several companies postponed their IPOs or preferred to sell their shares to a strategic buyer. Nevertheless, SIX Swiss Exchange was able to attract two further listings in November 2010.
“Two of the four listings on SIX Swiss Exchange were done by major
international, multi-billion Swiss Francs companies, which is viewed as a major success for SIX Swiss Exchange and a clear commitment to Switzerland as an
attractive listing location. And it means SIX Swiss Exchange has set another milestone in the internationalisation and sector diversification of its issuer base in 2010.
“I believe in 2011, we will see an increase in companies that aim for an opening to the deep asset pool of the diverse, international investor base active in Switzerland and take advantage of the visibility and liquidity that a listing on our market provides.”
Major EU-regulated and exchange-regulated
markets
EU-regulated markets hosted IPOs raising €23,590m in 2010, over five times the amount raised in 2009.
London’s Main Market led the way, generating €9,034m, representing 38% of total money raised on the EU-regulated markets in 2010. The WSE raised €3,770m, the second highest amount by an EU-regulated market, followed by the Oslo Børs raising €2,362m, notable given the Oslo Børs’s lack of activity in 2009.
This was mainly due to the €1,356m IPO of Gjensidige Forsikring, a Norwegian insurance company.
The dramatic increase in activity in 2010 was spread across the EU- regulated markets. The Deutsche Börse, Borsa Italiana, and NASDAQ OMX each raised in excess of €2bn compared with a combined €219m in 2009. The BME (Spanish Exchanges) raised €1,514m compared with no money raised in 2009. Much of the increase in the Borsa Italiana and BME (Spanish Exchanges) was aided by the
dual offering of Enel Green Energy raising €2,264m across the two exchanges. After not seeing any money raised in 2009, the SIX Swiss exchange hosted four IPOs that raised
€163m in 2010.
The Main Market of the Athens Stock Exchange and the NYSE Euronext were the only EU-regulated exchanges to see a decrease in offering values.
The Athens Stock Exchange has seen only one IPO in the last three years, reflecting how deeply the economic crisis has impacted Greece. The NYSE Euronext saw an increase in volume from six to 11 offerings; however, the offering value was down to €344m from €1,907m raised in 2009.
Looking at the exchange-regulated markets in aggregate, the volume trend matched the EU-regulated markets and there were three times as many offerings in 2010 as in 2009;
however, average offering size reduced significantly and total money raised declined from €2,772m in 2009 to €2,696m in 2010. The exchange- regulated markets have seen a high number of technical admissions with no money raised and very low offering value domestic transactions.
London’s AIM market regained the lead in terms of money raised by exchange-regulated markets as it contributed to 44% of the total raised in 2010. The increase in value and volume signals an increase in the confidence of the UK markets, which had been hit particularly hard by volatile market conditions.
Luxembourg’s EuroMTF saw its share of money raised decrease from 57% to 30%. In the same period IPO volume increased from 22 in 2009 to 36 in 2010 representing a 64% increase;
however, smaller offering sizes resulted in the Luxembourg’s EuroMTF market falling behind London’s AIM market in terms of total money raised. The WSE’s New Connect market continued to attract the highest number of IPOs across the exchange-regulated markets with 86 IPOs representing a significant increase over the 26 IPOs in 2009.
While total money raised on the New Connect increased from €10m in 2009 to €40m in 2010, average offering value remains very low.
While the growth in IPO activity was even across EU- regulated and exchange-regulated markets, the surge in value of IPO offerings all came from EU-regulated markets.
While still well below the level of activity seen in 2007, the
EU-regulated markets showed a resilient return after two
years of dismal activity caused by the financial crisis. Many
markets also benefitted from the return of individual high
value transactions that accounted for the majority of funds
raised on their markets, with much of the volume growth in
admissions or low value offerings.
Major EU-regulated and exchange-regulated markets
2010 2009
Stock exchange Company IPOs Offering value (€m) Company IPOs Offering value (€m) EU-regulated
London (Main) 52 9,034 9 620
WSE (Main) 26 3,770 12 1,584
Oslo Børs 9 2,362 – –
Deutsche Börse 10 2,297 1 48
Borsa Italiana (Main) 2 2,0991 1 105
NASDAQ OMX (Main) 15 2,007 6 66
BME (Spanish Exchanges) 2 1,5141 1 –
NYSE Euronext (Euronext) 11 344 6 1,907
SIX Swiss Exchange 4 163 4 –
Athens Stock Exchange – – 1 10
Wiener Börse – – – –
Luxembourg – – – –
ISE – – – –
EU-regulated sub-total2 130 23,590 41 4,340
Exchange-regulated
London (AIM) 58 1,180 14 655
Luxembourg (EuroMTF) 36 797 22 1,575
London (SFM) 4 305 1 30
Deutsche Börse (Entry Standard) 13 116 4 5
Oslo Axess 7 83 2 91
NYSE Euronext (Alternext) 21 73 3 –
BME (Spanish Exchanges) MAB 10 48 2 19
WSE (NewConnect)3 86 403 26 103
Borsa Italiana (AIM) 6 32 5 32
NASDAQ OMX (First North) 9 22 5 –
London (PSM) – – 1 355
Exchange-regulated sub-total 250 2,696 85 2,772
Europe total2 380 26,286 126 7,112
1. Enel Green Energy dual listed on Borsa Italiana (Main) and BME (Spanish Exchanges) raising €2,264m across the two exchanges.
2. IPOs by market are shown gross of dual listings. However these are netted off in the Europe total number and offering values.
3. Cumulatively the WSE NewConnect raised €51m in 2010 and €13m in 2009. However some of the NewConnect transactions raised an amount that rounded to a lower figure and the total above is the sum of these rounded values.
Other European markets
Other European markets
2010 2009
Stock exchange IPOs
Offering
value (€m) IPOs
Offering value (€m) Deutsche Börse
(First Quotation Board) 151 50 53 46
London PLUS 20 5 18 4
NYSE Euronext Marché Libre 27 1 28 1
Wiener Börse MTF 3 – – –
Germany
2010 2009
Stock exchange IPOs
Offering
value (€m) IPOs
Offering value (€m)
Deutsche Börse 10 2,297 1 48
Deutsche Börse (Entry
Standard) 13 116 4 5
First Quotation Board (FQB) 151 50 53 46
Germany total 174 2,463 58 53
The IPO Watch Europe survey tracks the volume and value of IPOs across all the main European exchanges. Certain junior markets that are not included within the IPO Watch Europe survey have been relatively active over recent years. This section discusses the nature and activity of those markets including comparison with other markets operated by the relevant exchanges.
It is a feature of these exchanges that IPOs are often admissions with nil or nominal amounts raised, either because there has been pre-IPO fundraising with a plan to subsequently list the securities issued, or because a stock exchange listing is being obtained for other purposes such as tax planning or to enhance liquidity in the securities.
First Quotation Board
The First Quotation Board is an exchange-regulated market of the Frankfurt Stock Exchange. It hosts all primary offerings made onto the Open Market, providing greater visibility for initial listing of shares and depository receipts. It is primarily aimed at qualified investors who are able to assess and bear the significant risks that are likely to be associated with an equity investment listed on the First Quotation Board.
The First Quotation Board was the Deutsche Börse’s response to the increasing number of initial listings on
the Open Market. Since 2005 companies have increasingly been using the Open Market as a forum for offering their shares for trading without being required to meet any continuing obligations. The majority of companies listed on the First Quotation Board are from outside Germany.
Consistent with the trends noted in the EU-regulated markets, the volume of IPOs increased by 185% between 2009 and 2010, but as most transactions were admissions only, money raised remained low and in line with 2009.
Austria
2010 2009
Stock exchange IPOs
Offering
value (€m) IPOs
Offering value (€m)
MTF 3 – – –
Prime – – – –
Second (Standard) – – – –
Austria total 3 – – –
NYSE Euronext
2010 2009
Stock exchange IPOs
Offering
value (€m) IPOs
Offering value (€m)
Euronext 11 344 6 1,907
Alternext 21 73 3 –
Marché Libre 27 1 28 1
NYSE Euronext total 59 418 37 1,908
London
2010 2009
Stock exchange IPOs
Offering
value (€m) IPOs
Offering value (€m)
Main Market 52 9,034 9 620
AIM 58 1,180 14 655
PSM 4 305 1 355
PLUS 20 5 18 4
SFM – – 1 30
London total 134 10,524 43 440
Wiener Börse MTF
Vienna‘s third market is an exchange- regulated Multilateral Trading Facility (MTF). It has particular appeal to medium-sized businesses and does not require any formal admission procedures to the exchange.
In 2010, the MTF market saw the Wiener Börse’s only activity for the last two years. Snuko, a technology company creating and selling anti-theft software;
investment and insurance broker, Univerma; and Mobius EcoCapital, a company that invests in the carbon economy, all listed on the exchange but raised no money.
Beatrix Exinger, Head of Media Relations, Wiener Börse:
“On Austria’s capital markets, sentiment is much brighter than a year ago, also in the manufacturing sector and not only among analysts. This is a sign that the positive trend is likely to be long term. I also believe that there is a lot of money available for investing again, as investors have practised restraint in the past few months. Austrian companies are also sending positive signals: companies achieved ‘healthy’ structures during the crisis and are back on the growth path.
These encouraging developments should clear the path for some public offerings at the Vienna Stock Exchange in 2011.”
PLUS
PLUS is a small and mid-cap stock exchange for London. PLUS operates two primary markets, the PLUS-listed and PLUS-quoted markets, as well as a secondary trading market (PLUS- traded). PLUS-listed is an EU-regulated market open to companies, funds or market professionals issuing equity, debt, depository receipts and specialist securities, such as structured products and exchange traded funds. PLUS- quoted is an exchange-regulated market for smaller, growing companies. The PLUS-quoted market offers a
disclosure-based regulatory framework and does not impose specific eligibility criteria but instead requires companies to meet certain basic standards.
In 2009 the PLUS exchange hosted 18 IPOs that raised €4m, while in 2010 volume rose by 11% to 20 IPOs, with value increasing by 25% from €4m raised in 2009 to €5m in 2010.
The Marché Libre
The Marché Libre is an exchange- regulated market operated by NYSE Euronext. It addresses small and medium-sized firms who would like to finance their development and benefit from the reputation bestowed on listed companies without facing the level of regulation associated with NYSE Euronext’s major markets.
The 2010 activity level of 27 IPOs that were mainly admissions and raised only
€1m in total was very similar to 2009, when 28 IPOs raised only €1m.
International IPOs
Global IPO markets saw a strong recovery in 2010. International IPOs held up relatively well in the depths of the gloom in 2009, largely on the back of Indian GDRs. While there has been growth in 2010, with 100 international IPOs raising
€8,714m it is not as marked as for domestic European businesses as the trough was not as relatively deep in 2009.
Companies from India represented 33%
of the volume of total international IPOs in 2010 and 34% of the offering value.
Many Indian companies continue to raise funds via GDR offerings in Luxembourg, but the impact of Indian companies is greater in 2010 as in addition to the flow of GDRs, Essar Energy completed its IPO on London’s Main Market in the year. India was followed by China, whose companies represented 13% of the volume of total international IPOs in 2010 and 18% of the offering value. The mining sector experienced the highest volume of IPOs in 2010 representing 21% of the volume of total international IPOs and 18% of the offering value. This was followed by the industrial goods & services sector which represented 16% of the volume of total international IPOs and 10% of the offering value. It is notable however, that there is a reasonable spread among different industry sectors, when many might anticipate natural resources would be more dominant amongst international IPOs.
London continues to lead in hosting international IPOs with all of the top five international IPOs.
Figure 5: Volume of international IPOs by country of origin
India China Russia Ukraine USA Other 4%
5% 8%
13%
37% 33%
Figure 6: Value of international IPOs by country of origin
India China Russia Ukraine USA Other 4%
9%
17% 18%
34%
18%
Top five international IPOs
Company Money raised €m Exchange Sector Country of origin
Essar Energy 1,485 London Utilities India
Mail.Ru Group 669 London Media Russia
African Barrick Gold 645 London Mining Tanzania
Fidelity China Special Situations 526 London Investment Company China
AZ Electronic Materials 448 London Chemicals China
Figure 7: Volume of international IPOs by sector
Mining
Industrial Goods & Services Investment Company Media
Oil & Gas Utilities Technology Other
6% 6% 8%
16%
21%
5%
5%
33%
Figure 8: Value of international IPOs by sector
Utilities Mining
Investment Company Media
Industrial Goods & Services Other
10%
11% 12%
18%
26% 23%
Seven of the top ten largest European IPOs raised over €1bn in 2010 as
compared to only two of the top ten IPOs in 2009. The total money raised by the top ten IPOs increased by 150% from
€5,118m in 2009 to €12,816m in 2010, but the overall recovery in IPO activity in the year meant that even with this level of increase, the top ten’s contribution to total money raised in Europe fell from 72% in 2009 to 49% in 2010.
For the third year in a row, the utilities sector has provided the largest IPO, with Enel Green Power following PGE Polska Grupa Energetyczna in 2009 and EDP Renovaveis in 2008, and for the second year in a row the number two slot has been taken by an insurance company.
Utilities and insurance sectors together account for half of the top ten in 2010.
Major IPOs in 2010
Ten largest IPOs: 2010 (ranked by money raised)
Company Money raised €m Exchange Sector Country of origin
Enel Green Power 2,264 Borsa Italiana & BME Utilities Italy
PZU 1,990 Warsaw Insurance Poland
Essar Energy 1,485 London Utilities India
Gjensidige Forsikring 1,356 Oslo Insurance Norway
Amadeus 1,317 BME Technology Spain
Pandora 1,227 OMX Personal & household goods Denmark
Tauron Polska Energia 1,026 Warsaw Utilities Poland
Vallar 822 London Investment company Channel Islands
Mail.Ru Group 669 London Media Russia
Kabel Deutschland Holding 660 Deutsche Börse Telecommunications Germany
Ten largest IPOs: 2009 (ranked by money raised)
Company Money raised €m Exchange Sector Country of origin
PGE Polska Grupa Energetyczna 1,407 Warsaw Utilities Poland
Delta Lloyd 1,016 Euronext Insurance Netherlands
CFAO 806 Euronext Industrial goods & services France
Gartmore Group 378 London Investment company Cayman Islands
Tata Steel 355 London Construction & materials India
Shin Kong Financial Co 266 Luxembourg Insurance Taiwan
Tata Motors 253 Luxembourg Automobiles & parts India
Max Property Group 226 London Real estate Channel Islands
Epistar Corporation 210 Luxembourg Technology Taiwan
KGI Securities 201 Luxembourg Financial Services Taiwan
Value of equity trading on European exchanges
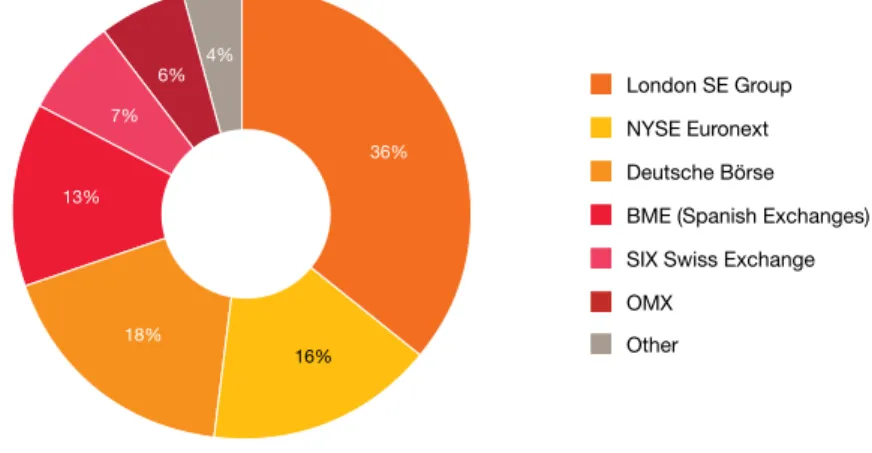
There has been a 24% decrease in the value of equity traded from €8,756bn in 2009 to €6,654bn in 2010, reflecting the continuing aftermath of the financial crisis and the sovereign debt uncertainty across Europe. London saw the largest drop (of 38%) in its equity trading and its proportion of the overall value of trading in Europe fell by 7%.
Figure 9: Value of equity trading 2010
London SE Group NYSE Euronext Deutsche Börse BME (Spanish Exchanges) SIX Swiss Exchange OMX
Other 8%
8%
14%
16% 21%
29%
4%
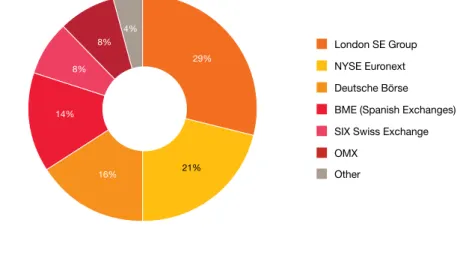
Figure 10: Value of equity trading 2009
London SE Group NYSE Euronext Deutsche Börse BME (Spanish Exchanges) SIX Swiss Exchange OMX
Other 7%
6%
13%
18%
16%
36%
4%
Source: World Federation of Exchanges
Note: London SE Group comprises the London Stock Exchange and Borsa Italiana
NYSE Euronext saw the smallest drop (of 2%) in trading, causing its overall share of the value of trading in Europe to increase by 5%.
The relative proportions of the total equity traded across the other European exchanges have remained broadly consistent, with significant decreases in the value of equity traded across each of the European exchanges.
Total trading (2009)
€8,756bn
Total trading (2010)
€6,654bn
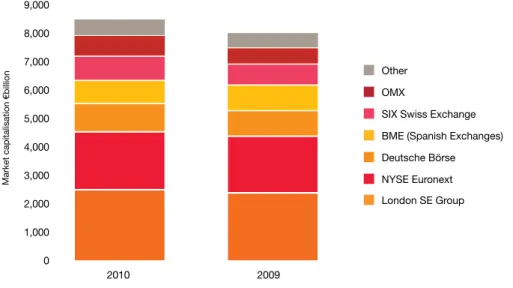
Market capitalisation of companies on European exchanges
Figure 11: Market capitalisation of exchanges
0 9,000 8,000
6,000 7,000
5,000 4,000 3,000 2,000 1,000
2009 2010
Market capitalisation
€billion
Other OMX
SIX Swiss Exchange BME (Spanish Exchanges) Deutsche Börse NYSE Euronext London SE Group
Source: World Federation of Exchanges
Note: London SE Group comprises the London Stock Exchange and Borsa Italiana
The market capitalisation of companies on the European exchanges increased by 6% from €7,934bn in 2009 to €8,409bn in 2010. The NASDAQ OMX saw the largest rise in market capitalisation with an increase of 28%, while the BME (Spanish Exchanges) representing the only decline across the European exchanges, saw a fall of 10%. London SE Group and NYSE Euronext continued to contribute the highest value of the European exchanges, together comprising 53% of the total European market capitalisation in 2010 (49% in 2009). It is notable that value of equity trading and the market capitalisation of listed companies have both held up well for NYSE Euronext in a year in which IPO activity on that exchange has been relatively poor.
IPOs by sector
IPOs by sector Sector
Company IPOs 2010
Movement in the table
Company IPOs 2009
Industrial Goods & Services 63 – 19
Investment Companies 48 – 18
Technology 35 – 14
Pharmaceuticals & Biotech 27 +5 4
Mining 23 +13 2
Financial Services 22 -2 10
Food & Beverage 19 +5 3
Media 18 – 5
Retail 17 +1 4
Real Estate 16 -4 8
Oil & Gas 15 – 4
Utilities 15 -5 7
Personal & Household Goods 14 – 3
Construction & Materials 11 -9 9
Telecommunications 10 +3 2
Travel & Leisure 8 +4 1
Healthcare 5 -3 3
Basic Resources 4 -3 3
Insurance 4 -3 3
Chemicals 3 +1 1
Banks 2 -2 2
Automobiles & Parts 1 – 1
Total 380 126
For the fourth consecutive year, the top three performing sectors in terms of the number of IPOs remained unchanged:
the Industrial Goods & Services sector topped the table, followed by the Investment Companies and Technology sectors.
In 2010, the number of IPOs for businesses operating within the Industrial Goods & Services sector rose 232% with 63 transactions raising
€1,689m. This sector enjoys a high volume of lower value transactions, in part down to the fact that 29 (46%) of 2010’s listings in this sector were on the WSE, with those 29 transactions together raising only €41m, or 2% of the total money raised for the sector. The Luxembourg Stock Exchange hosted 13 IPOs in the sector which together raised
€345m. Despite the high number of Industrial Goods & Services
transactions, none of the year’s top 10 IPOs fell within this sector.
In 2010, the Investment Companies sector maintained its second place by IPO volume. There were 48 IPOs within this sector which raised €4,110m.
London overwhelmingly led in this sector with 39 Investment Company listings in 2010, and London also hosted the largest IPO for this sector, Vallar, which raised €822m on its Main Market, ranking it the eighth largest IPO overall in the year. This was a similar pattern to 2009 when London accounted for 13 of this sector’s 18 IPOs and 99% of the
€879m raised, bolstered by the largest investment company IPO in the year: the troubled Gartmore Group, which raised
€378m on IPO and has subsequently been acquired early in 2011.
Remaining in third position in 2010 was the Technology sector. There were 35 IPOs within this sector raising €1,750m.
Although Warsaw hosted 40% of
Technology transactions, 13 of these 14 listings took place on NewConnect and only €1m was raised in this sector across the whole exchange. The BME (Spanish Exchanges) came first by value, raising
€1,319m with two IPOs. Amadeus, the year’s fifth largest IPO raised €1,317m of this amount. London ranked second in terms of money raised, with value evenly distributed across eight transactions which together raised €382m.
The Pharmaceuticals and Biotech sector saw a sixfold increase in activity by volume from four in 2009 to 27 in 2010, moving it up six positions in the
rankings. A total of €736m was raised by IPOs in the sector in 2010 with OMX raising 69% of this total primarily as a
result of hosting the sector’s largest IPO, Chr. Hansen Holdings which raised
€450m on OMX’s Main Market. NYSE Euronext hosted the highest number of transactions with three IPOs on Euronext and four on Alternext, raising
€69m and €38m respectively.
The Mining sector saw 23 IPOs raising
€1,229m in 2010 moving up to fifth place by volume from eighteenth in the previous year, when two IPOs raised
€116m. This was the largest shift in position seen by any sector in 2010. The London Stock exchange hosted 17 of those 23 IPOs and raised 95% of value.
African Barrick Gold on London’s Main Market was the sector’s largest IPO, raising €645m.