Universidad de Granada
Kinematics and Star Formation in a sample of Nearby Galaxies
Tesis Doctoral.
M
aCarmen S´ anchez Gil.
Directores:
Dr. Emilio J. Alfaro Navarro Dr. Enrique P´erez
INSTITUTO D- ASTROFISICA D- ANDALUCIA - CSIC enero de 2011
ISBN: 978-84-694-2922-8
Quiero agradecer a mi familia, y en particular a mis padres, su gran apoyo a lo largo de mi vida y en mis estudios, adem´as de en estos cuatro a˜nos de tesis. Sin ellos no habr´ıa llegado a estar donde estoy.
Quiero agradecerle a Javi todo su apoyo y ´animos, para que yo siguiera cumpliendo mis sue˜nos, y luchase por ellos.
Agradecerles tambi´en a mis directores de tesis, Emilio J. Alfaro Navarro y Enrique P´erez, porque son unos grandes investigadores adem´as de muy buenos directores de tesis. Me han ense˜nado mucho y me han cuidado mucho tambi´en, no hubiese podido tener mejores tutores y me siento muy afortunada y agradecida por ello.
Agradecerles tambi´en a esos amigos que nacen de compartir un mismo sue˜no, un mismo trabajo... por quererme tal y como soy, por ofrecerme su amistad y haber estado ah´ı cuando lo he necesitado: Antonio, Juande, Mar, Diego, V´ıctor, Pablo, Geli.
Le dedico esta tesis a mi abuela Isabel.
iii
Agradecimientos iii
Contents v
1 Introduction 1
1.1 Spiral Galaxies and their structural evolution . . . 3
1.1.1 Galaxy classifications . . . 3
1.1.2 Varieties of Spirals . . . 4
1.1.3 Creating a spiral pattern . . . 5
1.2 Star formation in spiral galaxies . . . 7
1.3 Observing star formation . . . 10
1.3.1 Stellar evolution and spectra . . . 12
1.3.2 The Interstellar Medium and the Hαline . . . 15
1.3.3 Determining the recent history of star formation . . . 16
1.3.4 Dust and Attenuation . . . 16
1.4 Corrugations . . . 17
1.5 Thesis Overview . . . 18 v
2.1 Introduction . . . 22
2.2 Observations and data reduction . . . 24
2.3 Spectral Analysis: Emission - Line Fitting . . . 28
2.4 Results . . . 29
2.4.1 Kinematics and Geometry: Expanding bubbles . . . 32
2.4.2 Rotation curve of NGC 6946 . . . 39
2.4.3 Size of the Hα complex . . . 41
2.4.4 Density profile of the Hα complex . . . 43
2.4.5 Radial expansion velocities: Timescales. . . 46
2.5 Diagnostic Diagrams . . . 49
2.5.1 Computing the emission line ratios . . . 50
2.6 Summary . . . 51
3 Corrugated velocity pattern in spiral galaxies 57 3.1 Introduction . . . 57
3.2 Galaxy Sample . . . 61
3.2.1 NGC 278 . . . 61
3.2.2 NGC 1058 . . . 62
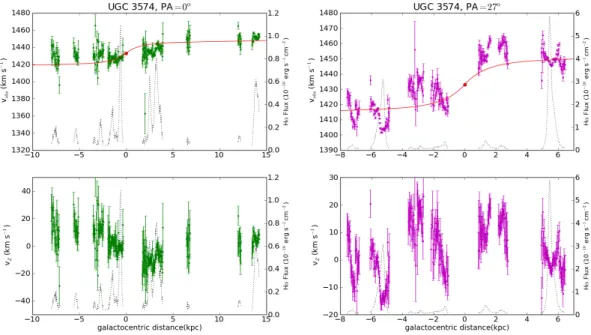
3.2.3 UGC 3574 . . . 65
3.2.4 NGC 2500 . . . 65
3.3 Observations and data reduction . . . 65
3.4 VZ calculation. Preliminary results. . . 69 vi
3.6 Summary . . . 78
4 Age Patterns in a sample of spiral galaxies 81 4.1 Introduction . . . 82
4.2 Sample and Data . . . 84
4.2.1 Galaxy Selection . . . 84
4.2.2 Data Reduction . . . 85
4.2.3 Age Calibration . . . 89
4.3 Age Maps . . . 92
4.3.1 M74 (NGC 628) . . . 94
4.3.2 IC 2574 . . . 96
4.3.3 M100 (NGC 4321) . . . 97
4.3.4 M94 (NGC 4736) . . . 98
4.3.5 M63 (NGC 5055) . . . 100
4.3.6 M51 (NGC 5194) . . . 102
4.4 Reliability and Robustness . . . 103
4.4.1 Lowest Threshold Pixel Mass for a Fully Sampled IMF . . . 104
4.4.2 Spatial Binning Scale . . . 105
4.4.3 Metallicity and IMF Variation . . . 107
4.5 Discussion and Summary . . . 108
5 Reddening analysis 115
vii
5.2 Dust extinction . . . 116
5.3 Using empirical relations . . . 119
5.3.1 FUV extinction factor: AF U V . . . 120
5.3.2 Hα extinction factor: A(Hα) . . . 121
5.3.3 A(Hα) versus AF U V relation. . . 121
5.4 Using an extinction law . . . 126
5.5 IRX-β relation . . . 135
6 General Conclusions and Future perspectives. 141 6.1 Summary . . . 141
6.2 Conclusiones . . . 145
Bibliography 149
viii
calc ++
Introduction
”La observaci´on, no la vejez, trae la sabidur´ıa.”
Publio Sirio.
Contents
1.1 Spiral Galaxies and their structural evolution . . . . 3
1.1.1 Galaxy classifications . . . . 3
1.1.2 Varieties of Spirals . . . . 4
1.1.3 Creating a spiral pattern . . . . 5
1.2 Star formation in spiral galaxies . . . . 7
1.3 Observing star formation . . . . 10
1.3.1 Stellar evolution and spectra . . . . 12
1.3.2 The Interstellar Medium and the Hαline . . . . 15
1.3.3 Determining the recent history of star formation . . . . 16
1.3.4 Dust and Attenuation . . . . 16
1.4 Corrugations . . . . 17
1.5 Thesis Overview . . . . 18
Las galaxias son grandes concentraciones de gas y estrellas ligadas gravitacionalmente, donde tiene lugar el proceso fundamental de la Astrof´ısica: el nacimiento, la evoluci´on y muerte de las estrellas. As´ı pues, la estructura de estos objetos est´a principalmente controlada por el ”feedback” (o retroalimentaci´on) entre los procesos de formaci´on estelar a gran escala y la din´amica gal´actica.
Entre la din´amica de la galaxia y su estructura morfol´ogica del gas, o patrones de la formaci´on estelar, existe una relaci´on de feedback. La din´amica gal´actica redistribuyendo el potencial gravitacional del gas, y ´este a su vez al cambiar afecta la din´amica del gas.
En esta tesis intentamos estudiar las relaciones existentes entre los mecanismos de la formaci´on estelar y las estructuras tanto espaciales como cinem´aticas de los discos gal´acticos. En particular nos centraremos en las galaxias espirales cercanas, las cuales muestran su caracter´ıstica estructura espiral - tan compleja como llamativa - y que est´an
´ıntimamente conectadas con la creaci´on de sus componentes estelares.
La mayor´ıa de las galaxias son tan lejanas que aparecen casi como fuentes puntuales, por lo que muchos estudios anteriores se han ocupado de medir las tasas globales de formaci´on estelar integrando la luz de todo el disco gal´actico. La compresi´on de la estructura gal´actica depende de la informaci´on proveniente de galaxias relativamente cercanas, donde sus estructuras son visibles. Algunas poseen una resoluci´on suficiente como para poder realizar estudios de la variaci´on con el radio, o distancia al centro gal´actico, de propiedades estelares. Estudios de galaxias cercanas pueden extrapolarse y ser aplicados a galaxias lejanas, cuya informaci´on est´a bastante limitada. Obviamente dichas galaxias lejanas mostrar´an o tendr´an algunas propiedades distintas respecto a las galaxias cercanas, cosa que debe ser tenida en cuenta cuando se trate de aplicar resultados de estas ´ultimas a las primeras.
Adem´as, dentro de las galaxias tenemos que a escalas inferiores del orden del kiloparsec la distribuci´on espacial de la formaci´on estelar est´a dominada por la estructura del gas donde se ha generado. Mientras que a mayores escalas es el potencial gravitatorio de la galaxia quien domina la distribuci´on de la formaci´on estelar (S´anchez et al. 2010).
Por tanto, intentaremos analizar los siguientes aspectos y escalas: Patrones temporales y espaciales de formaci´on estelar en complejos estelares, estructuras espacio-temporales de formaci´on estelar en discos de galaxias espirales, y patrones de velocidad vertical en brazos
espirales de una muestra de galaxias espirales.
Estudiamos por un lado a menores escalas los complejos estelares, en el Cap´ıtulo 2, y por otro a mayores escalas los patrones de la formaci´on estelar en brazos espirales, Cap´ıtulo 4, y el campo de velocidades del gas a trav´es de los discos de galaxias espirales, Cap´ıtulo 3.
Para la realizaci´on de esta tesis se han obtenido y utilizado datos espectrosc´opicos y fotom´etricos, provenientes tanto del William Herschel Telescope, en el Observatorio del Roque de los Muchachos, en La Palma, como datos de archivo del SPITZER y GALEX.
Estos datos abarcan un amplio rango de longitudes de onda (el ´optico, el ultravioleta y el infrarrojo), cubriendo el rango espectral desde los 1000 ˚Aaproximadamente hasta las 160 micras. Adem´as de presentar diferentes resoluciones espectrales.
1.1 Spiral Galaxies and their structural evolution
1.1.1 Galaxy classifications
Galaxies come in different flavours: spiral, elliptical and irregular, and there are several morphological classifications within these.
Aspiralgalaxy is relatively gas-rich and consists of a bright central bulge, a stellar disk, a baryonic halo and a halo of dark (non-luminous) matter. The stellar disk can be made up of a thick and a thin disk, with the thick disk extending beyond the thin both radially and in height. The two distinct regions have been clearly in our own Milky Way, a spiral itself. The thin disk is where most of the star formation occurs - within the spiral arms of gas and dust. It therefore contains younger stars which are richer in heavier elements and known as Population I. The central stellar bulge and the thick disk contain older generation Population II stars. The spherical baryonic halo contains minimal gas and globular clusters, each of which are spherical structures containing Population II stars. Globular clusters have masses of the order of∼105 M(1Mdenotes one solar mass: 1.989×1033g), although they are known to range from ∼ 103 Mto 5 ∼106 M(Meylan & Heggie, 1997). The dark halo is a recent addition to the picture of galaxies; its presence was revealed from the observed rotation curve (the graph of rotational velocities of neutral hydrogen clouds against radial distance from the galactic centre). The dark halo does not radiate, it exhibits
a gravitational presence only, but extends far beyond the baryonic halo and contains the majority of the mass of the galaxy. Spiral galaxies typically have masses of the order of 1011 M(Salaris & Cassisi, 2005).
Elliptical galaxies, appropriately named, are elliptical in shape and resemble the nuclei of spirals. They contain gas and Population II stars, but little or no dust or young stars.
Ellipticals are also classified by size and the range from dwarf to giant ellipticals with masses ranging from∼105 Mto ∼1012M(Salaris & Cassisi, 2005).
The morphological bridge between elliptical and spiral classification is the lenticular galaxy. Lenticular galaxies are described as either elongated ellipticals, or disk galaxies without spiral arms. Irregular galaxies have no apparent structure or symmetry and are relatively faint.
Active galaxies are galaxies which show strong non-thermal emission over a wide of wavelengths. The properties of their emission lend themselves to interpretation as due to the accretion of matter onto a black-hole. Some examples of active galaxies are radio-loud galaxies, Seyfert I and II galaxies, and quasars which are classified by their orientation to our line of sight. Starburst galaxies are mildly active galaxies in which star formation is taking place at an extremely high rate. This is a temporary phenomena as continued star formation at typical rates would exhaust the available reservoir of gas in much less than the age of the universe (a.k.a. the Hubble time) (Leitherer et al. 1995). Starbursts and active galactic nuclei (AGN) are often the result of an interaction between two galaxies.
This study is concerned with the disk (non-nuclear) regions of majority normal (non- starburst) spiral galaxies only and the formation that takes place within.
1.1.2 Varieties of Spirals
Spiral galaxies themselves come in different varieties. The most photogenic of these - the grand-desing spirals - have two long, well-defined spiral arms traced out by young bright stars. The arms are symmetric and long-lived. Multiple arm galaxies, as their name suggests, have many spiral arms and arm segments (spurs) although the arms are symmetrical in the inner disk. Finally, flocculent spiral galaxies have more chaotically distributed short arms.
Spiral galaxies can be described as early - or late - type galaxies. Early-type galaxies have a large bulge-to-disk ratio and have tightly wound arms, while late-type spirals have smaller bulge-to-disk ratio and the arms are looser.
About a third of all spiral galaxies are barred spirals, which have a bar-like structure around the bulge, made up of bright stars. The spiral arms extend out from the ends of the bars, where in normal spirals they would extend from the nucleus. The bars are thought to be recurring but temporary phenomena, appearing and decaying over the lifetime of the spiral galaxy. The characteristics used to classify normal spiral galaxies (e.g. early- or late- type) can also be applied to barred-spirals. Bar can trigger star formation in the nuclear regions of the galaxy, but do not appear to significantly affect the total star formation rate (SFR) in the disks (Kennicutt, 1998). Studies by Rozas et al. (1998) reveal a greater symmetry in the spiral arms of non-barred galaxies than barred galaxies. Similarly, studies by Knapen (1993) of the barred-spiral galaxy NGC4321 find an absence of a symmetric pattern in massive star formation efficiency (MSFE) which he suggests may be related to the presence of a bar.
1.1.3 Creating a spiral pattern
The driving forces that create these magnificent stellar spiral patterns have long been an object of study. However there is not a widely accepted theory to account for the graceful spiral patterns in disk galaxies, despite many decades of effort. Earlier theories that the spiral shape arose from the differential rotation of the galaxy had severe difficulties. The speed of the rotation would suggest that arms would wind up much more tightly than what was observed (Pikel’Ner, 1965).
Today, the most commonly accepted explanations involve density waves which triggered and maintained by mutual gravitational interactions of stars in the disk (Byrd, 1984). The waves begin as instabilities (Elmegreen, 1994; Vogel et al. 1988) that pass a critical threshold (Kennicut, 1989) and then sweep through the galaxy. However, there are two distinct theories for the different resulting spirals. The more steady, symmetric spiral arms are due to spiral wavemodes perturbations from a bar or a companion galaxy. When gas rotating around the galaxy centre moves faster than the arm, it slows down upon reaching the crest of the wave and moves radially outwards. The gas collapses in the crest, streaming
out along the arm, so that stellar complexes from spaced out along the arm. Multiple arms are generated by local instabilities which evolve into large spiral waves. The resulting large scale star formation can vary from galaxy to galaxy (Elmegreen, 1994).
This more generally accepted explanation, that spiral patterns are gravitationally driven variations in surface density in the old stellar disk, is supported by photometric data (e.g.
Zibetti et al. 2009) and streaming motions in high spatial resolution velocity maps (e.g.
Shetty et al. 2007). There is also a general agreement that gas seems to be essential.
A large fraction of spiral patterns may be accounted as been tidally driven, or the driven responses to bars, specially if orbiting dark matter clumps can excite patterns (Dubinski et al. 2008). But spirals can still develop in the absence of either trigger, as revealed in simulations.
Sellwood (2010), as well as summarize the current theories trying to explain the formation of the spiral patterns, focus on the idea that spirals are self-excited oscillations of the stellar disks, representing a great theoretical challenge.
There are two main, quite distinct, theories to explain the spiral patterns: global modes of rotationally-supported disks and recurrent transients. One idea (e.g. Bertin & Lin 1996) is that spiral features are manifestations of quasi-steady global modes of the underlying disk. Simple models of disk galaxies support many linear instabilities (e.g. Korchagin et al. 2005, Jalali 2007). The bar-forming mode is generally the fastest growing, but it has almost no spirality. These studies are therefore important to understand stability, but do not appear promising for spiral generation. The density wave theory for spiral modes, described in detail by Bertin & Lin (1996), invokes a more specific galaxy model with cool outer disk and hot inner disk. They find slowly evolving spiral modes, and they invoke shocks in the gas to limit the amplitude of the slowly growing mode, leading to a quasi-steady global spiral pattern.
The another idea is that the spiral arms are short-lived, recurrent transient patterns that originate either from shearing bits and pieces (e.g. Toomre 1990), or something more subtle (e.g Sellwood 2000). N-body simulations of cool, shearing disks always exhibit recurrent transient spiral activity, and this basic result has not changed for several decades as numerical quality has improved. Globally stable N-body simulations have manifested recurrent transient spiral patterns for many years, and the phenomenon has not changed as
numerical quality has risen. The transient nature of spiral patterns receives indirect support both from the importance of the gas and secular heating of disks.
A serious barrier to progress in this area has been the absence of observational discriminants that would favor one of these radically differing viewpoints over the other.
The predictions for density variations or gas responses at a single instant are essentially independent of the generating mechanism and do not depend strongly on the lifetime of the pattern.
It now seems clear that linear theory cannot yield a full description for the development of spiral patterns because N-body simulations suggest that non-linear effects manifest themselves at the relative overdensity of ∼ 2%, which is well below the believed spiral amplitudes in galaxies. Real galaxy disks, which contain both star clusters and molecular clouds, are not that smooth. Sellwood (2010) shows how non-linear effects could lead to a recurrent cycle of spirals, although the exact mechanism remains obscure.
1.2 Star formation in spiral galaxies
How and why do stars form in the spiral arms of these types of galaxies? There are most likely several mechanisms; one explanation, particularly for large scale star formation, is that the spiral structure is caused by gravitational instabilities, or density waves, within the galactic disk (Vogel et al., 1988; Elmegreen, 1994). As gas and dust in the stellar disk rotate about the galactic centre, the density waves sweep through the galaxy. Giant molecular clouds are concentrated at the wave crests, decreasing the speed of the gas and dust. The gas and dust concentrations eventually collapse to form stars, and pass through the crest of the density wave, forming the well-known visible spiral arms (Vogel et al., 1988).
Interestingly, Kennicutt (1989) suggests that, in some cases, the SF may not be triggered by density waves, but may be dependent on the density of gas throughout the disk.
The galactic disk undergoes differential rotation: the stars closer to the galactic centre are moving faster than those at a greater distance. This shearing effect would destroy the spiral pattern of the galaxy, but the density waves actually stabilize the spiral structure.
Star formation in a galactic environment is controlled by physical conditions which
vary over the galaxy’s lifetime. The global star formation rate (SFR) in normal spiral galaxies has been found reach up to∼20Myr−1, while in starburst galaxies it can reach
∼1000Myr−1. Much work is still being done in understanding what physical processes affect the star formation rate and the distribution of different stellar populations. Theories that describe star formation in spiral galaxy disks must incorporate a number of key physical factors that each have influence on star formation over the lifetime of the galaxy. These factors include gas density, metallicity, star formation history and the initial mass function (IMF) as described below.
Kennicutt (1998) took a sample of 61 normal disk, spiral galaxies and showed correlation between SFR and gas density that is largely independent of galaxy type (early or late type).
The gas surface density is found to be the primary determinant of the disk SFR (star formation in the disk as opposed to the nucleus) as the Schmidt law (Schimdt, 1959), given below, suggested.
dσ∗
dt =Aσmg (1.1)
where A is a constant,σg is the gas surface density andσ∗ is stellar mass. m is some constant power law index.
Dopita & Ryder (1994) fit observations of nearby spiral galaxies to an adaptation of the Schmidt law that predicts the SFR based on both the total matter surface density and the gas surface density, and is applicable to present-day spiral galaxies. The form of this adaptation is given in the equation below. They describe findings that support a model in which star formation is controlled by local rather than global mechanisms.
dσ∗
dt =A0σTnσgm (1.2)
where A’ is a constant, σT is the total local matter surface density and σg and σ∗ are as before. nandm are constant power law indices.
The gas density is altered by the movement of matter on various scales. Small scale disturbances occur through stellar winds; supernovae shock waves are an intermediate scale process, and galaxy mergers and spiral density waves provide larger scale movement. Spiral
density waves govern the distribution of dense gas clouds, and therefore, of star forming regions in spiral disks. However, they do not affect the total SFR (Dopita & Ryder,1994).
While we see clear evidence of star formation being constrained to the spiral arms, further structural information requires study of spatially resolved galaxies.
Metallicity is a term used to describe the concentration of elements heavier than helium, which in this context are referred to as metals. Stars fuse lighter elements to synthesize metals in their cores over the course of their life. The metallicity of the interstellar medium (ISM) is thus increased by the feedback of those elements through supernova explosions.
Distant galaxies were formed at a time when few stars had completed their evolution and returned metallic elements to the gas reservoir. Their stars have low metallicities as a result, and this can be seen in their spectra. Nearby galaxies are observed at a more recent epoch, at a later stage of their life. Many generations of stars have lived and died and metallicity has increased over this time.
The star formation history (SFH) is the evolution of the SFR over the lifetime of the galaxy. Earlier star formation affects the availability of gas for further star formation. Low- mass stars ’lock up’ gas for almost the entire lifetime of the galaxy, as do the remnants of high-mass stars (neutron stars & black holes) (Dopita & Ryder,1994). This gas is never released for further star formation.
In studies of star formation history, it is appropriate to assume the global SFR to be constant over time scales longer than ∼ 108 yrs (Kennicutt, 1998). Temporary bursts of star formation (starbursts) by definition increase the star formation rate initially but models of normal spiral galaxies by Iglesias-P´aramo et al. (2004) suggest that SFR returns to the original value (that expected for a normal galaxy) after ∼108 yrs.
The IMF refers to the populations of stars over a range of stellar masses in a new star forming region. The types of stars present during a galaxy’s youth can largely determine its evolution. As we’ve seen above, present stars can determine how much gas is available for star formation and the density of gas in the future. The IMF is a power law described by parameters such as the power law indexαand the upper and lower mass cutoffs. These correspond to the highest and lowest mass stars, respectively, that are present. Evolutionary synthesis models are used to estimate the populations that emit the observed integrated spectra. They generate the spectra emitted by different stellar populations as they evolve.
Upon comparison to observed spectra, various properties such as the ages and masses of star-forming regions can be determined. This study uses one particular model,Starburst99, created by Leitherer et al. (1999), to determine the ages of star forming regions.
The SFR in spiral galaxy disks has a strong dependence on the mass of the galaxy therefore it is more useful to consider SFR per unit mass. It also has a strong dependence on morphological type and redshift (a measure of distance and therefore the age at which we are observing the galaxy). There is a moderate dependence on (galaxy-galaxy) tidal interactions with companion galaxies, moderate/weak dependance on cluster environment, and weak dependence if any, on the bar and spiral structure (Kennicutt, 1998). No significant difference has been found in the SFR between grand design spirals and flocculent spirals (Elmegreen & Elmegreen, 1986; McCall & Schimdt, 1986). It is important to note that the SFR in the disks is largely decoupled from the SFR in the circumnuclear regions (bulge) of the galaxies (Kennicutt, 1998).
The study of star formation (SF) and star formation rates (SFR) in galaxies provides vital information regarding galactic evolution. The variation in SF activity across the different types of galaxies is influenced by many factors, including gas content, mass and dynamical environment (Kennicutt, 1998). Trends in SFRs and SF histories across galaxy types allow for predictions of galactic evolution with cosmic lookback time.
1.3 Observing star formation
If very hot, massive stars (T> 104K, M∼ 3−120 M; Allen 1973) are produced, the UV light they emit is energetic enough to ionize the surrounding gas (mostly hydrogen), which, when recombined, produces optical emission (e.g. the Balmer lines Hα, Hβ, etc).
Less massive stars (e.g. A stars: T∼ 7500−10000 K, M∼ 1.5−3 M; Allen 1973) also produce UV emission, but this radiation is not energetic enough to ionize the gas, so Balmer emission is not detected (optical continuum is of course emitted from OB and A stars). Hence, UV and Hαare useful as direct tracers of massive star formation.
Individual stars are only resolved in the closest galaxies, so global SF properties of galaxies are mostly obtained by integrated light measurements. The most common diagnostic methods use measurements in the ultraviolet (UV), far-infrared (FIR), or
nebular recombination lines (Kennicutt, 1998). Of particular interest for this thesis are measurements in the UV and the Hαrecombination line (656.3 nm).
SF studies using UV, particularly in the wavelength range 1250-2500 ˚A, provide information on the young stellar population (O,B, A stars). Ground-based observations cannot be performed over this wavelength range for galaxies with redshifts z < 0.5.
However, this spectral range is observable at optical wavelengths for high redshift galaxies (z ∼ 1 −5) (Kennicutt, 1998). Telescopes outside the Earth’s atmosphere (e.g. the Ultraviolet Imaging Telescope; Stecher et al. 1992, 1997) are able to observe nearby objects at 1250-2500 ˚A. UV emission, however, is extremely sensitive to dust extinction, and correcting for this effect can be difficult.
Recombination lines are emitted from gas ionized by young, very hot stars. Many different recombination lines have been used in studies of SF, but the most common is the Hαline. This line is strong only in the presence of the most massive, hottest stars (masses> 10M, ages< 20 Myr) that have enough energy to ionize the surrounding hydrogen, and so is an ideal probe fro the young stellar population. Hαemission is also affected by dust extinction. Both Hαand UV measurements can be corrected for dust extinction using infra-red (IR) measurements, which are largely unaffected by dust.
Integrated Balmer line emission from a galaxy can be used as a direct probe of its current SF activity. Kennicutt (1983) shows that the present rate of SF in late-type galaxies is comparable to the past rate, averaged over the lifetimes of the galaxy disks, i.e. the SFR is relatively constant over the lifetimes of most late-type disk galaxies (see also Searle et al. 1973).
All integrated light measurements are converted to SFRs by use of evolutionary synthesis models of galaxies (Kennicutt, 1998). Such models use summed stellar evolution tracks that are weighted depending on the initial mass function (IMF) used in the model (i.e. the initial distribution of mass in the model). The spectra or colours of the galactic models are synthesised as functions of age, and can be compared with the observed measurements to analyse the SF within galaxies.
The volume averaged SFR of the Universe has emerged as a key quantity of cosmic evolution (Lilly et al., 1996; Madau et al. 1996; Steidel et al. 1998). The concept behind this is to simplify the investigation of stellar history, independent of the statistics
of individual galaxies. Despite the appeal of this approach, galaxies are fundamental constituents of SF history studies (Madau et al., 1998). The ”Madau plot”, which considers the volume-averaged SFR as a function of redshift, uses galactic UV emission as a measure of SFR; Glazebrook et al. (1999) include Hαemision in their studies of SF history. Critical to our understanding of galaxy evolution at high redshift is our understanding of the relation between SF, UV and Hαemission in local galaxies.
1.3.1 Stellar evolution and spectra
The greatest influence on a star’s evolution is its mass. When a star is born from gravitational collapse of a dense hydrogen gas cloud, it begins by burning hydrogen into helium in its core. This is the longest evolutionary phase, during which the star is known as aMain Sequencestar. The main sequence corresponds to a curve on theHertzsprung- Russell diagram referred to by the abbreviation H-R diagram or HRD, see Figure 1.11. The H-R diagram is a scatter graph of stars showing the relationship between the stars’
absolute magnitudes or luminosity versus their spectral types or classifications and effective temperatures, on which each star of a particular mass and age has a given position. This is, The H-R diagram is an extremely useful way to follow the changes that take place as a star evolves. So, most stars are on the Main Sequence because that is where stars spend most of their lives, burning hydrogen to helium through nuclear reactions. Stars are arranged along the main sequence by their masses. At the lower right end of it are the lightest stars, upper left are the heaviest.This phase ends only when this fuel runs out in the core and the star must start to burn hydrogen in a shell surrounding the helium core. At this point, the star expands, with a larger surface area resulting in a higher luminosity. This, along with a drop in surface temperature leads to a change in the star’s position on the H-R diagram. The time scale of the initial H-burning phase is determined by the star’s mass, with massive stars moving off the main sequence quicker than lower mass stars. Low mass stars can remain on the main sequence for the lifetime of the galaxyin which they are born.
Stars are classified by surface temperature, in order of hottest to coolest: O,B,A,F,G,K and M. This classification system also extends further to cooler stars but the ones mentioned are the most basic. For main sequence stars, this classification is also a measure of mass, where O-type main sequence stars are the most massive and the rest are systematically less
1image credit: http://www.atlasoftheuniverse.com/hr.html
Figure 1.1: Hertzsprung-Russell diagram by Richard Powell (image credit:
http://www.atlasoftheuniverse.com/hr.html). 22,000 stars are plotted from the Hipparcos catalog and 1,000 from the Gliese catalog of nearby stars. An examination of the diagram shows that stars tend to fall only into certain regions on the diagram. The most predominant is the diagonal, going from the upper-left (hot and bright) to the lower-right (cooler and less bright), called the Main Sequence. In the lower-left is where white dwarfs are found, and above the main sequence are the subgiants, giants and supergiants. The Sun is found on the main sequence at luminosity 1 (absolute magnitude 4.8) and B-V color index 0.66 (temperature 5780K, spectral type G2).
massive. Our Sun is an intermediate size, G-type star, remaining on the main sequence for
∼10 billion years.
All stars emit a continuous blackbody spectrum (light at all wavelengths) called aPlanck curve with a single peak at a particular wavelength which depends on the temperature of the star’s atmosphere, according toWien’s law:
λpeakT = 2.897×10⁻³mK (1.3)
The surface temperatures of main sequence stars are ultimately dependent on their mass, and therefore higher mass main sequence stars peak in intensity shorter (bluer) wavelengths, or higher frequencies and energies, than lower mass main sequence stars. These massive stars also exhibit a greater total flux over all wavelengths. The mass of the star thus determines not only its evolution but also the properties of the light it emits during its lifetime.
Some of the stars in a galaxy are in other phases, having moved off the main sequence.
Short-lived red giants and supergiants are the later phases of intermediate and massive stars respectively, neutron stars and black holes are the remnants of massive stars and white dwarfs are the remnants of intermediate mass stars.
In spiral galaxies, which contain many young bright stars, these phases contribute little to the overall observed spectra. While intense radiation at short wavelengths might possibly be the result of a large number of intermediate mass stars, the peaks of stellar spectra are so steep that it is much more likely that the emission indicates the presence of much fewer high mass stars. This is the basis of interpretations of observed radiation.
When we observe stars, the light we see is not just that which is directly emitted by the star. The material that lies within our line of sight obstructs stellar light by absorbing and radiating. To correctly interpret what is observed, we must first consider what might happen to stellar light before it reaches us.
1.3.2 The Interstellar Medium and the Hαline
The interstellar medium (ISM) is a diffuse mixture of gas and dust that surrounds stars and permeates the enormous spaces between both stars and galaxies. The gas is 90% hydrogen and 10% helium with traces of heavier elements (Salaris & Cassisi, 2005). The ISM has a density that ranges from 10−3 to 10 particles/cm3, compared to the molecular hydrogen gas clouds where stars form which have densities of 10 to 102 particles/cm3 (Salaris &
Cassisi, 2005).
Hydrogen gas makes up the bulk of the ISM. It can be ionized to form an HII region (singly ionized hydrogen) by photons at energies of 13.6 eV, which free ground state electrons. This corresponds to a wavelength of 912˚A. Lymann continuum photons are those shortward of 912˚Aand are required to ionise the hydrogen gas.
The ionized gas exhibits emission lines upon recombination of free electrons and protons, as the electrons cascade down to lower energy levels. The hydrogenBalmer seriesis the set of lines emitted when electrons drop to n=2 from higher energy level. The HαBalmer line, emitted during the 3→2 level transition, is at the optical wavelength 656.3 nm (6563˚A).
Other Balmer lines like Hβ (4→2 level transition at 486 nm) are emitted as well, but the Hαtransition is the most common transition during recombination. Case Brecombination states that all Lyman series photons (emitted upon transitions to n=1) are re-absorbed by other hydrogen atoms, an optically thick approximation (Osterbrock & Ferland, 2006). In this scenario, 0.45 Hαphotons are emitted for each ionizing photon absorbed by the HI gas (neutral hydrogen).
As mentioned in the previous section, small numbers of massive stars peak at shorter wavelengths, and dominate short wavelength radiation. Ionizing Lyman continuum photons are dominated by emission from massive O-type stars withM >10M (Iglesias-P´aramo et al., 2004; Dopita & Ryder, 1994; Kennicutt, 1998). The ionization is ultimately responsible for the Hαemission, so the Hαline is a tracer for these stars.
Other UV wavelengths are also observed in studies of star formation. At the near- UV (NUV) wavelength of 2000˚A, significant amounts of radiation comes from stars with M > 1.5M (Iglesias-P´aramo et al., 2004). The integrated UV spectrum between 1500 and 2500˚Ais dominated by high mass M &5M OB-type stars (Kennicutt, 1998).
1.3.3 Determining the recent history of star formation
The UV-dominating O-B type stars have lifetimes.108 yrs (Iglesias-P´aramo et al., 2004;
Kennicutt, 1998). The UV thus indicates star formation over the last∼108yrs. Meanwhile, the O-type stars that contribute significantly to the ionizing flux have even shorter lifetimes as they quickly evolve to red supergiants or erupt as supernovae. Their lifetimes are estimated at . 107 yrs by Iglesias-P´aramo et al. (2004), or . 2×10⁷ yrs by Kennicutt (1998). The Hαemission line is a result of ionization due to fluxes from these stars, so this wavelength traces ’instantaneous’ massive star formation no more than 20 Myrs ago.
A comparison of UV and Hαfluxes would give a good indication of recent star formation history. Emission at particular wavelengths reduce as their progenitor stellar types die out.
As a new star forming region evolves, the Hαline emission declines before the UV emission does, leading to a decrease in the ratio of Hαline emission to UV flux. This flux ratio is very sensitive to the age of a new star forming region. Over the long term however, it would stabilize as even the UV-dominating O-B type stars have moved off the main sequence.
Normal spiral galaxy models by Iglesias-P´aramo et al. (2004) show that the Hα-to-UV flux ratio when integrated over the entire disk stabilizes for galaxies with ages ≥ 109 yrs since the epoch of galaxy formation. This corresponds to galaxies with redshift (distance) of z . 7−10. So the flux ratio integrated over the galactic disk will be constant for the nearby galaxies in this study. However, there will be much spatial variation due to the varying ages of individual star forming regions across the disk. The conversion from observed UV and Hαfluxes to a recent star formation history based on intrinsic fluxes requires an understanding of the effects of ISM opacity and dust on the observed fluxes.
1.3.4 Dust and Attenuation
The Lyman continuum photons that do not encounter the hydrogen gas component of the ISM can be then scattered by dust. While gas consists of atoms, molecules and ions, dust contains small particulate matter made of various kinds of ices, graphite, silicates and possibly metals (Mihalas & Binney, 1981; Salaris & Cassisi, 2005). The collective effect of the gas and dust on the radiation is known as extinction.
Dust attenuates all radiation but its effect is wavelength dependent, with shorter (bluer)
wavelengths being more susceptible to scattering by dust. It absorbs shorter wavelengths and re-emits at longer wavelengths, creating a net ’reddening’ effect. UV wavelengths are shorter than the Hαline, so dust scattering will shift the Hα-to-UV flux ratio (Iglesias- P´aramo et al. 2004), and alter the resulting SFR estimate. UV dust extinction should be independent of metallicity, according to Iglesias-P´aramo et al. (2004), and should therefore affect all galaxies similarly. In some galaxies (M83 and M101), extinction has been shown to be a strongly declining function of radius (Martin et al., 2005). Infrared (IR) measurements are much less affected by dust and so can be used to calibrate the SFR.
1.4 Corrugations
Gas and stars in the Milky Way show quasi-periodic vertical deviations from the formal galactic plane. This kind of pattern, so named corrugations, seems to be a general phenomenon affecting the disk galaxies. Recent studies, both theoretical and observational, have shown that similar structures might appear in the field of the velocity vertical component and could be derived from the radial velocity maps on face-on galaxies. The mechanisms which generate these spatial patterns are connected with those able to arrange the gas and form the large fertile clouds where stars will born. Different proposed models for the generation of corrugations anticipate distinct velocity fields providing a good observational test to these mechanisms.
While studying the galactic distribution of HI in order to define a more precise galactic coordinate system, Kerr (1957) and Gum et al. (1960)
The young stellar component and gas of the Galactic disk show systematic displacements from the formal galactic plane. In the inner regions of our Galaxy the so called corrugations appear to dominate the vertical structure of the galactic disk. This phenomenon, which could be defined as a residual wavy structure with respect to the defined mean plane (Gum, Kerr, & Westerhout 1960; Lopckman 1977; Spicker & Feitzinger 1986; Alfaro, Cabrera- Ca˜no, & Delgado 1992a), has been observed throughout the different spiral arms and galactocentric radial directions (Spicker & Feitzinger 1986; Malhotra & Rhoads 1995).
This phenomenology has also been observed in other galaxies (Florido et al. 1991), which would seem to indicate the universality of these kind of structures. Infrared studies
appear to indicate that old stars show similar displacements to those found in the young galactic component, which in turn suggests that they might be of gravitational origin (Djorgovski & Sosin 1989; Rhoads 1995). The amplitude and scale of the corrugations show a wide range of values (50-150 pc in amplitude and 1-13 kpc in scale), depending as much on the spiral arm as on the different spiral tracers chosen for their study (Spicker &
Feitzinger 1986; Florido et al. 1991).
Besides these large-scale features, the interstellar medium also shows local deviations from the formal plane, referred to in the literature as chimneys, bubbles, holes and worms (Heiles 1984, 1989; Li & Ikeuchi 1990). These structures seem to arise from local star-gas interactions and show no large-scale patterns.
The gas and young stellar population used in most of these studies also provide the observational basis for studying star-formation processes and for determining the locations and scales of the star-formation regions in our Galaxy and others (e.g., Efremov 1978;
Efremov & Sitnik 1988; Elmegreen & Elmegreen 1983). Star formation seems to occur on all scales with a hierarchic pattern generated and controlled by self gravity and turbulence (Elmegreen & Elmegreen 1996). Only in galaxies with strong density waves does the gas become structured by regular forces, and supercomplexes appear as the dominant, largest scale of star formation. Our Galaxy provides us with several examples of large-scale star- formation regions. In grand-design spiral arms, such as Carina-Sagittarius, the density waves seem to control the pattern of star formation, leading to the generation of typical supercomplexes arranged along the whole arm, whereas the Orion-Cygnus arm could have been generated by the balance between turbulence and shear.
1.5 Thesis Overview
This thesis concentrates on the study of the star formation, at different scales. We study the star formation in star complexes, at local scales of SF, as well as the SF across the galactic disks triggered by large scales processes as density waves.
This first chapter introduces some of the scientific background regarding spiral galaxies and star formation studies. Chapter 2 studies the case of a peculiar stellar complex, located at the end of one of the spiral arms of NGC 6946. This gas-star complex of 700 pc in
diameter which appears populated by tens of young stellar clusters, and a Super Star Cluster (SSC) as massive as 106 M. The ionized gas, as drawn by the Hα emission, delineates an almost circular shape which we show here to be in expansion. Previous studies have analyzed the stellar component of the complex, as well as the structure of the atomic and ionized gas; these analyses were restricted to the blueshifted component along the whole extent of the bubble or to a smaller inner region where both sides of an expanding bubble were seen. In this work we present a complete spectroscopic study of this object for two position angles crossing each other close to the young massive SSC. We have obtained new data with a spectral resolution six times better than previous spectroscopic studies, taken under atmospheric conditions better than those previously reported, allowing us to detect the approaching and receding walls of one the largest bubbles in external galaxies ever studied in detail.
The kinematical analysis shows a large expanding bubble, whose walls appear to be highly structured with superposed smaller shells, likely originated as the result of star forming events occurring at the edges of the larger scale shell, a la Huygens. We also study some diagnostic diagrams of the ionized gas and conclude that most of the observed ionization is originated by photons from hot stars, but with clear evidence that some of the gas is shock ionized.
This peculiar complex is an excellent laboratory for the analysis of the interaction and feedback between the gas where the stars were formed and the young and massive generation of new born stars.
In chapter 3 we present the preliminary results from the study of the corrugations, described above in Section 1.4, for a sample of four mostly nearby and nearly face-on spiral galaxies. We find that two of these galaxies, NGC 278 and NGC 1058, clearly show the same kinematical behaviour than that found by Alfaro et al. (2001) in NGC 5427, and similar to the one expected in a galactic bore generated by the interaction of a spiral density wave with a thick gaseous disk (Martos & Cox 1998).
In Chapter 4 we present the results of comparing optical observations at Hαemission line, taken with Taurus Tunable Filter (TTF), with UV GALEX images of a sample of nearby (distance<10 Mpc) spiral galaxies. We explore a new approach for connecting large-scale dynamical mechanisms with star formation processes in disk galaxies, based on deriving
burst ages for young stellar populations in spatially resolved, spiral galaxies. The study is performed using a pixel by pixel differential analysis of the ionized gas emission in respect to the stellar far-UV ionizing radiation. The resulting flux ratio is calibrated in term of age by using galactic evolution models and discussed in the light of the large-scale dynamical motions in the disk.
Uncertainties in the Hαto FUV flux ratio, that can be affected by many physical causes such as variable IMF, non-solar metallicities, non-constant SFHs or SFR, dust attenuation, etc (e.g. Iglesias-P´aramo et al. 2004, Meureret al. 2009, Lee et al. 2009), are taken into account. Moreover, the simplified parameters used by galactic evolution models are only examples for basic spiral galaxy evolution, without taking into account such parameters as perturbing objects. Therefore we use these models as a guideline to indicate the relative ages of the stellar populations in the spiral arms. Anyway, this work shows that a comparison of the Hαand FUV observations of nearby spiral galaxies is a relatively direct way to probe burst age variations in spirals.
The resulting age maps show the pattern of ages across these resolved galaxies, remarking as well their morphology and age gradients across the spiral arms, in many cases, in circumnuclear regions (M94) or in HII complexes (IC 2574). A remarkable result has been obtained for M51, where evidence stellar age gradient along the short dust branches, spurs, has been found.
Chapter 5 presents a deeper and detailed analysis of the resulting reddening correction in the previous Chapter 4. The different approaches done to realize the reddening correction are presented and discussed, as well as the reasons for choosing the applied reddening correction method with IR data.
Moreover, taking advantage of the huge amount of pixels and therefore of data to do robust statistics, we independently derive our own IRX-β relation (Heckman et al. 1995, Meurer et al. 1999) based on our pixel-by-pixel analysis of the six star forming galaxies in our sample.
The final Chapter 6 contains a brief discussion of the conclusions from this thesis, and some ideas for future work.
Kinematical & Physical
properties of a 700 pc large bubble in NGC 6946
Contents
2.1 Introduction . . . . 22 2.2 Observations and data reduction . . . . 24 2.3 Spectral Analysis: Emission - Line Fitting . . . . 28 2.4 Results . . . . 29 2.4.1 Kinematics and Geometry: Expanding bubbles . . . . 32 2.4.2 Rotation curve of NGC 6946 . . . . 39 2.4.3 Size of the Hα complex . . . . 41 2.4.4 Density profile of the Hα complex . . . . 43 2.4.5 Radial expansion velocities: Timescales. . . . 46 2.5 Diagnostic Diagrams . . . . 49 2.5.1 Computing the emission line ratios . . . . 50 2.6 Summary . . . . 51
2.1 Introduction
The galaxy NGC 6946 harbors a young star cluster which can be considered as the most massive known cluster within the limits of the Local Volume, its estimated mass being around 106 M, (Larsen et al. 2001, 2006). The cluster is not isolated but it appears to occupy the central region of a large stellar complex, ≈ 700 pc diameter, which was first reported by Hodge (1967) and lately rediscovered and studied by Larsen & Richtler (1999) in their extensive mapping of young cluster populations in nearby galaxies. Since then, this stellar complex has been extensively studied, both through the stellar population as well as through the gas component.
The complex contains more than a dozen of young clusters with ages ranging between 10 and 30 million years (Elmegreen et al. 2000). A detailed study of the stellar population performed by Larsen et al. (2002) allowed them to derive the star formation history (SFH) of the isolated stellar component, showing a present-day high star formation rate (SFR) and an important decrease of the SFR of isolated stars at the time most of the cluster population was born. It, thus, looks like that most of the star formation, between 10 and 15 Myr ago, took place in the mode of cluster formation, rather than forming isolated stars or loose associations.
The massive cluster has an estimated age of 10-15 Myr, from its integrated photometry, with a luminosity of MV =−13.2 and a mass of 106 M as derived from both luminosity and dynamical criteria (Larsen et al. 2001, 2006). The internal velocity dispersion of its members has been calculated to be close to 9 km s−1(Larsen et al. 2006). All these characteristics suggest this object to be the young evolutionary stage of a classical globular cluster. These massive young objects have been denominated in the recent literature by different names, we adopt here that of super star cluster (SSC).
The ionized gas in the complex has also been the subject of recent studies. Efremov et al. (2002) analyzed long slit spectra, centered on the Hα emission line, and taken with the 6 m BTA and 10 m Keck-I telescopes. The radial velocity curves along the slits show the existence of several dips or bumps superimposed on a smooth curve compatible with the expected velocity rotation of the galaxy at these positions. Particularly, conspicuous is the detection of a steep fall-off in the radial velocity curve along P.A.=83◦, centered 700 away from the SSC location in the side of lower emission density, with an amplitude
larger than 70 km s−1. These authors considered that feature as the signature of an expanding semibubble. Three-dimensional optical spectroscopy was lately performed with the INTEGRAL spectrograph attached to the 4 m William Herschel Telescope (WHT) at Roque de los Muchachos Observatory and with the 6 m BTA telescope at the Special Astrophysics Observatory of the Russian Academy of Science (Alfaro et al. 2007; Alfaro &
El´ıas 2006; Efremov et al. 2007). The main picture emerging from these analyses is that we are facing an Hα torus, around 800 pc in diameter, which draws an almost complete circle, 280◦ long, while it is open in the northeast side of the torus. In addition, two other Hα features, one associated to the SSC and the other forming an arc-shaped structure, 130◦ long, located at the northwest of the SSC are also evident. This last feature of Hα emission is also spatially associated to the main concentration of the youngest stars (4-My old) in the complex ( see Figure 1 in Larsen et al. 2002)
The atomic gas in the complex still lacks a detailed analysis at the adequate spatial resolution, but a few important results have been derived from some recent works (Boomsma 2007; Boomsma et al. 2008; Efremov et al. 2007). The complex appears to be placed in a region of HI low density, which extends further to the northeast, forming an extensive HI hole a few kpc in size. This is not strange since NGC 6946 is known to be a galaxy with a large number of HI holes and high velocity clouds (HVC) (Kamphuis 1993), some of which have kinetic energies above 1053 erg. A look to Figure 14 in Efremov et al. (2007) shows that, at the position of the SSC, the distribution of HI density presents a local minimum for a wide range of gas velocities, and some smaller knots are visible at velocities well below the mean value.
All these features make this region an excellent laboratory for analyzing the interaction and feedback between the gas and the youngest products of the star formation processes, in particular, concerning the small-scale relationship between the interstellar medium (ISM) and the SSC. Good spectral and spatial resolution are thus crucial for determining the main physical properties of the gas along the entire super-bubble and for drawing the true geometry of the complex. Through the data presented here, we attempt to clarify which physical mechanisms could apply in this region of NGC 6946.
The paper is organized into six sections; the first is this introduction. In Section 2, we describe the observations and the primary reduction of the spectra. The analysis of the emission lines is shown in Section 3, and in Sections 4 and 5 we explain and discuss the
results obtained. Finally, Section 6 summarizes the main conclusions of this work.
2.2 Observations and data reduction
We obtained long-slit spectroscopy with the double arm ISIS spectrograph attached to the WHT, at the Roque de los Muchachos Observatory (La Palma) during August 2003. This instrument consists of two intermediate dispersion spectrographs operating simultaneously, separating the blue and red spectral regions, which are imaged onto an EEV12 and a MARCONI2 CCD chips, respectively. In this way, we have two spectral ranges observed simultaneously, a blue one centered around Hβ (4861 ˚A), and a red one around Hα (6563
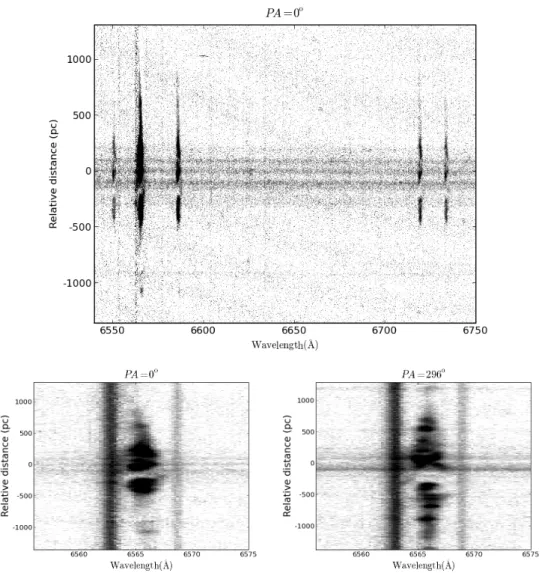
˚A). The gratings used, R1200R and R1200B, provide a dispersion of 0.23 ˚Apixel−1. The slit width of 1 arcsec projects onto about 3.64 pixels full width half maximum (FWHM) on the detector; the spatial sampling along the slit is 0.2 arcsec pixel−1. The slit was placed at two position angles, 0◦ and 296◦, approximately centered on the shell (Figure 1). In table 2.1, we present a comparison of our observational configuration with previous spectroscopic studies dealing with this object and in table 2.2 the log of the observations.
The spectra were reduced and calibrated following the standard procedure. Bias subtraction, flat-fielding, wavelength and flux calibration were done with the IRAF1 task ccdproc. For the wavelength calibration CuNe and CuAr lamps were used. The standard star Feige 110 from the Oke (1990) catalogue was used for flux calibration. Sky subtraction was done using the IRAF NOAO package task background. For each wavelength range, the different exposures at each slit orientation were combined, eliminating cosmic rays and bad pixels, thus obtaining four final spectra.
We use an intermediate band Hα image (central wavelength 657.7 nm and FWHM=18 nm) taken with the Nordic Optical telescope (NOT)2.
1IRAF is distributed by the National Optical Astronomy Observatory, which is operated by the Association of Universities for Research in Astronomy, Inc., under cooperative agreement with the National Science Foundation
2The image kindly made available by Y. Efremov is taken through a filter called wide ’Hα filter’ in the NOT system
Figure 2.1: Gemini Multi-Object Spectrograph (GMOS) image from Gemini North on Mauna Kea, in the bands g’, r’, i’, and Hα (Gemini Observatory/Travis Rector, University of Alaska Anchorage). The image has been adapted, showing the relative position of the complex respect to the galaxy center. The two slit positions, used at this study, are also drawn on the complex. North is up and east to the left.
Figure 2.2: Two-dimensional long-slit red spectra, centered at Hα (6562 ˚A), for both slit positions;
relative distance increase toward the north. Top: the sky subtracted red spectrum for P.A. = 0◦, showing the Hα (6562 ˚A), [NII]λ6548, 6584 ˚A and [SII]λ6716, 6730 ˚A emission lines. Bottom: red spectra (not sky subtracted) for both slit positions zoomed into Hα show a detailed complex structure of the ionized gas.
Table2.1:Observationalconfigurationofdifferentspectroscopicstudies Instrument&DetectorWavelengthRange(˚A)ExposureTime(s)Dispersion(˚A/pixel)PixelScale(00/pixel)Seeing(00) Multi-PupilFiberSpectrogragh,6mBTAa6140−71203×9000.760.141.2,1.5 CCDEEV42-40(2048×2048pixel) 6mSAORAStelescopeb6015−72501,2×18001.20.391.4,2.7 PhotometricsCCD-detector(1024×1024pixel) Keck-I10mtelescopec6220−85504×33000.048–0.9 D1decker(1400×100.15slit) ISISatWilliamHerschelTelescope6034−70883×18000.230.21.0 MARCONI2CCD(4096×2048pixel) NOTES.-ValuesgivenwithinthetableareonlyrelatedtoHαrangedata,fortheanalysisofthevelocityfield. a Efremovetal.2007. b Efremovetal.2002. c Efremovetal.2002.Butlimitedtoafullextentof1400 alongtheslit,withapositionangleof-10◦ ,closetotheSSClocation. Table2.2:JournalofObservations DateP.A.(deg)WavelengthRange(˚A)ExposureTime(s)Slit(00 )Airmass 2003Aug2106034−70882×1800+12001.01.23 2003Aug212966034−70883×18001.01.17
2.3 Spectral Analysis: Emission - Line Fitting
The final combined sky subtracted red spectrum at P.A.=0◦ is shown in Figure 2a, in the spectral range 6540-6750 ˚A covering the five main emission lines, Hα, [NII]6548,6583, and [SII]6716,6731. Figure 2b shows an expanded view around Hα of the spectrum along P.A.=0◦, 296◦ (not sky subtracted). The origin of the spatial scale has been arbitrarily set to a point close to the shell center (where the two slits intersect). The residuals of the sky subtraction can be seen (in the top panel) along the slit at 6553.5 and 6562.8 ˚A. Upon close visual inspection, these spectra readily show that the Hα emission is highly structured in velocity along the slit, with a series of components that indicate the presence of shells.
In this section, we describe the detailed measurement of these structures with the aim of obtaining the kinematical information along the two slit positions.
We fit the Hα emission line at each pixel along the slit. Line flux, FWHM, central wavelength, and their corresponding errors, are calculated with the STARLINK3 package DIPSO. The continuum level is simultaneously fitted with a first-order polynomial.
The sky subtracted spectra in Figure 2 (top panel) show residuals in some sky emission lines. Particularly, the atmospheric Hα line is relatively conspicuous and close to the Hα emission in NGC 6946. After some trials we decided to fit the spectra prior to the sky subtraction (bottom panel). The reason is that, at some locations along the slit, there is a faint high velocity blue shifted Hα component very close to the sky Hα emission, and the fitting subroutines work better by fitting an additional component to the sky emission, while the results are worst working with the residual sky emission in the sky subtracted spectra. This method has the additional advantage of obtaining a map of the uniformity of the spectral resolution and quality of the wavelength calibration along the slit, from the fits to the sky emission lines.
Figure 2.3 illustrates two example fits of the slit at P.A.=0◦. In the case of the spatial increment 500 along the slit, we fit two components to the Hα nebular emission, and one component to each of the sky emission lines at 6562.8 ˚A and 6568.9 ˚A, respectively.
The case of the spatial increment 565 along the slit is an example where we could fit three components to the nebular Hα. This extra third component is present only in some locations along the slit, while in most other locations the fit is satisfactory with just two
3http://star-www.rl.ac.uk/star/docs/sun50.htx/sun50.html
components (inside the stellar complex) or with just a single one (corresponding to the emission outside the complex, see the next section for details). From these fits, we estimate the values for the following variables :
Vobs = (λobs−λ0)c
λ0 , (2.1)
F W HM = Wobs c
λ0, (2.2)
EW = line intensity Ic
, (2.3)
r = (y−y0) 0.2 1 3600
π
1805.5×106, (2.4) whereVobs is the line velocity in km s−1, observed from the Earth,cis the velocity of light andλ0 =6562.8 ˚A the air reference wavelength of the line. Observed velocities were then tied to the heliocentric system. So the velocity of the gas, throughout this paper, refers to the heliocentric velocity. In equation (2.2), F W HM is expressed in km s−1, Wobs is the FWHM from the fit. In equation (2.3),EW is the equivalent width and Icthe continuum flux, which corresponds with the independent term of the first-order polynomial fit. The line intensityis the integrated flux of the corresponding Gaussian component. Finally, in equation (2.4), r is the relative distance, in pc, from a fixed point of the spectrum y0. Such point corresponds with the intersection of the two slits (in each case); y is the pixel coordinate along the slit, where the scale is 0.2 arcseconds per pixel and 5.5 Mpc is the distance to NGC 6946 (Sofue 1997).
2.4 Results
Previous studies of this star-forming complex suggest that we are facing a large superbubble in expansion (Efremov 1999; Elmegreen et al. 2000; Efremov et al. 2002, 2007; Larsen et al. 2002). Here, we perform a detailed analysis on the Hα kinematics and how it relates with the physical properties and geometry of the emission gas.


![Figure 3.10: Diagnostic Diagrams for the four galaxies of the sample, following the same diagrams that in the case of NGC 6946, [SII]/Hα vs](https://thumb-us.123doks.com/thumbv2/123dok_es/12545288.0/89.892.227.655.167.1018/figure-diagnostic-diagrams-galaxies-sample-following-diagrams-case.webp)
