y del Cosmos
Nuclear activity and interstellar medium in a sample of isolated galaxies
Jos´e Sabater Montes
Departamento de Astronom´ıa Extragal´actica, Instituto de Astrof´ısica de Andaluc´ıa-CSIC
Tesis Doctoral
Editor: Editorial de la Universidad de Granada Autor: José Sabater Montes
D.L.: GR 2282-2009 ISBN: 978-84-692-3071-8
Departamento de F´ısica Te´orica y del Cosmos
Universidad de Granada
Departamento de Astronom´ıa Extragal´actica
Instituto de Astrof´ısica de Andaluc´ıa - CSICNuclear activity and interstellar medium in a sample of isolated galaxies
Memoria presentada por:
Jos´e Sabater Montes
para optar al grado de
Doctor por la Universidad de Granada
Dirigida por:
Lourdes Verdes-Montenegro Atalaya (IAA-CSIC) Stephane Leon Tanne (IRAM)
Granada, 28 de abril de 2009
Como directora de la tesis tituladaNuclear activity and interstellar medium in a sam- ple of isolated galaxies, presentada porD. Jos´e Sabater Montes,
D ˜na. Lourdes Verdes-Montenegro Atalaya, Doctora en Cien- cias F´ısicas y Cient´ıfico Titular del Departamento de Astronom´ıa Extragal´actica del Instituto de Astrof´ısica de Andaluc´ıa - CSIC, yD. Stephane Leon Tanne, Doctor en Ciencias F´ısicas.
Declaran:
Que la presente memoria, tituladaNuclear activity and interstellar me- dium in a sample of isolated galaxiesha sido realizada porD. Jos´e Sa- bater Montesbajo su direcci´on en el Instituto de Astrof´ısica de An- daluc´ıa - CSIC. Esta memoria constituye la tesis queD. Jos´e Sabater Montespresenta para optar al grado deDoctor por la Universidad de Granada.
Granada, a 28 de abril de 2009
Fdo:
Lourdes Verdes-Montenegro Atalaya
Fdo:
Stephane Leon Tanne
A Yolanda
Nuclear activity and interstellar medium in a sample of isolated galaxies
Jos´e Sabater Montes 28 de abril de 2009
i
´Indice general
Resumen v
I Introduction 1
1 Introduction to the thesis work 3
1.1. Active Galactic Nuclei . . . 3
1.2. Evolution of galaxies and environment . . . 4
1.3. Thesis outline . . . 6
2 AMIGA project 7 2.1. CIG sample . . . 8
2.2. Refinement . . . 9
2.3. ISM multiwavelength study . . . 16
2.4. Extension to submillimeter . . . 22
2.5. Virtual Observatory . . . 22
II Radio continuum and far infrared emission 25 3 Sample and data used for this study 27 3.1. Definition of the sample . . . 27
3.2. Presentation of the data . . . 28
4 Properties of the radio continuum emission 33 4.1. NVSS and FIRST data . . . 33
4.2. Detection rate . . . 33
4.3. Luminosities . . . 34
4.4. Radio vs. optical properties . . . 37
4.5. Comparison between NVSS and FIRST fluxes . . . 39
5 Radio continuum to far-infrared correlation 43 5.1. Introduction . . . 43
5.2. Luminosity correlation . . . 43
5.3. Q parameter . . . 44
5.4. Background sources . . . 46
5.5. High resolution imaging of radio-excess galaxies . . . 48
5.6. Final rate of radio-excess galaxies . . . 52 i
6 Far infrared colour 53
6.1. Introduction . . . 53
6.2. Statistics . . . 53
III Optical spectra 57 7 Sloan Digital Sky Survey spectra 59 7.1. Introduction . . . 59
7.2. SDSS data . . . 59
7.3. SDSS sample . . . 64
7.4. Determination of the stellar populations . . . 70
7.5. Measurement of the spectral lines . . . 76
7.6. Diagnostics . . . 82
7.7. Statistics . . . 94
7.8. Study . . . 94
IV Global study 99 8 AGN candidates catalogue 101 9 Comparison between different methods 103 9.1. Radio-excess galaxies . . . 103
9.2. Far infrared colour . . . 104
9.3. SDSS spectra and data from the literature . . . 104
10 Comparison with different environments 107 10.1. Radio-excess galaxies . . . 107
10.2. Improved study of the morphology, luminosity and environment rela- tion with the radio-excess . . . 113
10.3. SDSS radio-loud AGN . . . 125
10.4. SDSS active galaxies . . . 126
V Conclusions 131 11 Conclusions 133 12 Conclusiones 135 VI Appendices 139 A Survival and bivariate analysis 141 A.1. Survival analysis . . . 141
A.2. Bivariate analysis . . . 142
A.3. Survival bivariate analysis . . . 142
B Additional information 145 B.1. SDSS . . . 145
´INDICE GENERAL iii
C VLA data 147
C.1. VLA observing sessions . . . 147 C.2. VLA data . . . 151
List of Figures 183
List of Tables 185
Bibliography 187
Resumen
La evoluci´on de las galaxias depende del entorno. En particular la actividad nu- clear, producida por la acreci´on de materia en el agujero negro supermasivo central, podr´ıa verse afectada por dicho entorno. Se piensa que la interacci´on entre galaxias disminuye el momento angular del gas, provocando su ca´ıda hacia el agujero negro central, aliment´andolo de este modo. Seg´un esta hipotesis se esperar´ıa un aumento de la actividad nuclear en las galaxias en interacci´on, sin embargo se encuentran resul- tados contradictorios. En unos estudios se encuentra que la tasa de actividad nuclear aumenta con la interacci´on mientras que en otros es independiente de ´esta.
Gran parte de las diferencias entre los distintos estudios podr´ıa deberse tanto al uso de distintos criterios para la selecci´on de las muestras como a la ausencia de una muestra de referencia. El proyecto AMIGA (An´alisis del Medio Interestelar en Galaxias Aisladas;http://amiga.iaa.es/) ofrece una muestra estad´ısticamente significativa de galaxias aisladas libres de interacci´on durante un tiempo significativo de su vida. Esta muestra constituye la base para estudiar el efecto de las interacciones sobre la actividad nuclear, el medio interestelar y la formaci´on estelar. El primero de estos aspectos constituye el objeto de estudio de la presente tesis.
Para llevar a cabo el estudio de la actividad nuclear en la muestra AMIGA de galaxias aisladas, hemos usado distintos m´etodos. Por una parte hemos estudiado la correlaci´on entre la emisi´on en infrarrojo lejano y en radiocontinuo de las galaxias de la muestra. Pues un exceso de radiocontinuo en esta correlaci´on indica la presencia de un n´ucleo activo emitiendo a longitudes de onda de radio. Tambi´en hemos usado el color entre la emisi´on en infrarrojo medio y lejano, que nos indica la presencia de un candidato a n´ucleo activo. Asimismo hemos determinado el origen dominante de la ionizaci´on del n´ucleo usando los espectros en visible del Sloan Digital Sky Survey (SDSS). Por ´ultimo hemos realizado una busqueda en la bibliograf´ıa existente del tipo de actividad nuclear que pudieran presentar las galaxias de nuestra muestra.
Se pueden destacar los siguientes resultados. No encontramos galaxias aisladas que muestren un valor superior a un factor 5 de exceso de radio con respecto a la correlacion radio continuo-infrarrojo lejano. Usando el l´ımite m´as permisivo de un factor 3, encontramos tan solo un 2 % de galaxias con actividad nuclear tipo radio, las tasas m´as bajas encontradas con respecto a cualquier otra muestra. Comparando con muestras de galaxias situadas en entornos m´as densos se observa un aumento de la tasa de actividad en longitudes de onda de radio conforme aumenta el n´umero de galaxias en interacci´on o la cercan´ıa al centro de un c´umulo. Se ha descartado que este cambio en la tasa de actividad provenga de la relaci´on entorno-morfolog´ıa o entorno- luminosidad. Adicionalmente se ha cuantificado la precisi´on del m´etodo de selecci´on de candidatos a galaxias activas usando el color infrarrojo obteniendo una tasa de acierto del 72.2 % para este m´etodo. El n´umero de galaxias activas seleccionadas en base a los datos del Sloan Digital Sky Survey alcanza una tasa del 21.7 % y no muestra
v
una dependencia tan alta con el entorno en comparaci´on con las galaxias activas tipo radio. El n´umero de galaxias activas que muestran l´ıneas de emisi´on anchas (Seyfert 1) con respecto al total de galaxias activas es del 10.2 %. Se ha creado un cat´alogo de candidatos a n´ucleos activos de galaxias en la muestra de galaxias aisladas. Este cat´alogo servir´a para futuros estudios de los efectos del entorno sobre la actividad nuclear.
Del trabajo realizado en esta tesis doctoral podemos concluir que el entorno es fundamental para producir el fen´omeno de la actividad nuclear de tipo radio, ob- serv´andose un aumento de la actividad conforme aumenta la interacci´on (galaxias en interacci´on, pertenencia a un c´umulo, cercan´ıa al centro del c´umulo) para todos los tipos morfol´ogicos y todos los rangos de luminosidades. La muestra AMIGA de gala- xias aisladas se confirma como la muestra de galaxias, incluidas las de tipo temprano, m´as libre de efectos de la interacci´on, con una tasa de actividad nuclear tipo radio casi nula.
Part I
Introduction
1
Chapter 1
Introduction to the thesis work
1.1. Active Galactic Nuclei
In 1909 Fath discovered emission lines in one spectrum of the “spiral nebula”
NGC 1068. The spectrum was composed of absorption lines ans emission lines like the ones found in gaseous nebulae. Seyfertdiscovered in 1943 that some galaxies have a point-like nucleus which is the origin of these emission lines. This was the first systematic study looking for this kind of galaxies. Optical emission from these galaxies was similar to the emission of a planetary nebula plus the emission of a typical star like the Sun (spectral type G).Seyfertbelieved that the width of the emission lines was produced by Doppler widening. With this assumption the velocity of the source of the emission lines in the nuclear region would be of about 8 500 km s−1. This velocity is compatible with a very hot gas moving at high velocities in comparison with the mean value of the velocity of stars and gas in a typical galaxie which is of about 300 km s−1. These galaxies were called Seyfert galaxies.
In the sixties and seventies of the XXth century active galactic nuclei (AGN) took an important role in astronomy studies that is maintained till nowadays. After the initial development of radioastronomy by the pioners like Jansky and Reber the first surveys of the sky looking for accurate possitions of astronomical sources and their optical counterparts started. Smith(1951) obtained accurate positions for Cyg A, Cas A and other sources.Baade & Minkowski(1954) identified using these positions the optical counterparts of Cyg A and Cas A. With these optical identifications it was possible to determine their distances from their optical spectra. The origin of the radio emission was very distorted galaxies with very high radio luminosities, even larger than their optical luminosities. Later, is was discovered a type of galaxies with very bright galactic nuclei in radio, theradio-stars. After checked that they were extragalactic sources they were called quasars. Quasars are galaxies similar to Cyg A and Cas A but located at very high distances.
Sandage(1965) found a large population of objects similar in all the aspects to quasars but without a strong radio emission. These objects presents a high emission in the ultraviolet (UV) with respect to the optical. They are called QSO (Quasi-Stellar Objects). It was found a parallelism between QSOs and quasars, located in distant galaxies, and Seyfert galaxies. Later there were new discoveries like a kind of radio- emiting galaxies called BL Lac, galaxies with low ionization nuclear emission regions (LINERs) and other types of galaxies with similar characteristics. All the common features between these galaxies indicates a similar origin of the characteristics for
3
these objects belonging all to the wide concept of AGN.
The emission of an AGN can be explained by the presence of a supermassive com- pact nuclear object within the nucleus of the active galaxy. Now it is widely accepted that the origin of the emission comes from a supermasive black hole. This super- masive black hole has to be fed by some mechanism that removes angular momentum from the gas to produce the nuclear activity (see review of Wada 2004, and references therein).
A wide number of different types of AGN exist. A first attempt to classify the types of galaxies has been possible based on the presence or not of broad emission lines and on the presence or not of strong radio emssion. Seyferts 2 and Narrow Line Radio Galaxies (NLRG) have only narrow lines while Seyferts 1, QSO, quasars and Broad Line Radio Galaxies (BLRG) present wide lines. BL Lac objects (blazars), NLRG, quasars and BLRG present strong radio emission and blazars show a unusual optical spectrum. Blandford & Rees (1978) proposed that BL Lac objects were ra- diogalaxies viewed just in the same axis of the radio-jet emission. Rowan-Robinson (1977) proposed that wide lines were not present in Seyfert 2 galaxies because they were obscured and not due to their absence. Antonucci & Miller(1985) detected the wide emission in the polarized light of the Seyfert 2 galaxy NGC 1068. The unified model for AGN tries to explain all these facts adding the presence of a dust torus around the supermasive black hole and its acretion disk. The presence of wide emis- sion lines would only depend on the point of view of the observer with respect to the orientaion of the dust torus. The strong radio emission would depend on the presence of a radio jet. Hence, all the types of AGN would be explained with an unified model (see Antonucci 1993).
It is usefull to clarify some concepts. The word “activity” is sometimes used to denote both an enhancement in the star formation (usually a starburst) and the effect of the feeding of a supermassive blak hole. The presence of a supermassive black hole does not imply the presence of an AGN. The black hole could be in a quiescent state or the level of activity could be undetectable due to several reasons like a low signal to noise ratio in the measurements. Hence, a non detection in a diagnostic method would not necessarily imply the absence of the black hole nor even the absence of activity. Although some AGN are called radio-quiet the emission at radio frecuencies is a typical characteristic of an AGN. The concept radio-loud AGN is somewhat arbitrary. Some authors define a radio-loud AGN as one with a radio luminosity of more than 1023W Hz−1, others as one with a “significant” presence of radio emission and others as an AGN located at one of the sides of the bimodal population found in the histograms ofLB/Lradio(Hooper et al. 1995;Kellermann et al.
1989). Due to this ambiguity we will always deffine the physical properties of the AGN with radio emission that we study, avoiding as possible the concept radio-loud.
1.2. Evolution of galaxies and environment
Galaxy evolution depends strongly on the environment. In particular, galaxy- galaxy interactions can induce nuclear activity by removing angular momentum from the gas and, in this way, feeding the central black hole. Hence, a higher rate of nu- clear activity would be expected in interacting galaxies. However, different studies of this topic lead to contradictory results. Some works conclude that galaxies host- ing an active galactic nucleus (AGN) have a higher number of companions than those with nonactive galactic nuclei (Petrosian 1982;Dahari 1985;MacKenty 1989,1990;
1.2. EVOLUTION OF GALAXIES AND ENVIRONMENT 5 Rafanelli et al. 1995;Alonso et al. 2007), while others do not find this excess of in- teracting companions or find it only marginally (Bushouse 1986;Laurikainen & Salo 1995;Schmitt 2001).Miller et al.(2003) find that the fraction of AGN is independent of the environment even in clusters. Fuentes-Williams & Stocke(1988) found only a marginal excess of similarly-sized galaxies but a clear excess of faint companions for Seyfert galaxies. Most recent works find a different result depending on the type of Seyfert galaxy (Dultzin-Hacyan et al. 1999;Krongold et al. 2003). RecentlyAlonso et al.(2007) found for a sample of isolated galaxies a lower fraction of Type 2 AGN (23%) than for close galaxy pairs (30%). The proportion of galaxies hosting an AGN in extreme environments as compact groups was reported byCoziol et al.(2000) to be 70%, while 50% was reported byShimada et al.(2000). More recentlyMartinez et al.
(2006b,a) studied a sample of 215 compact groups from the UZC (Updated Zwicky Catalog), and 42 galaxies belonging to compact groups from the Hickson Catalogue.
They found in the first case 43% of AGN and 20% of transition objects (objects with spectroscopic properties between pure AGN and pure star forming), while in the sec- ond subset 57% showed characteristics consistent with low-luminosity AGN with a low-ionization nuclear emission-line region (LINER) type and 16% were transition objects.
Selection of AGN candidates using the radio-FIR correlation is also found in the literature. This correlation is very tight and can be used to distinguish galaxies for which their radio continuum emission is due to star formation and which follow the correlation, and those with an AGN causing an enhancement of the radio continuum emission that lie above the correlation. It is known that all AGN are radio sources at some level, e.g.,Ho & Ulvestad(2001) find that 85% of the nuclei of Seyfert galaxies are detected at radio wavelengths, with a wide range of intensities and morphologies (from compact cores to jet-like features). According toReddy & Yun(2004) a sig- nificant fraction of radio-excess objects are associated with luminous AGN. For their sample of 114 galaxies in nearby clusters, they find that 70% of the radio-excess galax- ies are AGN based on different indicators, such as the presence of radio jets, X-ray emission, or optical emission lines.Reddy & Yunconsider this percentage as a lower limit of AGN among the radio-excess galaxies. They also analyse the sample ofMiller
& Owen(2001) and find that 80% of the radio-excess galaxies in their sample of local Abell clusters are spectroscopically-confirmed AGN. Far-infrared (FIR) colours have also been demonstrated as useful to identify AGN candidates (de Grijp et al. 1985).
The contradictory results reached in previous studies might be due to the design of the surveys, sometimes focused on galaxies with emission lines, or due to differ- ent selection criteria of the samples. For example, although the sample inAlonso et al. (2007) was selected with a well-defined isolation criterion (i.e., no compan- ions within a radius of 100 kpc and a velocity difference of 350 km/s) these pa- rameters are not restrictive enough to ensure that a galaxy has been isolated for a significant fraction of its life. Hence, a well-defined sample of really isolated galax- ies, which have remained isolated for a significant part of their life, is needed. The goal of the AMIGA project (Analysis of the interstellar Medium of Isolated GAlax- ies, http://www.iaa.csic.es/AMIGA.html; Verdes-Montenegro et al. 2005) is, therefore, to identify a statistically-significant sample of the most isolated galaxies in the local Universe and to quantify the properties of the interstellar medium in these galaxies and its relationship to the star formation and nuclear activity.
1.3. Thesis outline
From here on we will present the work developed by J. Sabater for this PhD. In Chapter2we present the AMIGA project which is the frame where the thesis study was carried on. The definition of the sample of isolated galaxies and the description of the data is made in Chapter3. In Chapter4we show part of the work developed by J. Sabater for the study of the properties of the radio emission of the AMIGA galaxies that was presented inLeon et al. (2008). Then we make use of different methods to select the AGN-candidates: the radio continuum to far infrared correlation in Chapter5, the far infrared colour in Chapter6, and the optical spectra in Chapter7.
In Chapter8, we present the final catalogue of AGN-candidates. We compared the accuracy of the different methods used in Chapter9. We discuss and compare our results to other studies from the literature in Chapter 10. Finally, we present our conclusions and the future work in Chapter11(a version in Spanish is presented in Chapter12).
Chapter 2
AMIGA project
It is well known that galaxy evolution is strongly affected, or even driven, by the influence of nearby galaxies (nurture), but a well defined baseline for assessing its frequency and amplitude is lacking. AMIGA project (Analysis of the interstellar Medium of Isolated GAlaxies) started at Instituto de Astrof´ısica de Andaluc´ıa (IAA) to provide such a baseline by quantifying the properties of a well defined sample of nature dominated galaxies and involves currently more than 30 participants from∼15 international institutions. As a result we have built a multifrequency database for
∼1000 isolated galaxies, public through a Virtual Observatoty-interface in our Web page (http://amiga.iaa.es/orhttp://www.iaa.csic.es/AMIGA.html), and studied their global properties.
The main aims of the AMIGA project are:
to compare and quantify the properties of different phases of the interstellar medium in this sample, as well as the level of star formation and nuclear activity.
to quantify the role of nature versus nurture, distinguishing between environ- mental density and one-on-one interactions.
to use this control sample as template in the study of star formation and galaxy evolution with respect to denser environments.
The starting sample for the AMIGA project is based on the Catalogue of Isolated Galaxies (CIG;Karachentseva 1973) which is composed of 1050 galaxies. In previous works we have:
1. revised all of the CIG positions (Leon & Verdes-Montenegro 2003);
2. optically characterised the sample (Verdes-Montenegro et al. 2005);
3. performed a revision of the morphologies (Sulentic et al. 2006);
4. derived mid-infrared (MIR) and FIR basic properties (Lisenfeld et al. 2007);
5. performed a careful reevaluation of the degree of isolation of the CIG (Verley et al. 2007c,b); and
6. derived radio continuum properties (Leon et al. 2008).
The following outline tries to clarify the main contributions by J. Sabater to this project:
7
Refinements to the sample:
• distances: Compilation of the distances to the sources with a velocity red- shift of less than 1500 km s−1(see§2.2).
• morphology: Compilation of the actual morphology of the nearby AMIGA galaxies and management of the stored data (see§2.2).
• isolation: Determination of the local density estimator that correspond to a determined tidal force and the comparison of the isolation parameters of visually identified interacting galaxies (see§2.2).
Multiwavelength study:
• optical study: Determination of the 3D location of the CIG galaxies with respect to the main galactic structures known (see§2.3).
• FIR study: Contribution to the study of the colors of the sample and man- agement of the stored data (see§).
• Radio continuum study: co-manager (together with Dr. S. Leon) for the compilation of radio continuum data and analysis (see§2.3).
• Nuclear activity study: manager for the compilation of nuclear activity data and analysis. This study constitutes the bulk of the PhD work (from
§3on).
2.1. CIG sample
AMIGA is trying to avoid two forms of “nurture”: one-on-one interaction and galaxy environmental density. Our reference sample is drawn from the Catalog of Isolated Galaxies, which originally included N=1050 nearby galaxies in the northern hemisphere, which corresponds to 3% of the galaxies included in the CGCG (Catalog of Galaxies and Clusters of Galaxies, Zwicky et al. 1961,1963,1965,1966,1968;
Zwicky & Kowal 1968) withmpg <15.7 andδ > −3 deg. The main properties and strengths of this sample are explained in detail inVerdes-Montenegro et al.(2005) and Sulentic et al.(2006). The number of individuals in the catalogue allows us to have a statistically useful sample of several hundred galaxies after refinement of the sample.
The CIG sample was assembled by Karachentseva(1973) with the requirement that no similar sized galaxies with angular diameter Dibetween 1/4 and 4 times diam- eter DPof the CIG galaxy lie within 20×Di:
Rip≥20×Di
1
4 ×DP ≤Di≤4×DP
where Ripis the angular separation between the primary and the companion galaxy.
CIG is complemented by catalogs of galaxy pairs (CPG, Catalog of Paired Galax- ies; Karachentsev 1972), triplets (Karachentseva et al. 1979) and compact groups (Hickson catalog of Compact Groups, HCG; Hickson 1982, largely quartets). All of these interacting comparison samples were visually compiled using an isolation criterion.
2.2. REFINEMENT 9
a) b)
Figure 2.1: Shifts between the new positions and the positions retrieved from the SIMBAD database. The panel a) shows the differences inαandδand the panel b) the histogram of these differendes. The dotted line is the difference inα, the dashed line the difference inδand the solid line is the difference in the absolute distance between the new position and the SIMBAD one.
2.2. Refinement
We have performed several improvements to the CIG sample, being among the most relevants the reevaluation of the positions, redshifts and distances, morphologies and isolation degree.
Positions
Main paper:Leon & Verdes-Montenegro(2003)
A comparison between the CIG positions found in the SIMBAD database and in the Updated Zwicky Catalogue (UZC;Falco et al. 1999),Leon & Verdes-Montenegro (2003) found differences of up to several tens of arcsec. New positions were calcu- lated by applying SExtractor to the Digitized Sky Survey CIG fields with a spatial resolution of 1.200. The results were visually checked and for 118 galaxies it was necessary to recompute the assigned positions due to complex morphologies (e.g. dis- torted isophotes, undefined nuclei, knotty galaxies) or the presence of bright stars.
There were found differences between older and newer positions of up to 3800with a mean value of 2.9600relative to SIMBAD and up to 3800and 2.4200respectively relative to UZC. Based on star positions from the APM catalog it was determined that the Dig- itized Sky Survey astrometry of five CIG fields has a mean offset in (α,δ) of (−0.9000, 0.9300) with a dispersion of 0.400. These results were confirmed using the 2MASS All- Sky Catalog of Point Sources. The intrinsic errors of the method combined with the astrometric ones were of the order of 0.500.
Redshifts and distances
Main paper:Verdes-Montenegro et al.(2005)
a) b)
c) d)
RA
Dec
Figure 2.2: Aitoffprojection in ecuatorial coordinates with the location of CIG galax- ies divided in radial velocity ranges. The different subplots correspond to the follow- ing velocities: a) 0–3000 km s−1; b) 3000–6000 km s−1; c) 6000–9000 km s−1and d) 9000–12000 km s−1. The position of Virgo cluster is indicated with a circle (∅=12◦) in panel a), Abell clusters with a richness class of 1 or 2 are also plotted as circles proportional to their radii.
The archival and bibliographic search carried out by Verdes-Montenegro et al.
(2005) reveals data for almost the entire sample, from NED (50% of the sample) and 41 other different sources. This includes 10 new redshifts obtained from HI observa- tions performed by us. Redshift distances were derived there for all galaxies with V>
1000 km s−1assuming H0=75 km s−1Mpc−1. A total of 50% or more of the sample shows a quasi-homogeneous redshift distribution.
The redshift distribution for the CIG galaxies re-enforces the evidence for a bi- modal structure seen earlier in smaller samples. The peaks at redshift near 1500 and 6000km/s correspond respectively to galaxies in the local supercluster and those in more distant large-scale components (particularly Perseus-Pisces). The two peaks in the redshift distribution are superimposed on 50% or more of the sample that is dis- tributed in a much more homogeneous way. The CIG probably represents one of the most homogeneous local field example that has ever been compiled.
Morphologies
Main paper:Sulentic et al.(2006)
All morphological types are found in the CIG catalogue, and the CIG sample is large enough to permit discrimination on the basis of galaxy type. Compilation of the
2.2. REFINEMENT 11
Figure 2.3: Distribution of recesion velocities of CIG galaxies. Histogram of the opti- cal heliocentric recesion velocities. One galaxy (CIG 402) is out of the velocity range of the plot with a recesion velocity of 40 658 km s−1. The solid line corresponds to a homogeneous redshift distribution of the same sample size, velocity distribution and Schechter function. The dashed line has been obtained by scaling down the previous distribution by a factor of 0.6.
types given by several databases was obtained (NED and LEDA), but in many cases contradictions were found. This motivatedSulentic et al. (2006) to revise the mor- phologies for the whole sample using the Palomar Observatory Sky Survey 2 (POSS2) images ('80% of the sample) and new CCD images observed mainly at the 1.5m Ob- servatorio de Sierra Nevada in Granada, Spain. These images improve the sensitivity achieved by Palomar Observatory Sky Survey I (POSS-I) images and allowed us to obtain more accurate morphological classifications.
The comparison with independent classifications made for an SDSS overlap sam- ple of more than 200 galaxies confirmed the reliability of the early vs. late-type dis- crimination and the accuracy of spiral subtypes.
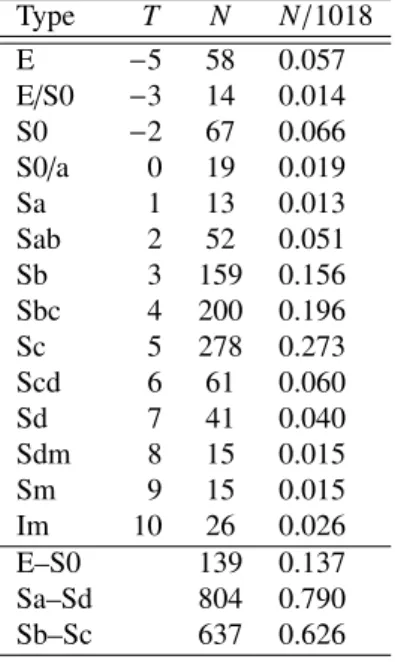
The results of the morphological reevaluation of the CIG galaxies withVR>1000 km s−1(N=1018) are listed in Table2.1.
A considerable number of galaxies in the catalog (n=193) are flagged for the presence of nearby companions or signs of distortion likely due to interaction. This most isolated sample of galaxies in the local Universe is dominated by two popula- tions:
1. 82% are spirals (Sa-Sd) with the bulk being luminous systems with small bulges (63% between types Sb-Sc) and
2. a significant population of early-type E-S0 galaxies (14%).
Most of the types later than Sd are low luminosity galaxies concentrated in the local
Figure 2.4: Distribution of morphologies of CIG galaxies depending on the radial velocity. The different subplots correspond to the following recession velocities: a) 0–
3000 km s−1; b) 3000–6000 km s−1; c) 6000–9000 km s−1and d) 9000–12000 km s−1.
Table 2.1: Revised morphological classification of the CIG sample (Sulentic et al.
2006).
Type T N N/1018
E −5 58 0.057
E/S0 −3 14 0.014
S0 −2 67 0.066
S0/a 0 19 0.019
Sa 1 13 0.013
Sab 2 52 0.051
Sb 3 159 0.156
Sbc 4 200 0.196
Sc 5 278 0.273
Scd 6 61 0.060
Sd 7 41 0.040
Sdm 8 15 0.015
Sm 9 15 0.015
Im 10 26 0.026
E–S0 139 0.137
Sa–Sd 804 0.790
Sb–Sc 637 0.626
2.2. REFINEMENT 13
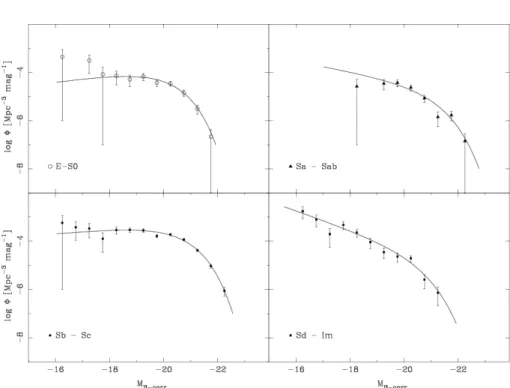
Figure 2.5: OLF for the different morphological types present in the CIG sample together with the corresponding Schechter fit shown as a solid line.
supercluster where isolation is difficult to evaluate. The late-type spiral majority of the sample spans a luminosity rangeMB−corr=−18 to−22 mag. Few of the E/S0 popula- tion are more luminous than−21.0 marking the absence of the often-sought superL*
merger (e.g. fossil elliptical) population. The rarity of high luminosity systems results in a fainter derivedM* for this population compared to the spiral optical luminosity function (OLF, see Figure2.5). In other samples, which always involve galaxies in higher density environments,M∗E/S0is almost always 0.3-0.5 mag brighter thanM∗S, presumably reflecting a stronger correlation between M* and environmental density for early-type galaxies.
Isolation
Main papers:Verley et al.(2007c,b)
After revision,Adams et al.(1980) andKarachentseva et al.(1986) assigned codes to the galaxies that were seen to violate these criteria: 902 galaxies remained as iso- lated (code=0), 85 as marginally isolated (code=1) and 64 were interacting galaxies (code=2).
One of the improvements of the AMIGA sample was the revision and quantifica- tion of the isolation criteria in a computerized way.Verley et al.(2007c) used digitised POSS-I images to perform this task. These images were analysed out to a minimum projected radius R≥0.5 Mpc around 950 CIG galaxies (those withinVr =1500 km s−1 were excluded). All galaxy candidates in each field brighter than B=17.5 were identified with a high degree of confidence using the LMORPHO software (Odewahn
-4 -2 0 2 4 6 Difference in magnitude 0
500 1000 1500 2000 2500
Number of galaxies
3
Figure 2.6: Comparison of the magnitude difference distributions for the neighbour galaxies considered by Karachentseva’s criterion (factor 4 in size with respect to their associated CIG galaxy, grey histogram) and for the remaining neighbours (outside the factor 4 in size, unfilled histogram).
1995). It was generated a catalogue of approximately 54000 potential neighbours (redshifts exist for∼30% of this sample).
Six hundred sixty-six galaxies pass and two hundred eighty-four fail the origi- nal CIG isolation criterion. The available redshift data confirm that the catalogue of neighbours involves a largely background population rather than physically associated companions. We found that the exclusion of neighbours within a factor of four in size around each CIG galaxy, employed in the original isolation criterion, corresponds to
∆Vr≈18000km s−1indicating that it was a conservative limit.
In Figure2.6is shown the comparison of the magnitude difference distributions for neighbour galaxies considered by Karachentseva’s criterion and for the remaining neighbours. With this comparison is posible to test whether a criterion of isolation based in the difference in magnitudes between the candidate to isolated galaxy and its neighbours is equivalent or not to Karachentseva’s criterion as claimed byAllam et al.(2005) andXinfa et al.(2005). The overlap between the two distributions shows that a cut in magnitude at 3 is a rather good approximation because it loses only 10% of the neighbours selected by Karachentseva on the basis of the linear size of 4. But the contamination also shows that the hypothesis of flat surface brightness profile of galaxies is not always true: the cut in magnitude includes a large number of galaxies not considered by Karachentseva. Hence, the two definitions to seek for the neighbours are not fully equivalent.
We used two parameters to estimate the influence exerted by the neighbour galax- ies on the CIG galaxy: the local number density of neighbour galaxies and the tidal strength affecting the CIG galaxy defined as:
k-density estimator from the distance to the k-th companion (neither the central galaxy nor the k-th companion are taken into account), we can obtain the fol-
2.2. REFINEMENT 15
Figure 2.7: Isolation characterization of CIG galaxies. The y-axis represents the “k- density estimator” and the x-axis the “Tidal forces estimator”. CIG galaxies are repre- sented as grey crosses, green triangles are galaxies in triplets, red circles are galaxies of Abell clusters and magenta squares are galaxies in Hickson Compact Groups. The mean value for each sample is indicated as vertical and horizontal lines with the same colour code.
lowing parameter:
ρk= k−1 V(rk)
withV(rk)=4πrk3/3, whererkis the distance to the k-th nearest neighbour.
Tidal forces estimator the tidal force per unit mass produced by a companion, as explained in (Dahari 1984), is proportional to:
Mi
r3ipα(DiDP)1.5
S3 =Q
where Mi is the mass of the companion,rip is the distance from the primary galaxy to the companion andS the projected separation between the centers of the two galaxies. The parameterQ, defined by this equation, is a dimensionless estimation of the gravitational interaction strength.
We show that both parameters together provide a comprehensive picture of the environment. For comparison, those parameters have also been derived for galaxies in denser environments such as triplets, groups and clusters. In Figure2.7are shown
Figure 2.8: Local number density vs. tidal strength. The final bisector fit is shown by the plain red line. The dotted red lines represent the final 2σ dispersion: the CIG galaxies within these limits are depicted by pluses, the CIG rejected during the successive iterations are shown by points.
the two types of isolation parameters for CIG galaxies and the other samples of galax- ies in denser environments. The mean tidal strenght estimator increases from CIG galaxies to triplets and compact groups samples. The separation is not so clear in the y-axis because triplets and compact groups are samples defined with the help of iso- lation requirements. The tidal strength and the local number density estimations are complementary parameters and it is important to use both in order to have an accurate picture of the repartition of galaxies surrounding a primary galaxy.
The CIG galaxies show a continuous spectrum of isolation, as quantified by the two parameters, from very isolated to interacting. The fraction of CIG galaxies whose properties are expected to be influenced by the environment is however low (159 out of 950 galaxies). The isolated parameters derived for the comparison samples gave higher values than for the CIG and we found clear differences for the average values of the 4 samples considered, proving the sensitivity of these parameters.
In Figure
2.3. ISM multiwavelength study
In order to study the properties of the different components of the ISM, the star formation and the nuclear activity in isolated galaxies, we have observed or compiled multiwavelength information for the CIG sample: optical, far-infrared, HI line and radio continuum data for the whole sample and Hαand CO line for a velocity limited sample. The data is publicly available in the web page of the project.
2.3. ISM MULTIWAVELENGTH STUDY 17
Table 2.2: Optical luminosity function parameters for the CIG sample.
Sample Φ(Mpc−3mag−1) α M∗ Mag range for the fit
CIG N=725 6.3(±0.7)×10−4 -1.27±0.06 -20.31±0.07 -16.3 to -22.3 CIG N=666 7.5(±0.6)×10−4 -0.82±0.09 -20.11±0.07 -16.3 to -22.3
Optical characterization
Main paper:Verdes-Montenegro et al.(2005)
The optical luminosity is a tracer of the visible light and stellar content. We per- formed an analysis of the properties of the nearly redshift-complete CIG with empha- sis on the Optical Luminosity Function (OLF) which we compared with other recent estimates of the OLF for a variety of environments. Our derivation of the CIG OLF was consistent with other studies of the OLF for lower density environments. This comparison via the Schechter parameter formalization (Schechter 1976) showed that:
1) M* increases with galaxy surface density on the sky and 2)αshows a weaker ten- dency to do the same. The OLF of the CIG sample as a function of the morphology is studied inSulentic et al.(2006).
We corrected the apparent magnitudes due to systematic errors in the CGCG cat- alog, galactic dust extinction, internal extinction and K correction.
The optical luminosity function of our set of galaxies can be parametrized by means of a Schechter function model with the parameters M∗andα:
Φ(M)= Φ∗100.4(α+1)(M∗−M)exp(−100.4(M−M∗))
Verdes-Montenegro et al. (2005) used N= 725 galaxies with known distance and magnitudes in the range 11-15 mag, once having excluded 9 galaxies with very high or low luminosity scattered in bins containing a low number of galaxies. We also computed the fit when galaxies withVr <1500 km s−1are excluded (N=666). The parameters of the Schechter fit are shown in Table2.2.
The CIG represents the largest and most complete foundation for studies of iso- lated galaxies and is likely as close as we can come to a field sample.
We also studied the completeness of the sample which is shown in§3.1.
Hα
Main paper:Verley et al.(2007a)
Hαis a good tracer of recent star formation in places where the extinction is not high.
Verley et al. (2007a) have studied the properties of Hα in the same subsample than the one considered in the CO part of the AMIGA project (containing 205 CIG spiral galaxies with velocities between 1500 and 5000 km s−1). A total of 96 % of the galaxies in the subsample have been observed at several 1-2 meter-class telescopes:
OSN (Observatorio de Sierra Nevada - IAA), CAHA (Calar Alto Hispano Alem´an - MPI,IAA) , EOCA (Estaci´on de Observaci´on de Calar Alto - OAN), JKT (Jakobus Kapteyn Telescope - ING) and SPM (San Pedro M´artir - UNAM). A total of 45 of the largest and less inclined galaxies were selected then to study their Hαmorphology in comparison with r-gunn filter images, by using a numerical program developed by Dr.
Figure 2.9: Optical luminosity function for CIG galaxies for which velocity informa- tion exists and with apparent magnitudes between 11 and 15 (n=725). The Schechter fit to this sample is plotted as a solid line. The dashed line corresponds to a fit to the same sample when galaxies with Vr ¡ 1500 km s−1are removed.
F. Combes, to study the potential, density and torques. The main result is the inference of an evolutive sequence, from galaxies in the first stage of the bar (presenting Hα emission all over the bar) to galaxies where the gas is gradually depopulated from the bar due to infall of material towards the center (thus possesing a strong central peak in the Hαemission). The latter is the most frequent phase in this subsample (N=45 galaxies). Numerical simulations trying to model the Hαdistribution suggest that the star formation law may differ from a simple Schmidt law.
Far infrared
Main paper:Lisenfeld et al.(2007)
The far-infrared emission (FIR) is mainly due to the emission produced by gas and dust grains warmed by ultraviolet radiation from newly formed massive stars (M >
8M). Most of the studies about FIR emission are skewed toward bright galaxies, which are usually much brighter than isolated ones.
Lisenfeld et al.(2007) reprocessed IRAS MIR/FIR survey data using the ADDSCAN/SCANPI utility for 1030 out of 1050 galaxies from the Catalogue of Isolated Galaxies. We fo-
cus on diagnostics (FIR luminosityLFIR, R=log(LFIR/LB), and IRAS colours) thought to be sensitive to effects of environment or interaction. The distribution of log(LFIR)
2.3. ISM MULTIWAVELENGTH STUDY 19
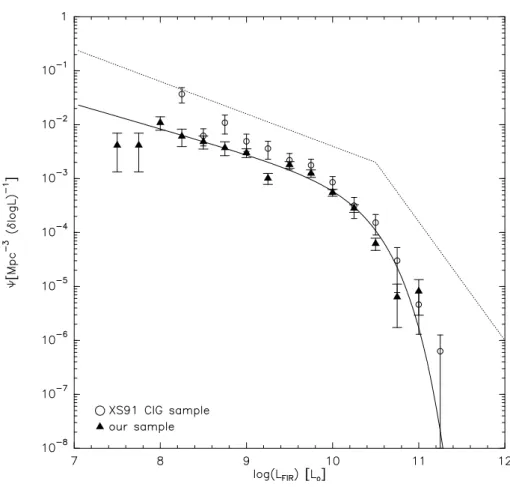
Figure 2.10: FIR Luminosity Function for the CIG galaxies (triangles) in comparison to that byXu & Sulentic(1991, circles and stars). The solid line is the Schechter fit to our data and the dotted line is the fit with a double power law derived inSanders et al.
(2003) for the “IRAS Revised Bright Galaxy Sample”.
sharply peaks from 9.0-10.5, with very few (<2%) galaxies above 10.5. Review of available optical images of the most FIR luminous galaxies found the majority likely to be interacting systems missed in our earlier morphological reevaluation. The op- tically normalised luminosity diagnostic R =log(LFIR/LB) shows a sharply peaked distribution between 0.0 and−1.0. These results were compared to the magnitude limited sample of the Center for Astrophysics that was selected without environmental discrimination. This modestly (e.g., compared to cluster, binary galaxy, and compact group samples) environmentally affected sample shows a significantly higher mean log(LFIR), and R, whereas the mean log(LB) is the same. Our sample shows a strong LFIR vs. LB correlation, with a slope steeper than one (LFIR ∝ L1.41B ). Interacting galaxies were found above this correlation, showing an enhancement inLFIR. With respect to the IRAS colours, we found higher F60/F100 values for ellipticals and late- type galaxies than for spirals, indicating a higher dust temperature. The mean value of F60/F100 was found to be lower than for interacting samples from the literature.
The results indicate that the FIR emission is a variable enhanced by interaction, and that our sample probably shows the lowest possible mean value. This attests to
the utility of our sample for defining a nurture-free zero point.
Atomic gas
Main papers:Espada(2009a);Espada et al.(2009);Espada(2009b)
The atomic gas is a fundamental ingredient of the ISM and is the most sensible tracer of interaction, due mainly to the fact that the extent of this component is usually much larger than any other component forming part of a galaxy. HI spectra have been obtained for the CIG galaxies from a compilation in the bibliography and from our observations at four radio-telescopes: Arecibo, GBT, Effelsberg and Nanc¸ay. In total 836 galaxies have HI data from the whole sample.
Currently we are preparing three papers about the atomic gas in the AMIGA sam- ple: a)HI content characterization. To obtain the reference of HI content normalcy from HI single-dish data for 836 AMIGA galaxies, as a function of optical proper- ties (luminosity, morphology, size). b)HI Lopsidedness Characterization. We use HI global velocity profiles with S/N ¿ 10 of a sample of isolated galaxies (N=318).
We restrict our study to N=182 galaxies with accurate measures of the HI shape properties. We obtain a visual classification and a quantification of the asymmetry using a flux ratio asymmetry parameter. c)Origin of asymmetries in HI disks: VLA observations. In order to study the origin of asymmetries in the atomic gas of well isolated spiral galaxies, we have made use of the large statistical HI study of isolated galaxies performed in former papers to select a well defined subsample with lopsided HI profiles and with a minimized probability of contamination by companions. We have observed a total of 12 isolated galaxies at the VLA in D-array configuration in order to discriminate whether the lopsidedness is in the HI density distribution, the velocity field or is due to confusion with a HI-rich companion.
Molecular gas
Main paper:Lisenfeld et al.(2009)
The J=1-0 rotational transition of the CO molecule traces the molecular gas com- ponent, which is the raw material for star formation.
The search for CO data has been focused on a subsample containing the 273 CIG galaxies with velocities between 1500 and 5000 km s−1. Data have been obtained from a compilation in the bibliography and from our observations with two single- dish radio-telescopes: FCRAO 14m (N=102 galaxies) and IRAM 30m (N=103) and Nobeyama 45m (N=7). In the main paper we present the data the CO content of these 273 isolated galaxies, mostly obtained from our own observation and also from the literature. The molecular gas content is compared to the blue and the FIR luminosity and the content in the HI.
Radio continuum
Main paper:Leon et al.(2008)
Radio-continuum emission is an useful tracer of current SFR and nuclear activity which is not affected by extinction. There exist a close correlation between radio- continuum and FIR luminosities, although the nature of these two emissions are very
2.3. ISM MULTIWAVELENGTH STUDY 21
Table 2.3: Compiled data for the different radio continuum surveys.
Survey Frequency Resol. 5-σ NCIG1 Ndet1 (MHz) (arcmin) (mJy)
WENSS 325 & 352 ∼1 ∼18 405/278 49/37
NVSS 1420 ∼0.8 ∼2 1050/719 374/311
FIRST 1420 ∼0.08 ∼1 560/360 81/58
GB6 4850 ∼3.5 ∼18 1017/691 32/12
1 Total number of galaxies with radio data (NCIG) and with radio detection (Ndet), followed by the number of galaxies belonging to the complete subsample of N=719 galaxies (explained in3.1).
different. Radio-continuum emission is produced by thermal radiation (mainly due to supernovae) and synchrotron radiation (non-thermal, due to relativistic electrons accelerated by magnetic fields) whose contribution is important if the galaxies pos- sess nuclear activity. Candidates to host Active Galactic Nuclei can then be identified by looking for example to the outliers of such correlation as we will explain in the following chapters.
Leon et al.(2008) compiled radiocontinuum information for the CIG sample from four different sources:
WENSS: Westerbork Northern Sky Survey at 325 and 352 MHz (∼90 cm).
NVSS: NRAO VLA Sky Survey at 1.4 GHz (20cm)
FIRST: Faint Images of the Radio Sky at Twenty-centimeters at 1.4 GHz (20cm) GB6: Green Bank at 4.85 GHz (6cm).
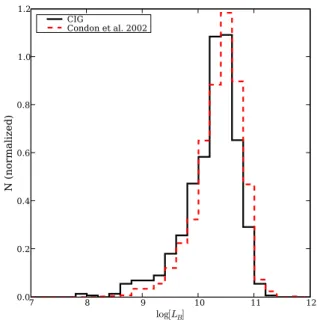
These data have been reprocessed using SExtractor, obtaining in this way a higher detection rate. Comparison between the NVSS and FIRST detections indicates that the radio continuum is coming from disk-dominated emission in spiral galaxies, in contrast to the results found in high-density environments where nuclear activity is more frequent. The comparison of the radio continuum power with a comparable sample, which is however not selected with respect to its environment, theCondon et al.(2002) UGC-SF sample of starforming field galaxies, shows a lower mean value for the AMIGA sample. We have obtained radio-to-optical flux ratios (R) using the NVSS radio continuum flux. The distribution of R for the AMIGA galaxies is con- sistent with a sample dominated by radio emission from star formation and a small number of active galactic nuclei (AGN), with less than 3% of the sample with R ¿ 100. We derived the radio luminosity function (RLF) and total power density of the radio continuum emission for the AMIGA sample at 1.4 GHz, and compared them with results from other low-redshift studies. The Schechter fit of the RLF indicates a major weight of the low-luminosity galaxies.
The results indicate the very low level of radio continuum emission in our sample of isolated galaxies, which is dominated by mild disk SF. It confirms thus the AMIGA sample as a suitable template to effectively quantify the role of interactions in samples extracted from denser environments
2.4. Extension to submillimeter
The AMIGA project performed a scientific and technological extension to the mil- limeter and submillimeter range, with a special emphasis on submillimeter interfer- ometry, expecting to contribute to an optimum “return” of the Spanish contribution to the Atacama Large Millimeter Array (ALMA). Our activity concentrate into three different topic:
Scientific: to get insight into the star formation process by means of observa- tions with the Plateau de Bure Interferometer and with the Submillimeter Array (SMA, the first interferometer in the world working at submm wavelengths), selecting the best objects to be studied with ALMA when it will become oper- ative.
Scientific - technical: The AMIGA project participate in calibration tasks for SMA, relevant for the development and comissioning of ALMA.
Technical: AMIGA participate in the development of systems allowing the ac- cess and display of large radioastronomical databases. These systems follow standards allowing their integration into the Virtual Observatory.
Submm calibration techniques: Our group have performed phase transfer and fast switching tests in collaboration with SMA/ASIAA. Fast switching testing data agree well with simulations. Preliminar results using our phase transfer data have allowed us to identify a set of engineering variables that may be involved in the phase drifts/jumps that are usually observed.
2.5. Virtual Observatory
The great diversity of the current astrophysical instrumentation allows us to obtain information of the Universe in almost the whole electromagnetic range. This is stored in astronomical archives, but the nature and access methods to them is very heteroge- neous. It is for the millimetric and submillimetric astronomy where the astronomical archives are less available, which adds difficulty for those non-radioastronomers when reducing and interpreting the data. Within the last three years the concept of Virtual Observatory (VO) has been created, aiming to solve the mentioned hetereogenity.
The VO aims to offer an integrated system to access a number of archives which are very different among them, as well as a set of services that can interact both direct or remotely over them at different levels. In the frame of VO there is a considerable experience in optical, infrared and ultraviolet archives (e.g. MASTKamp et al. 2004).
There exist a great interest to extend this experience to the radioastronomy range and to build data archives integrated in VO both coming from single dish or synthesis radiotelescopes.
The International Virtual Observatory Alliance (http://www.ivoa.net) is world- level confederation and the reference for all the work done in VO (development of standards, workgroups coordination, etc. ). Its analogue at a national level is the Spanish Virtual Observatory (SVO,http://svo.laeff.esa.es)
The AMIGA project has developed a VO compliant interface (conesearch service and unfolding of VOtables) for the access to the data that are periodically made public.
Our group also developed for the VO:
2.5. VIRTUAL OBSERVATORY 23 RADAMS: Development of RAdio DAta Model for Single-dish telescopes, only existing data model for radio archives based upon existing IVOA data models, now implemented by our group to the DSS-63 and IRAM-30m an- tennas archives. It has been presented to the IVOA within the Current Data Modelling Efforts.
MOVOIR (MOdular Virtual Observatory Interface for Radio-astronomy) devel- oped by J. Santander. It aims to combine existing VO open source packages in order to produce an easily embeddable modular interface for radio astronomy tools.
SMA/CASA Converter: A Python based tool that allows exporting SMA inter- ferometric data to FITS formatted data in order to be treated by the ALMA soft- ware reduction package CASA. CASA stands for Common Astronomy Soft- ware Applications and is a suite of applications developed by ALMA and in- tended to be the principal reduction package for ALMA data.
Part II
Radio continuum and far infrared emission
25
Chapter 3
Sample and data used for this study
3.1. Definition of the sample
The starting sample for the AMIGA project is based on the Catalogue of Isolated Galaxies (CIG; Karachentseva 1973) which is composed of 1050 galaxies. As ex- plained in the previous chapter, in previous works we have: 1) revised all of the CIG positions (Leon & Verdes-Montenegro 2003); 2) optically characterised the sample (Verdes-Montenegro et al. 2005); 3) performed a revision of the morphologies (Su- lentic et al. 2006); 4) derived mid-infrared (MIR) and FIR basic properties (Lisenfeld et al. 2007); 5) performed a careful reevaluation of the degree of isolation of the CIG (Verley et al. 2007c,b); and 6) derived the radio continuum properties (Leon et al.
2008).
Completeness of the sample
In order to reduce biases in our statistical study we have used the completeness test<V/Vm>(Schmidt 1968), as explained inVerdes-Montenegro et al.(2005) and Lisenfeld et al.(2007). We adopted mB=15.0 as the cutoffmagnitude necessary to have a reasonably complete sample (see Figure7.4in Chapter7).
We focus our statistical analysis on the complete AMIGA subsample described in (Verdes-Montenegro et al. 2005). We use in the present work the same selection as described in Sect. 4.1 of (Lisenfeld et al. 2007):
The subsample contains galaxies with corrected Zwicky magnitudes in the range 11.0–15.0 for which we found<V/Vm>=0.43, indicating 80–90% complete- ness.
Morphological revision of the sample, described in (Sulentic et al. 2006), iden- tified 32 galaxies that are probably not isolated in the sense that they might involve isolated interacting pairs and/or multiplets. These galaxies are excluded from the most isolated sample studied further here.
We excluded two nearby dwarf ellipticals (CIG 663≡Ursa Minor and CIG 802
≡Draco) for which we only have upper limits for the radio and FIR fluxes, and the inferred luminosities are very low.
This subsample contains 719 galaxies and in this study we will refer to it as the ”com- plete subsample”, while the 1050 galaxies will be referred to as the ”total sample”.
27
For studies that use IRAS satellite data, the total sample is reduced to 1030 galaxies while the complete subsample contains only 710 galaxies due to a number of galaxies falling in the region uncovered by IRAS known as the ”IRAS gap” (seeLisenfeld et al.
2007). This difference in the number of galaxies does not affect the completeness of the subsample.
3.2. Presentation of the data
We performed our study using archive data that we reprocessed as well as data found in the literature.
Observed and reprocessed data
We obtained the FIR data for 1030 galaxies of the total sample by reprocessing the data of the IRAS satellite with the SCANPI tool (Lisenfeld et al. 2007). We obtained a better detection rate and an improved signal-to-noise level than in previous IRAS catalogues.
The radio continuum data have been obtained from two different sources: a) NRAO VLA Sky Survey (NVSS, 1.4 GHz; spatial resolution 4500) and b) Faint Images of the Radio Sky at Twenty-cm (FIRST, 1.4 GHz; spatial resolution 500) as explained in detail inLeon et al.(2008). The radio continuum fluxes used in this paper were either taken from the NVSS survey catalogue or derived using the original survey data and extracting the flux with SExtractor (Bertin & Arnouts 1996) within a radius of 3500, obtaining in the latter case a higher detection rate. We use NVSS fluxes because of the high detection rate and sensitivity of this survey, which contains all galaxies be- longing to our sample (n=1050). In those cases where we found a radio enhancement (see Sect. 5.4), we complemented the NVSS data with the higher resolution images provided by FIRST when available. In this way, we improved the spatial location of the radio continuum emission to check whether this emission is due to a nuclear source or to a projected, unrelated source.
We used the distances given inVerdes-Montenegro et al.(2005) calculated with the Hubble constantHo =75 km s−1Mpc−1.
We have computed the radio continuum and FIR luminosities with the following relations:
logL1.4GHz(W Hz−1)=20.08+2 logD+logS1.4GHz
logL60µm(L)=6.014+2 logD+logS60µm
where D is the distance of the galaxy in Mpc and S1.4GHz and S60µm are the flux densities in Jy (1 Jy = 10−26W m−2Hz−1). The FIR luminosity (LFIR; Helou et al.
1988) is related toL60µmby this formula:
LFIR(L)= 1+ S100µm
2.58S60µm
! L60µm
The distribution of the FIR luminosities for our sample peaks in log(LFIR/L)=9.5–
9.75 (see Lisenfeld et al. 2007) and practically all galaxies have FIR luminosities between log(LFIR/L) =7.5 and log(LFIR/L) =11.25. The bulk of the FIR lumi- nosities (98%) lies below log(LFIR/L)=10.5.
3.2. PRESENTATION OF THE DATA 29 Data from the literature
We cross-correlated our sample with existing databases of active galaxies, in par- ticular, the NASA Extragalactic Database (NED)1and the V´eron-Cetty Catalogue of Quasars and Active Nuclei (V´eron-Cetty & V´eron 2006, 12th Edition).
The NED contains information on the type of nuclear activity forn=77 galaxies of our sample. The different classifications found in the sample are: LINER, HII, Starburst, DANS (dwarf amorphous nuclear starburst), SBNG (small, bright nucleus galaxy), NLAGN (narrow line AGN) and Seyfert. In some cases, the information on the Seyfert type is also given. The NLAGN are a mixture of Seyfert 2’s, LINERs, and starburst/AGN composites. HII and starburst are not taken into account in our analysis since they are not considered as AGN, but we list them in Table3.1. A total ofn=16 galaxies from the AMIGA sample are classified as Seyferts, 1 as AGN and 5 as NLAGN in their catalogue.
The V´eron-Cetty Catalogue of Quasars and Active Nuclei is a very complete com- pilation of active galaxies and quasars. It includes position and redshift as well as optical photometry (U, B, V bands) and 6 and 21 cm flux densities when available.
We have foundn =25 of our galaxies in this catalogue. A total ofn =18 are clas- sified as Seyfert galaxies, 3 as HII, 3 as LINER and one has no assigned class. The 3 HII galaxies are included in this catalogue because in a previous version they were classified as Seyfert galaxies.
The LINERs are also known as Sy3 (Seyfert 3) in these catalogues. Although re- cent studies suggest that some LINERs are low-luminosity AGN (Ho 1999;Gonz´alez- Mart´ın et al. 2006) this topic is not clear yet. In our study we consider LINERs sepa- rately from other kinds of active galaxies.
In Table3.1we list those galaxies found in the literature to show nuclear emis- sions. The first column is the CIG number, the second column is the type of emission found in NED, and the third column the one in the V´eron-Cetty catalogue. In the fourth column, we indicate the classification taken for our study. It is obtained dis- carding those cases where a disagreement is found between the NED and V´eron-Cetty (V-C) classification.
Table 3.1: Galaxies from AMIGA sample listed as active in the literature.1 CIG NED V-C2 Classification choosed3
6 HII HII
33 Sy? LINER Sy?
45 HII HII
55 LINER HII
56 Sbrst Sbrst
57 Sy2 Sy2 Sy
72 Sy1.9 Sy1.9 Sy
103 ?
105 HII HII
116 HII Sy2
138 Sy2 Sy
143 HII HII
197 HII HII
1http://nedwww.ipac.caltech.edu/
CIG NED V-C Classification choosed
214 Sy1 Sbrst Sy1.0 Sy
231 NLAGN NLAGN
250 HII HII
302 HII HII
324 Sy1 LINER Sy3
339 Sbrst Sbrst
347 HII HII
349 Sy1.5 LINER Sy1 Sy
356 DANS DANS
359 Sy3 Sy3 LINER
383 HII Sbrst
393 HII HII HII
401 NLAGN NLAGN
428 HII HII
435 HII HII
438 HII HII
442 HII HII
444 HII HII
447 LINER HII
461 LINER LINER
463 HII HII
478 Sy2 Sy
495 Sy2 Sy
499 NLAGN NLAGN
503 HII HII
508 Sbrst Sy1
518 HII HII
534 HII HII
538 HII HII
543 HII HII
549 LINER LINER
553 Sbrst Sbrst
559 Sy2 Sy Sy
575 SBNG SBNG
592 NLAGN NLAGN
604 AGN AGN
619 Sbrst Sbrst
624 HII HII
627 HII HII
634 LINER LINER
671 Sy1 Sy1.5 Sy
692 Sy2 Sy2 Sy
710 HII HII
712 LINER LINER
719 Sy1 Sy1n Sy
733 HII HII
745 Sy1.5 Sy1.0 Sy
748 Sbrst Sbrst
3.2. PRESENTATION OF THE DATA 31 CIG NED V-C2 Classification choosed3
766 HII HII
795 NLAGN NLAGN
837 LINER HII 866 LINER HII
877 Sy2 Sy
936 HII HII
940 Sy1.9 Sy
943 HII HII
947 Sy LINER Sy3
974 Sbrst Sbrst
976 HII HII
985 HII HII
993 Sy2 Sbrst HII
1004 Sy2 LINER Sy1.9 Sy
1006 HII HII
1008 Sy1.2 Sy1.2 Sy
1019 Sbrst Sbrst
1023 Sy2 Sy2 Sy
1038 LINER LINER
1039 HII HII
1 Columns: 1) CIG number; 2) NED classification; 3) V´eron-Cetty Catalogue classification; 4) Classification adopted for our study.
2 Sy=Seyfert; HII=nuclear HII region; Sbrst=Starburst; SBNG=small, bright nucleus galaxy; NLAGN=narrow line active galaxies (a mixture of Seyfert 2’s, LINERs, and starburst/AGN composites); DANS = dwarf amorphous nuclei starburst galaxies
3 Classification obtained discarding those cases where a disagreement was found between the NED and V´eron-Cetty classification.
Chapter 4
Properties of the radio continuum emission
This chapter present part of the work developed by J. Sabater for the study of the properties of the radio emission of the AMIGA galaxies that was presented inLeon et al.(2008).
4.1. NVSS and FIRST data
We found 359 CIG sources in the NVSS catalog. Source extraction using SEx- tractor with a 5-σ threshold yielded 368 detections, where 9 are not in the NVSS catalog or were recalibrated in cases of extended or weak sources (CIG 324, 436, 442, 543, 559, 837, 869, 950, 988). CIG 199 was excluded from the catalog because of corrupted data.
We cross-correlated the FIRST catalog with our revised optical positions, yielding 81 source detections. The number of detections was low and the data could not be used for statistical purposes. They were however very useful for a comparison with NVSS data which allowed us to infer the relative strengths of disk vs. nuclear emis- sion in many galaxies. Mean positional differences are small (−0.0022,−0.0007) with a dispersion of 1.006 and 2.000, respectively. We found 8 galaxies that were detected in FIRST but not in the NVSS (CIG 236, 238, 258, 364, 544, 618, 678 and 749). Nor- mally we expect the NVSS flux to be stronger than the FIRST values because FIRST is only sensitive to compact (high spatial frequency) radio emission. These sources showed fluxes near the NVSS/FIRST detection limits and were not further considered in our analysis.
4.2. Detection rate
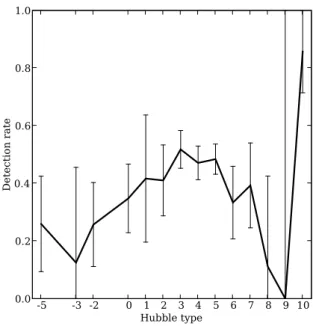
Figure4.1shows the NVSS radio detection fraction as a function of morphological type (seeSulentic et al. 2006) for a description of the morphological types). It peaks in the Sb–Sc range (typeT =3–5) which is the core of the AMIGA sample, comprising fully two thirds of our sample (Verdes-Montenegro et al. 2005, see). Assuming that the radio continuum emission is driven by star formation this is not surprising because these galaxies show the highest average star formation rates (Kennicutt et al. 1987).
This is partially offset by the higher molecular/neutral gas fraction found in earlier types (Young & Knezek 1989) which may explain why the detection fraction drops so
33
-5 -3 -2 0 1 2 3 4 5 6 7 8 9 10 Hubble type
0.0 0.2 0.4 0.6 0.8 1.0
Detection rate
Figure 4.1: Detection rate at 1.4 GHz with NVSS as a function of Hubble type.
slowly towards types earlier thanT =3 (Sb). This can be contrasted to the much more rapid drop in the FIR detection fraction found inLisenfeld et al.(2007). Alternative explanations for the relatively high detection fraction of earlier types include: 1) Sb–
c spirals misclassied as Sa-ab (T = 1–2) due to low resolution imagery; 2) spirals misclassified as E/S0 (T =−5 to−2); and 3) the growing influence of radio emission unrelated to star formation inbona fideearly types. The large fluctuation among the very late types likely involves small sample statistics.
4.3. Luminosities
Fig.4.2shows the distribution of radio luminosities as a function of type for all detections. In addition, we plot mean values including upper limits which were de- rived using the Kaplan-Meier survival analysis and calculated with our own software (see AppendixA) derived from the ASURV package (Lavalley et al. 1992). Since the radio detection fraction is less than 50% for all types the mean values lie quite low relative to the detections. Note that the mean of log(L) can be lower than the me- dian of log(L). The weakest known classical radio loud quasars (FRIIs:Sulentic et al.
2003) show radio luminosities near logL1.4GHz = 23.5 and the strongest sources in this sample are 0.5 dex below, with the majority of detected sources 1.5–2 dex below.
With the exception of a few of the strongest sources all luminosities are consistent with nonthermal emission related to star formation. Figure4.2can be compared with the equivalent for FIR emission (Figure 5 inLisenfeld et al. 2007).
The radio