Thanks to Carolina Serpell, Research Assistant in the Department of Economic Development at ECLAC for contributing to the editing of this paper. This publication contains a comparative analysis of the seven case studies, together with recommendations based on the findings.
Introduction
The idea of equality based on equality of opportunity and ability is simply the result of a lack of formal equality – a situation in which the state must try to promote equality. Similarly, the overall results of state action – particularly in terms of different types of income and expenditure, levels of inequality resulting from concentration i.
Equity and tax policy
According to this principle, the tax system must be fair in the distribution of the tax burden among the members of a society, adapted to the different circumstances of the individual. The problem that always arises in this context is the relative nature of the concept of 'adequate income'.
Some structural features of equity in Latin America
High distribution inequality is one of the distinguishing features of the social environment of Latin America. The size of the shadow economy is undoubtedly a significant issue when analyzing tax evasion in the region and its possible solutions, as will be discussed below.

Taxation as a distribution policy instrument
Level of revenue
Several studies have shown that the region's potential tax burden is significantly higher than its effective burden16. The tax burden of the other thirteen countries is clearly lower than it should be according to their level of development. This simple exercise shows that most of the countries studied could increase their tax burden.
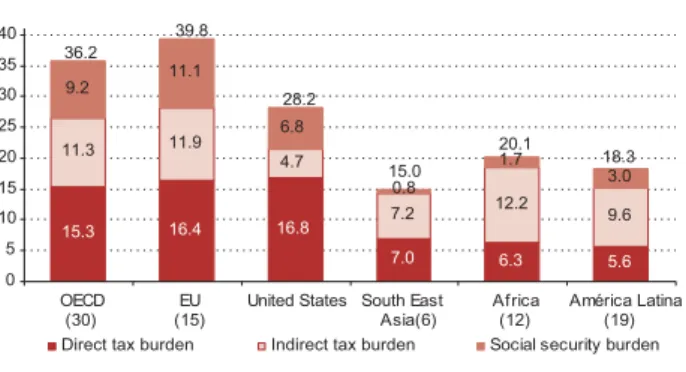
In aggregate terms, depending on the level of economic development of the region, the tax burden could be increased by an average of three points of GDP. The average gap between the potential and actual tax burden hides considerable differences between countries. Another easy way to show the low tax burden in Latin America is to compare it with the tax burden in other regions of the world.
The direct tax burden in developed countries is on average ten points of GDP higher than in Latin America. However, the tax burden is not the only factor affecting the distribution of income in a country.
Tax structure
The major role that income tax plays in their revenue scheme is attributable to corporate income tax paid by companies engaged in such activities. As previously mentioned, these countries are among the poorest in the region – a factor that clearly limits their direct tax base. The low relative importance of income taxes is evident in almost every country in the region.
Income tax revenues in Argentina, Colombia, Mexico and Nicaragua are also above the regional average, at around 5% of GDP. Corporate income tax has also shown greater growth in recent years, mainly due to a significant increase in income from mining and oil companies (see figure 12). As shown in the table below, the region is close to the average for developed countries in terms of corporate income tax (3.4 and 3.9 points of GDP, respectively).
In short, the structure of the region's tax systems is a contributing factor to the region's persistent problems i. 19 According to Cetrángolo and Gómez Sabaini (2007), two factors explain why families or natural persons account for a larger share of income tax revenues in developed countries than companies.
Degree of compliance
As discussed below, reforms in this area must focus on increasing the impact of tax policy on income distribution, increasing the tax burden on wealthier sectors of society.
Characteristic features of the tax situation in seven Latin American countries
Studies show that income tax was the fastest growing form of revenue in the region between 2001 and 2007, although growth rates vary from country to country. Value-added tax—the dominant tax player in Latin America in the 1990s—seems to have peaked as a source of revenue (with the exception of Mexico). Note: Scope is country, except El Salvador (central state) and Ecuador (non-financial public sector).
However, one particularity of Argentina's tax system should be noted: the country's export duties may absorb a significant portion of the resources that would otherwise increase income tax revenues, as is the case in countries that apply an income tax to copper, gas, oil or other goods. As is well known, the destination principle, followed by all countries in the region, requires them not only to grant exemptions to exporters, but also to refund the payment of VAT collected at previous stages, including that paid on importation. Another development common to all seven countries is the declining role of foreign trade taxes as a source of revenue, along with the steady increase in the importance of income taxes.
However, it should be noted that foreign trade taxes began to decline in the 1980s, while income taxes only began to gain momentum in the 1990s. In most of the countries studied, their rise began in earnest at the beginning of this century.

Direct taxation in selected countries
- Composition of taxes on income
- Some characteristics of income taxes
- Level and composition of property taxes
- Some considerations regarding taxes that replace or supplement direct
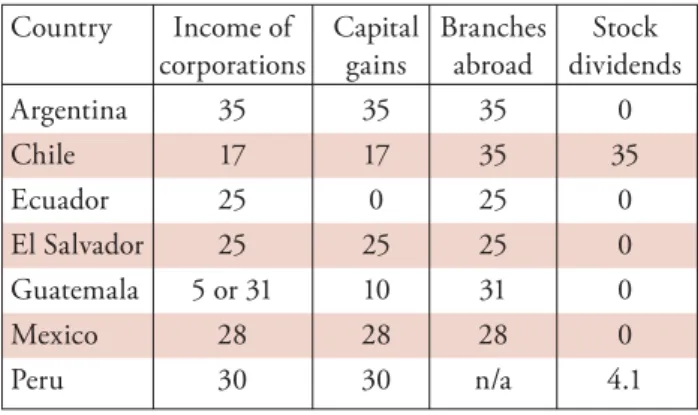
At one end of the broad spectrum of income tax policies one finds Chile, where “three basic principles. The corporate income tax rate in five of the seven countries studied varies between a minimum of 25% (Ecuador and El Salvador) and a maximum of 35% (Argentina). A comparison of the maximum and minimum income tax rates for individuals in each country between 1992 and 2007 shows that the gap between rates has narrowed (or at least remained steady) in most cases.
The maximum personal income tax rates in the countries studied are virtually identical to the rates applied to corporations – between 25% and 35%. Second, they represent a complete acceptance of the idea that corporate income taxes are non-delegable. This has an undeniable impact on distributive equity, as well as on personal income tax revenue.
As a result, personal income tax has been almost exclusively limited to income from work. Taxpayers are obliged to pay the difference between the IETU and the income tax.
Results of distributive impact studies
It is an approach that could be described as "unorthodox", as most countries that require minimum payments of this nature base them on the value of assets or, more recently, gross sales or gross income. This tax has changed over time and is based on the value of assets. The current version of this tax is known as the Temporary Net Wealth Tax (Impuesto Temporal a los Activos Netos, or ITAN).
It is applied to values of more than one million new soles in net assets. In addition to confirming that the tax system is regressive, with the Gini coefficient rising from 0.522 to 0.530 after taxation, Cantallopts et al. 2007) concludes that certain reforms aimed at reversing the revenue relationship between direct and indirect taxes can have a significant impact on the redistribution of income42. Indeed, after simulating an expansion of the taxable base of the progressive income tax and a reduction in the share of VAT, to keep income constant, income distribution improved, with the Gini index falling from 0.530 to 0.48843 has.
Estimating the income tax gap
Importance of income tax gap estimates
Methodological differences seem to be more important in estimating the income tax gap than their corporate counterpart44. Insufficient statistics, combined with complex tax bases, are the biggest challenge for developing estimates of the region's income tax gap. Cabrera (2009) notes that the methodology for tax years after 2005 produces corporate tax gap estimates that are highly sensitive to the share of taxpayers participating in the 5% regime.
First, most studies use the tax gap methodology between actual income and theoretical income. This is the case in Argentina and Chile, where the elimination of the income tax gap would increase the tax burden by 20% (table 8, column 6). Note: The actual income tax data used to calculate the tax gap may not coincide with the revenue statistics published by tax administrations due to country-specific methodological issues.
The data analyzed shows that the personal income tax gap (PIT) is much smaller than that for corporate income tax: 0.5% to 1.5% in GDP terms and 3% to 14% of the total tax burden. The author of the study concludes that this increase would explain the decline in corporate tax revenues over that period. The study finds that of the 1.1% of GDP that represents the individual income tax gap, 1% of GDP exists.
It should also be noted the differences observed between the corporate tax and the income tax gap.

Estimation diffi culties
Results
- Conclusions and fi nal results
Note: as in the studies, the tax gap estimates are split between corporations and individuals – except for Argentina. In other words, how much would the tax burden increase if the tax gap were reduced to zero. It should be noted that, since corporate income tax (CIT) accounts for 73.3% of income tax revenues in Latin America (see figure 16), the VAT gap should not differ significantly from the tax gap in both categories together.
The fact that the average tax gap rate for both corporations and individuals approaches 50% means that effective income is about 50% of potential. Note should be taken of the case of Guatemala and Ecuador; because of their high tax gap rates, effective income in those countries is significantly lower than the income gap. Note: Effective income data used to calculate the tax gap may not coincide with the income statistics published by the tax administrations due to methodological issues specific to each country.
The only other study that can be used as a reference calculated a tax gap rate of 79%. Second, given the lack of data with which to adjust non-labor income reported in household surveys for underreporting, individual income tax gap may be somewhat underestimated. The data shows that corporate income tax accounts for 70% of effective revenue; consequently, results for both taxes combined are heavily weighted towards those obtained for corporate tax gap.
As for individuals, both the level of the income gap and the estimated tax gap rates are lower than for corporations.