They find that the terms of trade shocks in Latin America in the 2000s were of similar magnitude to those in the 1970s. In Chapter 10, Alexander Klemm, Andre Meier, and Sebastián Sosa discuss possible spillovers to Latin America in the normalization process of the US economy.
PART I
The region's weight in global economic output rose from about 6 percent in the 1990s to 8 percent in 2012. Externally, the favorable tailwinds that drove growth recently are turning into headwinds.
EXCEPTIONAL GAINS
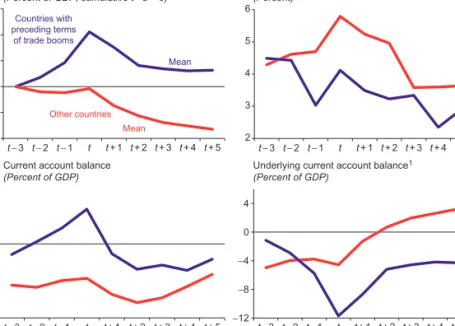
Coupled with the much greater role of flexible exchange rates acting as shock absorbers, this build-up of external buffers resulted in a marked reduction in the region's vulnerability to negative external shocks. Indeed, growth over the past decade has been much stronger among South American net commodity exporters than in the rest of Latin America (Mexico and Central America) (Figure 1.5).

DARKER CLOUDS ON THE HORIZON
The most critical task is to create conditions for sustainable and steady growth in the medium term. Some of the major countries in the region have resisted the general trend towards stability-oriented macroeconomic policies and are now facing increasingly pressing challenges.

CONCLUSIONS
To examine the sustainability of the recent growth momentum, possible constraints on factor accumulation for the region's growth performance are examined. Indeed, after declining in most of the region in previous decades, TFP has mostly turned to positive growth in the past decade.

WHAT FACTORS EXPLAIN THE RECENT STRONG GROWTH PERFORMANCE?
Overall, growth in the LAC region remains below that of Asia, where most of the growth gap can be explained by differences in TFP performance. Labor participation has declined in the Caribbean since 2003 despite an increase in the proportion of the working-age population.

IS THE STRONG PERFORMANCE OBSERVED DURING 2003–12 SUSTAINABLE?
16 In fact, the contributions to output growth from both changes in the working-age population and the labor force participation rate declined significantly over 2003-12 compared to the 1990s. The baseline projections also involve a slowdown in TFP growth for most countries (down to the 2000–12 average growth rates), consistent with the normalization in the business cycles.18.

CONCLUSION
ADDITIONAL FIGURES AND TABLES
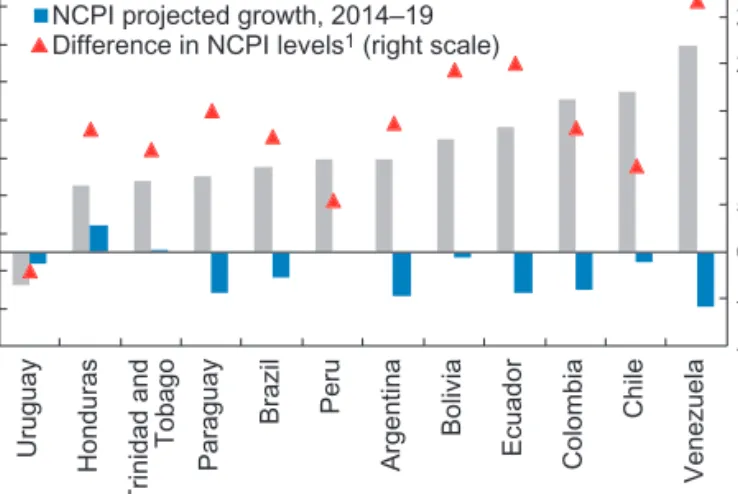
For most countries in the region, there is a prospect of a sharp fall in the growth rates of their country-specific commodity price index. The chapter then examines whether it is the lower growth in commodity prices or their still high levels that will have the greatest impact on output growth in the region in the coming years.

CHARACTERIZING THE COMMODITY BOOM AND ITS AFTERMATH IN LATIN AMERICA
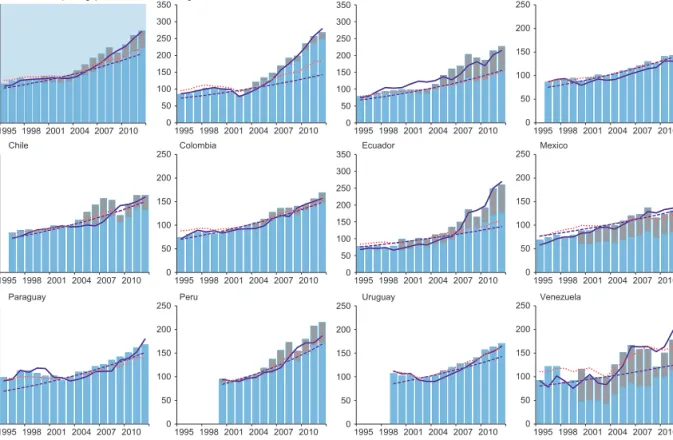
11 There are two variations of the NCPI used in the chapter, based on different specifications for the weights in equation (3.2). The weights for the adjusted NCPI series used in the scatterplots in Figure 3.8 are given by .
GROWTH IN LATIN AMERICA AND THE CARIBBEAN AFTER THE COMMODITY BOOM
DATA SOURCES
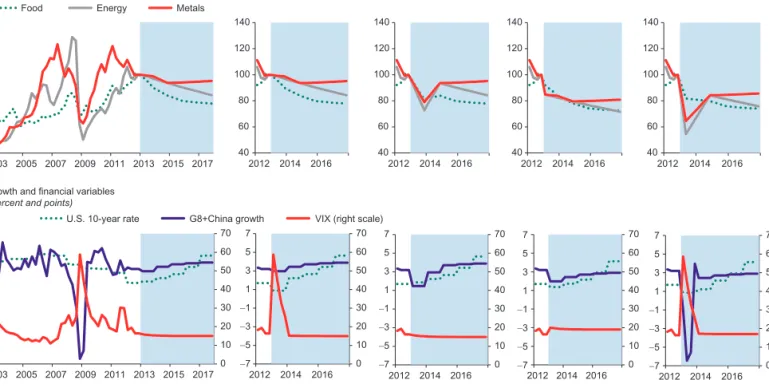
Note: The net commodity price indices for 2014-19 (shaded area) are constructed from commodity futures prices prevailing at the end of February 2014. Dehn, J., 2000, "The Effects on Growth of Commodity Price Uncertainty and Shocks," Policy Research Working Paper 2455.

PART II
This chapter sheds light on these issues by (1) documenting long-term trends (four decades) and cross-country differences in the degree of commodity dependence; (2) examining the behavior of various commodity prices and, in particular, their sensitivity to global economic conditions; and (3) drawing lessons from the history of episodes of sharp declines in terms of trade. The chapter pays particular attention to the role of macroeconomic policies and fundamentals in shaping the economic impact of negative terms of trade shocks.
A HISTORICAL PERSPECTIVE ON COMMODITY PRICES
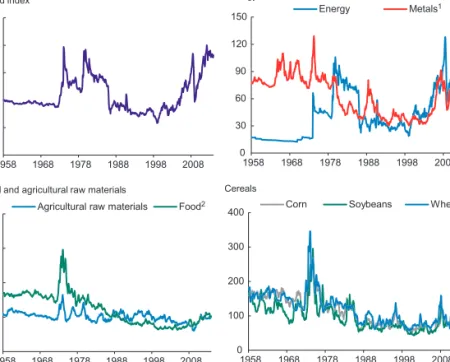
In the past decade, the first principal component accounted for almost 85 percent of the variance in commodity prices, and prices of all categories were positively correlated with this common underlying force. This largely reflects the growing importance of China in global commodity demand.4 In contrast, in the 1970s and 1980s, the first principal component accounted for about 65 percent of the variance of commodity prices, and since it was positively in correlation with metal and food prices, the correlation with energy prices has been negative.
COMMODITY DEPENDENCE AND CONCENTRATION
However, diversification has declined significantly in Venezuela, where commodity exports have risen from 75 percent of total exports in 1980 to about 90 percent in 2010. Again, Latin America's trends stand in stark contrast to those in emerging Asia, where commodity exports fell from about 60 percent of total exports in the 1970s to less than 20 percent in 2010.11.

ECONOMIC PERFORMANCE IN THE FACE OF TERMS-OF-TRADE BUSTS
COMMODITY DEPENDENCE AND CONCENTRATION
The analysis shows that the recent terms of trade shock in Latin America has not been greater than the one in the 1970s. These findings challenge the growing perception that the macroeconomic response to the terms of trade boom was different this time around.

THE TERMS-OF-TRADE WINDFALL IN HISTORICAL PERSPECTIVE
Note: The cumulative percentage change in terms of trade (of goods and services) from the beginning to the peak of each identified episode (meeting the criteria of at least 15 percent cumulative growth and 3 percent average growth). The CPI avoids the impact of high global inflation (seen in the 1970s and 1980s) as a terms of trade shock.

SAVING PATTERNS DURING BOOMS
This highlights the magnitude of the terms of trade windfall that Latin America has experienced in the past decade, which has not only been much larger than its own previous windfalls, but also larger than in most other regions. The proportion of countries that benefited from the terms of trade boom has also been much higher in Latin America than in other regions.
AVERAGE VERSUS MARGINAL RATES
Average savings and investment rates provide an indication of the macroeconomic response to the terms of trade shock. MENA oil-exporting countries appear to have saved a much larger share of the windfall than Latin America, with a median marginal saving of around 80 percent.

COMMON EXTERNAL FACTORS AND SAVING PATTERNS
Overall, these results suggest that Latin America tends to save less of the income windfall under terms of trade, even after controlling for key characteristics and external factors that normally drive savings decisions. This chapter presented a metric that quantifies the (exogenous component of) the income shock arising from the terms of trade boom and a metric for the associated savings.

A DECADE OF FALLING PUBLIC AND EXTERNAL DEBT, 2003–12
The rest of the Latin American countries (Argentina, Bolivia, Ecuador and Venezuela) also experienced a notable drop in debt during this period (about 45 percentage points of GDP on average), although it started with a lot. Note: The diagram provides a simplified illustration of the integrated framework for the sustainability of public debt and external debt.

GLOBAL SCENARIOS
- Temporary Financial Shock
- Temporary Real Shock
- A Protracted Global Slowdown
- A Tail Event
These include (1) the elasticity of production of non-goods tax revenue; (2) the policy of real public spending; and (3) the extent of reserve accumulation.29 Table 6.2 details these key assumptions for each of the four alternative scenarios. In this case, real expenditure growth behaves as in the baseline projection, regardless of the scenario under consideration.
LATIN AMERICA’S AGGREGATE RESULTS
Noncommodity (real scale) Real interest rate (real scale) Real GDP growth (real scale) Real exchange rate (real scale) Other (real scale) Commodity income (real scale) Public debt. By 2017, public debt will reach 47 percent of GDP (52 percent) in the case of a neutral (countercyclical) policy response under scenario 1, and 42 percent of GDP (45 percent) in the case of a neutral one.

COUNTRY-SPECIFIC RESULTS
FACTORS DRIVING PUBLIC AND EXTERNAL DEBT DYNAMICS BY
The intent of fiscal policy, based on then-available forecasts of the output gap, may differ from the actual impact of fiscal policy. Given the extensive evidence that fiscal policy affects economic growth and the output gap, we ensure that the estimate of equation (7.1) reflects the endogeneity of the output gap or growth rate.
DATA
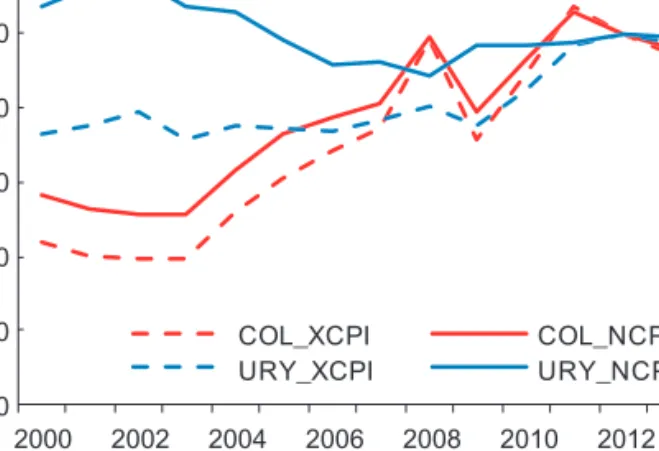
In the case of country-specific regressions, we use instrumental variable regressions, either with the lagged output gap or the export-weighted growth rate of trading partners and the US. This index allows us to take into account that the commodity export and import basket can change significantly over a long period, while ensuring that changes in the price index reflect changes in commodity prices and not endogenous changes in export volumes and imports in response to price fluctuations.
FINDINGS
In the first of these instrumental-variable regressions, the lagged output gap is used as an instrument. In these regressions, the output gap and the commodity price index were interacted with the time indicator.
THE QUALITY OF FISCAL POLICY
Egert, Balazs, 2012, "Response of fiscal policy to the cycle in the OECD: Pro- or counter-cyclical?" CESifo Working Paper No Talvi, Ernesto and Carlos Végh, 2005, "Tax Base Variability and Procyclical Fiscal Policy in Developing Countries," Journal of Development Economics.
PART III
This chapter examines the impact of global financial shocks on the domestic production of EMEs, focusing on the role that financial integration and macroeconomic fundamentals play in mitigating or amplifying such an effect. However, unlike these studies, this study pays special attention to the role of financial integration and its evolution over time in determining the vulnerability of EMEs to exogenous global financial shocks.
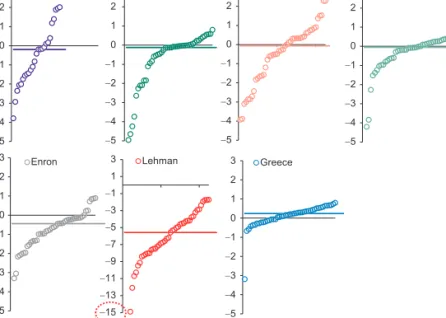
RECURRENT EPISODES OF GLOBAL FINANCIAL STRESS
This chapter first discusses the identification of global financial shocks and the behavior of key global variables during these episodes. The chapter then discusses the econometric methodology, presents its main findings, and reports simulation results to illustrate the changing vulnerability of EMEs to global financial shocks.

FINANCIAL INTEGRATION AND ECONOMIC FUNDAMENTALS: OPPOSING FORCES?
Norway Sweden Canada Finland Australia New Zealand Israel China, P.R., Hong Kong Singapore Brazil Chile Colombia Mexico Peru Uruguay Costa Rica Dominican Republic El Salvador Guatemala Argentina Bolivia Ecuador Paraguay VenezuelaVV Jamaica Turkey South Africa Iran Jordan India Indonesia Korea Malaysia Philippines Thailand China Bulgaria Russia Ukraine Czech Republic Slovakia Estonia Latvia Hungary Lithuania Croatia Slovenia Poland Serbia Romania. Norway Sweden Canada Finland Australia New Zealand Israel China, P.R., Hong Kong Singapore Brazil Chile Colombia Mexico Peru Uruguay Costa Rica Dominican Republic El Salvador Guatemala Argentina Bolivia Ecuador Paraguay Venezuela Jamaica Turkey South Africa Iran Jordan India Indonesia Korea Malaysia Philippines Thailand China Bulgaria Russia Ukraine Czech Republic Slovakia Estonia Latvia Hungary Lithuania Croatia Slovenia Poland Serbia Romania.

THE IMPACT OF GLOBAL FINANCIAL SHOCKS
The third feature of the analysis is that the specification allows the financial shock to interact with the economy's degree of financial integration (defined as total foreign assets plus total foreign liabilities as a percentage of GDP)9 as well as with. Similarly, high levels of external debt make an economy more vulnerable to financial shocks, regardless of the level of financial integration.
ASSESSING VULNERABILITIES
SIMULATION ANALYSIS
More recently, Bluedorn et al. (2013) and IMF (2013) have also studied the impact of global financial shocks on net flows to EMEs. Finally, Adler and Tovar (2013) have studied the impact of global financial shocks on economic activity and the role of financial integration in amplifying or mitigating such an impact.

EMPIRICAL APPROACH